Races in Salem, Wisconsin (WI) Detailed Stats
Ancestries, Foreign-born residents, place of birth

Recent posts about races in Salem, Wisconsin on our local forum with over 2,400,000 registered users:
 | housing location advice for work in Sparta: maybe West Salem or Onalaska? (3 replies) |
| La Crosse or Eau Claire for our family (6 replies) |
| if you moved away from wisconsin what would you miss (67 replies) |
| What you NEED to know before moving your family to MADISON! (93 replies) |
| leaving wisconsin survey (337 replies) |
| Onalaska, La Crosse or ? (18 replies) |
2.3% of Salem, WI residents are foreign-born (1.4% born in Europe, 0.4% born in North America, 0.3% born in Latin America), which is 120.3% less than the foreign-born rate of 5.0% across the entire state of Wisconsin.
Race distribution in Salem

- 9,45395.8%White alone
- 2482.5%Hispanic
- 500.5%Black alone
- 540.5%Two or more races
- 290.3%Asian alone
- 250.3%American Indian alone
- 100.1%Other race alone
- 20.02%Native Hawaiian and Other
Pacific Islander alone

2000
2022
-
- 4,681,63087.3%White alone
- 300,2455.6%Black alone
- 192,9213.6%Hispanic
- 87,9951.6%Asian alone
- 51,9211.0%Two or more races
- 43,9800.8%American Indian alone
- 3,6370.07%Other race alone
- 1,3460.03%Native Hawaiian and Other
Pacific Islander alone

-
- 4,654,03179.0%White alone
- 447,0227.6%Hispanic
- 345,6785.9%Black alone
- 217,5323.7%Two or more races
- 172,2422.9%Asian alone
- 33,7620.6%American Indian alone
- 19,6800.3%Other race alone
- 2,5920.04%Native Hawaiian and Other
Pacific Islander alone

Income and house value in Salem
- Median household income in 2022
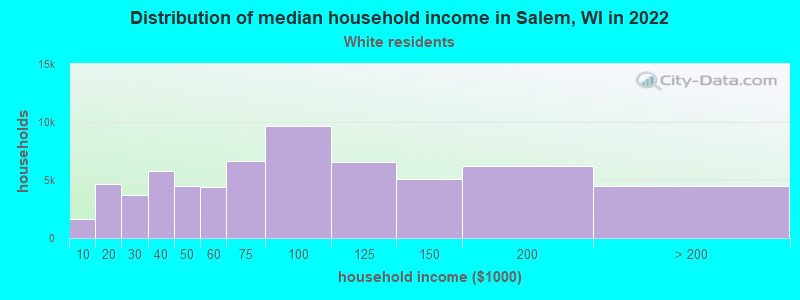
- $85,078White non-Hispanic householders
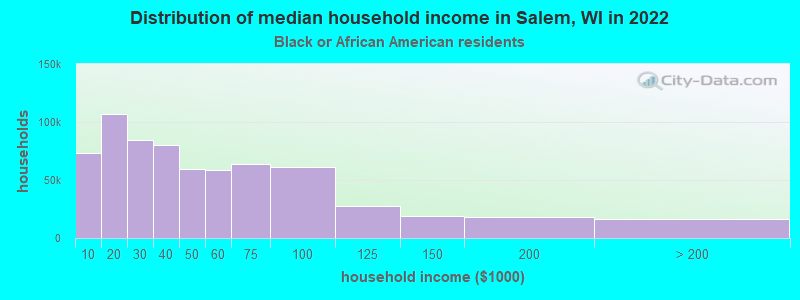
- $189,711Black householders
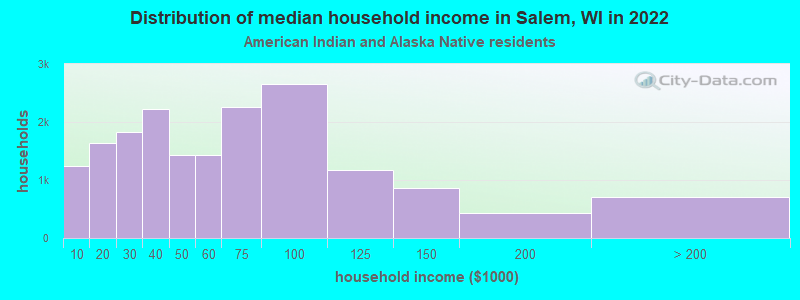
- $126,406American Indian and Alaska Native householders
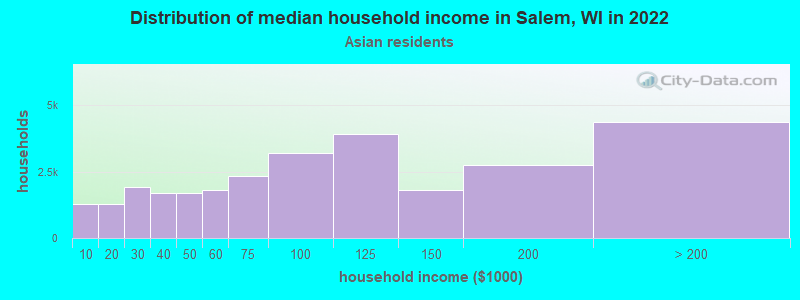
- $135,239Asian householders
- $98,784Some other race householders
- $158,131Two or more races householders
- $102,104Hispanic or Latino race householders
- Median 2022 house value
- $294,757White Non-Hispanic householders
- $553,312Black or African American householders
- $212,071American Indian or Alaska Native householders
- $258,769Asian householders
- $203,502Some other race householders
- $276,763Two or more races householders
- $196,433Hispanic or Latino householders
Household income for White non-Hispanic householders
Household income for Black householders
Household income for American Indian and Alaska Native householders
Household income for Asian householders
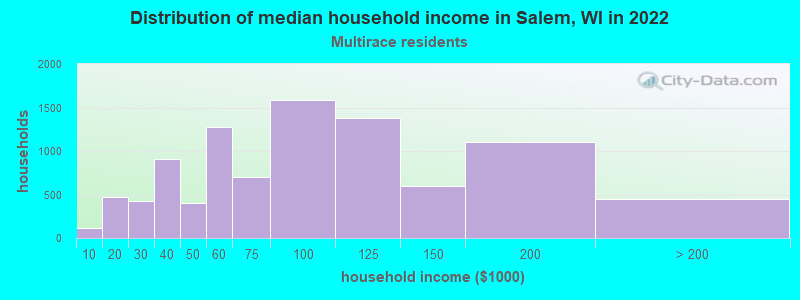
Household income for Two or more races householders
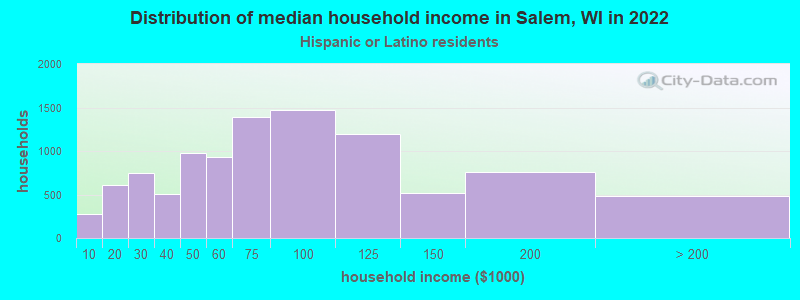
Household income for Hispanic or Latino race householders
Foreign-born residents in Salem
224 residents are foreign born (1.4% Europe, 0.4% North America, 0.3% Latin America).
| This city: | 2.3% |
| Wisconsin: | 3.6% |
Ancestries in Salem

- 3,89131.5%German
- 1,55712.6%Irish
- 1,2059.7%Polish
- 9807.9%Other
- 8016.5%English
- 7536.1%Italian
- 4563.7%United States
- 3853.1%French
- 3622.9%Swedish
- 3602.9%Norwegian
- 3212.6%Czech
- 2762.2%Dutch
- 1561.3%Scottish
- 1421.1%French Canadian
- 1331.1%Scotch-Irish
- 1080.9%Hungarian
- 990.8%Danish
- 970.8%Lithuanian
- 750.6%Welsh
- 640.5%Greek
- 430.3%Russian
- 380.3%Slovak
- 370.3%Ukrainian
- 190.2%Portuguese
- 80.06%Swiss
- 30.02%Arab
- 20.02%Subsaharan African

Zip codes: 54750.