Races in Sallisaw, Oklahoma (OK) Detailed Stats
Ancestries, Foreign-born residents, place of birth
Settings
X


Recent posts about races in Sallisaw, Oklahoma on our local forum with over 2,400,000 registered users:
 | Should Oklahoma be a midwest state, southern state, or both? (604 replies) |
| California to sallisaw oklahoma or sourounding areas?! Help! (12 replies) |
| Dust Bowl tourism (4 replies) |
| Moving to Sallisaw soon. (1 reply) |
| Foreclosures, Pre-foreclosures in Oklahoma (Sheriff's sales and Sheriff auctions) (33 replies) |
| What's Tahlequah Like? (99 replies) |
Latest news about races in Sallisaw, OK collected exclusively by city-data.com from local newspapers, TV, and radio stations
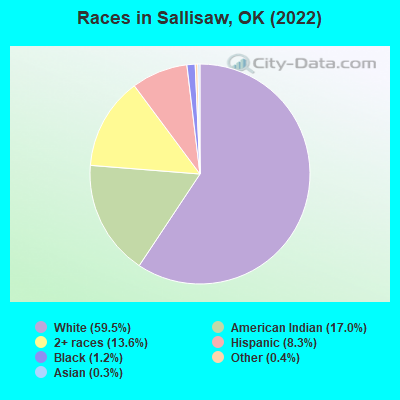
According to 2022 data, the most numerous races in Sallisaw, OK are White alone (5,135 residents), Hispanic (719 residents), and Two or more races (1,172 residents). 95.0% of Sallisaw residents speak English at home. 1.6% of Sallisaw, OK residents are foreign-born , which is 272.5% less than the foreign-born rate of 6.0% across the entire state of Oklahoma.
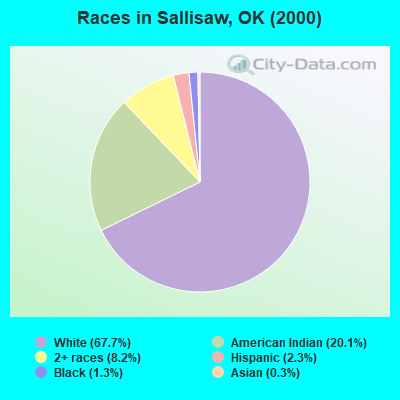
Race distribution in Sallisaw
2000
2022

- 5,41167.7%White alone
- 1,60920.1%American Indian alone
- 6568.2%Two or more races
- 1802.3%Hispanic
- 1061.3%Black alone
- 210.3%Asian alone
- 60.08%Other race alone
-
- 5,13559.5%White alone
- 1,46617.0%American Indian alone
- 1,17213.6%Two or more races
- 7198.3%Hispanic
- 1041.2%Black alone
- 330.4%Other race alone
- 290.3%Asian alone
2000
2022
-
- 2,556,36874.1%White alone
- 266,1587.7%American Indian alone
- 257,9817.5%Black alone
- 179,3045.2%Hispanic
- 140,2494.1%Two or more races
- 46,1721.3%Asian alone
- 2,3220.07%Other race alone
- 2,1000.06%Native Hawaiian and Other
Pacific Islander alone

-
- 2,517,40362.6%White alone
- 486,69212.1%Hispanic
- 364,4539.1%Two or more races
- 273,6506.8%American Indian alone
- 268,5436.7%Black alone
- 92,6722.3%Asian alone
- 10,7860.3%Other race alone
- 5,6010.1%Native Hawaiian and Other
Pacific Islander alone

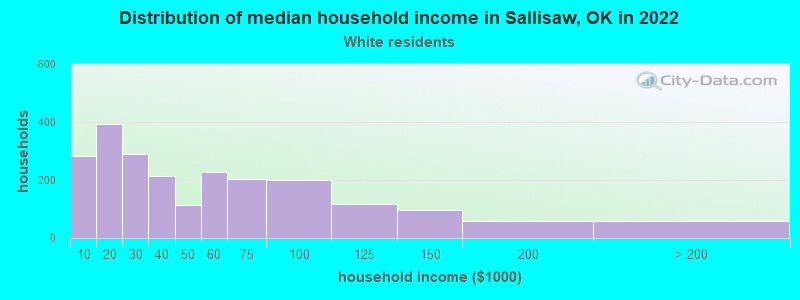
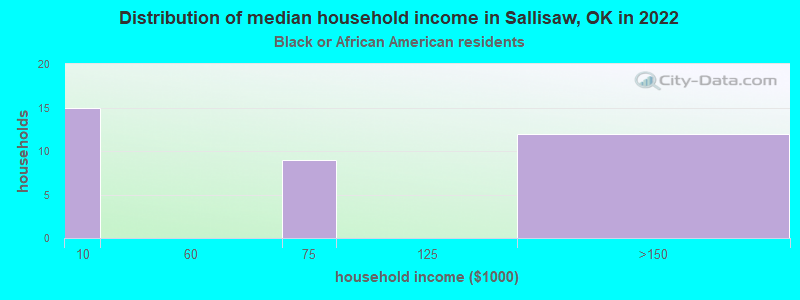
Income and house value in Sallisaw
- Median household income in 2022
- $41,227White non-Hispanic householders
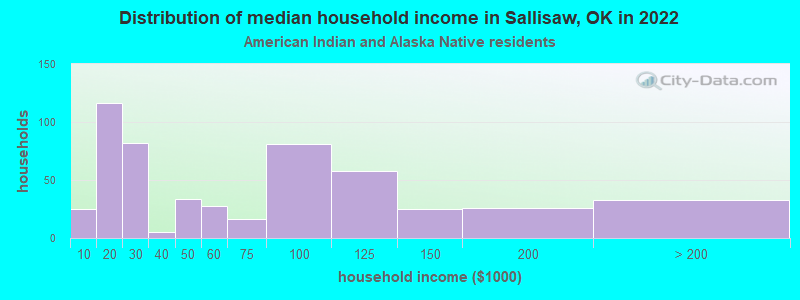
- $51,971American Indian and Alaska Native householders
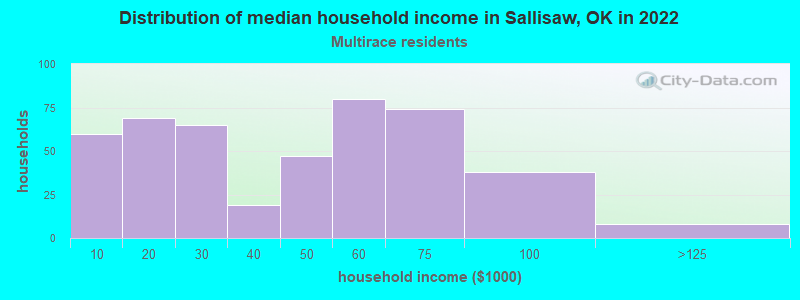
- $45,406Two or more races householders
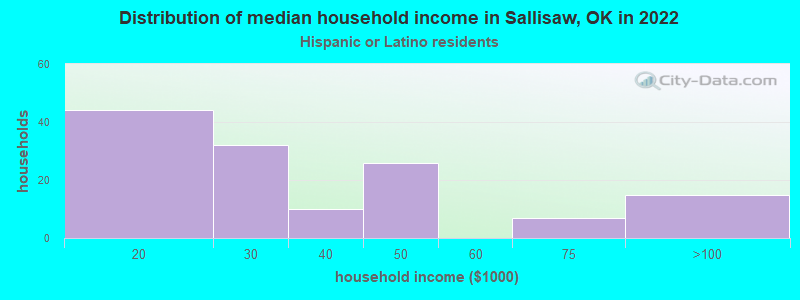
- $28,428Hispanic or Latino race householders
- Median 2022 house value
- $137,923White Non-Hispanic householders
- $61,473Black or African American householders
- $126,746American Indian or Alaska Native householders
- $190,007Asian householders
- $134,570Two or more races householders
- $122,946Hispanic or Latino householders
Household income for White non-Hispanic householders
Household income for Black householders
Household income for American Indian and Alaska Native householders
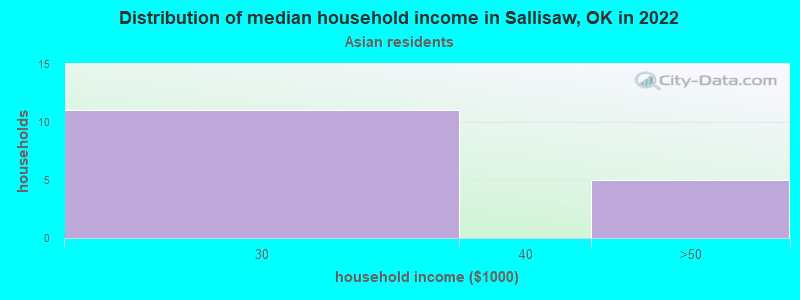
Household income for Asian householders
Household income for Two or more races householders
Household income for Hispanic or Latino race householders
Median age by race in Sallisaw
- 38.2Median age for White residents
- 36.3Males
- 40.1Females
- 46.2Median age for Black or African American residents
- 46.7Males
- 35.3Females
- 35.3Median age for American Indian / Alaska Native residents
- 37.1Males
- 34.3Females
- 68.3Median age for Asian residents
- -662,601,625.4Males
- -666,666,666.0Females
- -725,225,224.5Median age for Native Hawaiian / Pacific Islander residents
- -675,324,674.6Males
- -767,251,461.2Females
- 25.4Median age for Other race residents
- 14.7Males
- 53.9Females
- 23.2Median age for Two or more races residents
- 26.3Males
- 21.3Females
- 39.1Median age for White alone residents
- 36.6Males
- 43.4Females
- 17.7Median age for Hispanic or Latino residents
- 17.3Males
- 22.0Females
Owner/renter occupied households by race in Sallisaw
- House owners and renters - White residents
- 1,12151.1%Owner occupied
- 1,07448.9%Renter occupied
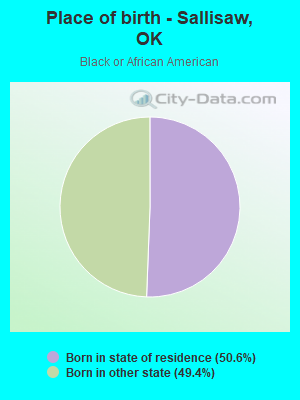
- House owners and renters - Black or African American residents
- 1131.8%Owner occupied
- 2468.2%Renter occupied
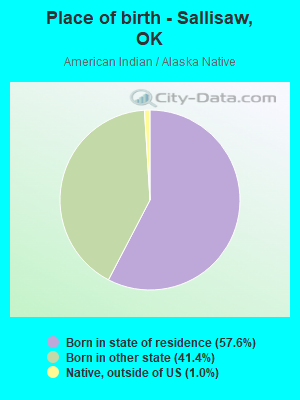
- House owners and renters - American Indian / Alaska Native residents
- 34765.4%Owner occupied
- 18334.6%Renter occupied
- House owners and renters - Asian residents
- 18100.0%Owner occupied
- House owners and renters - Other race residents
- 11100.0%Renter occupied
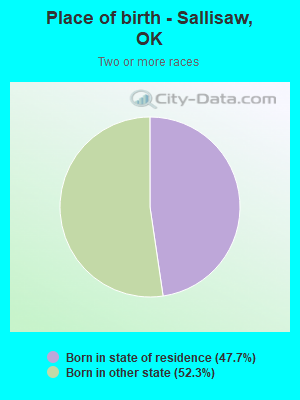
- House owners and renters - Two or more races residents
- 20243.7%Owner occupied
- 26156.3%Renter occupied
- House owners and renters - White alone residents
- 1,11351.5%Owner occupied
- 1,04848.5%Renter occupied
- House owners and renters - Hispanic or Latino residents
- 3323.9%Owner occupied
- 10676.1%Renter occupied
Language usage in Sallisaw
- English speakers - Total
- 95.0% of residents of Sallisaw speak English at home.
- 3.6% of residents speak Spanish at home
- 20069.9%Speak English very well
- 8630.1%Speak English less than very well
- 1.4% of residents speak other language at home
- 5045.0%Speak English very well
- 6155.0%Speak English less than very well
- English speakers - Born in the United States
- 94.2% of residents of Sallisaw speak English at home.
- 4.8% of residents speak Spanish at home
- 18391.5%Speak English very well
- 178.5%Speak English less than very well
- 0.9% of residents speak other language at home
- 3288.9%Speak English very well
- 411.1%Speak English less than very well
- English speakers - Native, born elsewhere
- 96.1% of residents of Sallisaw speak English at home.
- English speakers - Foreign-born
- 30.9% of residents of Sallisaw speak English at home.
- 46.0% of residents speak Spanish at home
- 23.1%Speak English very well
- 6296.9%Speak English less than very well
- 20.1% of residents speak other language at home
- 28100.0%Speak English less than very well
White (Caucasian) - Speak only English
| Native: | 99.5% (4,860) |
| Foreign-born: | 92.0% (5) |
White (Caucasian) - Speak another language
| Native: | 1.1% (55) |
| Foreign-born: | 37.1% (2) |
Other race - Speak only English
| Native: | 22.2% (35) |
| Foreign-born: | 40.3% (49) |
Other race - Speak another language
| Native: | 79.4% (126) |
| Foreign-born: | 59.8% (73) |
White alone - Speak only English
| Native: | 99.7% (4,783) |
| Foreign-born: | 57.6% (5) |
White alone - Speak another language
| Native: | 0.3% (17) |
| Foreign-born: | 43.0% (4) |
Hispanic or Latino - Speak only English
| Native: | 57.9% (284) |
| Foreign-born: | 44.2% (47) |
Hispanic or Latino - Speak another language
| Native: | 42.2% (207) |
| Foreign-born: | 59.4% (63) |
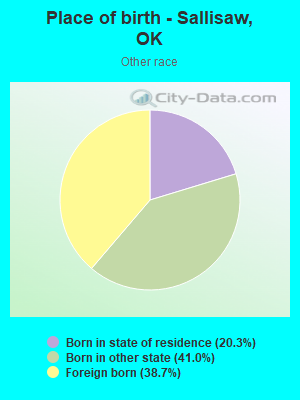
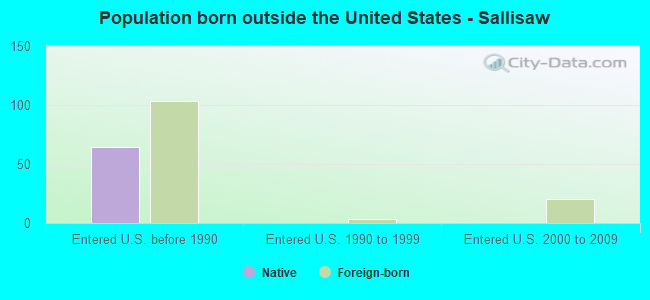
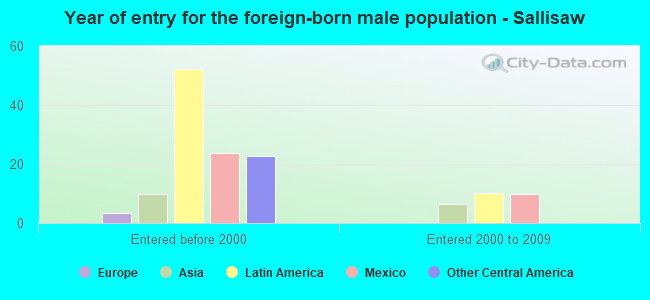
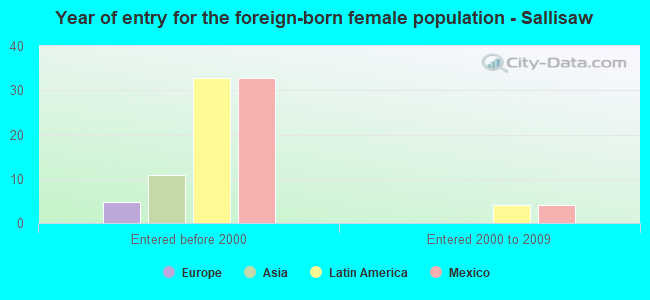
Foreign-born residents in Sallisaw
139 residents are foreign born
| This city: | 1.6% |
| Oklahoma: | 6.1% |

Marital status for residents in Sallisaw
Marital status - White (Caucasian) population 15 years and over
- Males
- 29.4%Never married
- 52.1%Now married
- 1.1%Separated
- 2.9%Widowed
- 14.4%Divorced
- Females
- 19.1%Never married
- 42.6%Now married
- 4.0%Separated
- 10.1%Widowed
- 24.2%Divorced
Women who gave birth in the past 12 months
| Now married: | 56.9% (71) |
| Unmarried: | 43.1% (54) |
Women who did not give birth in the past 12 months
| Now married: | 49.5% (523) |
| Unmarried: | 50.5% (532) |
Marital status - Black or African American population 15 years and over
- Males
- 22.6%Never married
- 50.9%Now married
- 0.0%Separated
- 22.6%Widowed
- 3.8%Divorced
- Females
- 84.8%Never married
- 15.2%Now married
- 0.0%Separated
- 0.0%Widowed
- 0.0%Divorced
Women who gave birth in the past 12 months
| Now married: | 0.0% (0) |
| Unmarried: | 100.0% (3) |
Women who did not give birth in the past 12 months
| Now married: | 23.5% (11) |
| Unmarried: | 76.5% (37) |
Marital status - American Indian / Alaska Native population 15 years and over
- Males
- 33.8%Never married
- 40.1%Now married
- 2.2%Separated
- 7.4%Widowed
- 16.5%Divorced
- Females
- 31.7%Never married
- 34.3%Now married
- 0.0%Separated
- 9.0%Widowed
- 25.0%Divorced
Women who gave birth in the past 12 months
| Now married: | 100.0% (3) |
| Unmarried: | 0.0% (0) |
Women who did not give birth in the past 12 months
| Now married: | 30.7% (113) |
| Unmarried: | 69.3% (256) |
Marital status - Asian population 15 years and over
- Males
- 0.0%Never married
- 64.7%Now married
- 0.0%Separated
- 0.0%Widowed
- 35.3%Divorced
- Females
- 0.0%Never married
- 100.0%Now married
- 0.0%Separated
- 0.0%Widowed
- 0.0%Divorced
Marital status - Other race population 15 years and over
- Males
- 29.3%Never married
- 70.7%Now married
- 0.0%Separated
- 0.0%Widowed
- 0.0%Divorced
- Females
- 0.0%Never married
- 71.7%Now married
- 0.0%Separated
- 0.0%Widowed
- 28.3%Divorced
Women who did not give birth in the past 12 months
| Now married: | 0.0% (0) |
| Unmarried: | 100.0% (10) |
Marital status - Two or more races population 15 years and over
- Males
- 35.6%Never married
- 37.4%Now married
- 0.0%Separated
- 3.6%Widowed
- 23.4%Divorced
- Females
- 23.6%Never married
- 47.2%Now married
- 0.0%Separated
- 6.2%Widowed
- 23.0%Divorced
Women who gave birth in the past 12 months
| Now married: | 100.0% (16) |
| Unmarried: | 0.0% (0) |
Women who did not give birth in the past 12 months
| Now married: | 56.3% (184) |
| Unmarried: | 43.7% (143) |
Marital status - White alone, not Hispanic / Latino population 15 years and over
- Males
- 29.5%Never married
- 52.7%Now married
- 1.1%Separated
- 2.9%Widowed
- 13.7%Divorced
- Females
- 18.4%Never married
- 43.5%Now married
- 3.5%Separated
- 10.5%Widowed
- 24.1%Divorced
Women who gave birth in the past 12 months
| Now married: | 57.3% (47) |
| Unmarried: | 42.7% (35) |
Women who did not give birth in the past 12 months
| Now married: | 51.0% (540) |
| Unmarried: | 49.0% (520) |
Marital status - Hispanic or Latino population 15 years and over
- Males
- 30.7%Never married
- 50.5%Now married
- 0.0%Separated
- 3.6%Widowed
- 15.1%Divorced
- Females
- 45.3%Never married
- 26.2%Now married
- 8.7%Separated
- 0.0%Widowed
- 19.8%Divorced
Women who gave birth in the past 12 months
| Now married: | 56.2% (30) |
| Unmarried: | 43.8% (23) |
Women who did not give birth in the past 12 months
| Now married: | 0.0% (0) |
| Unmarried: | 100.0% (68) |
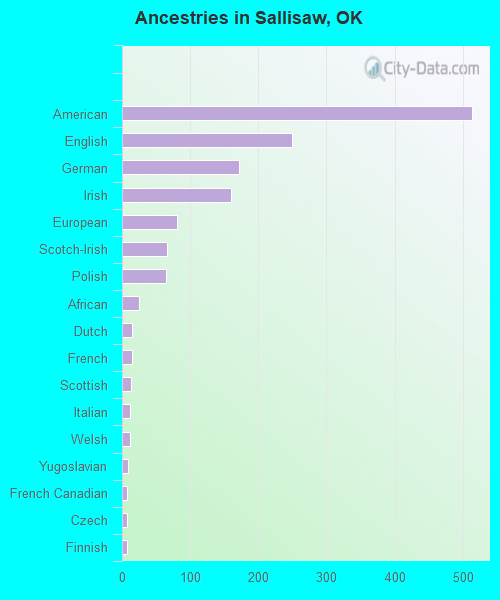
Ancestries in Sallisaw

- 51313.3%American
- 2496.4%English
- 1714.4%German
- 1604.1%Irish
- 812.1%European
- 661.7%Scotch-Irish
- 651.7%Polish
- 250.6%African
- 150.4%Dutch
- 150.4%French
- 130.3%Scottish
- 120.3%Italian
- 120.3%Welsh
- 90.2%Yugoslavian
- 80.2%French Canadian
- 70.2%Czech
- 70.2%Finnish
- 40.1%Hungarian
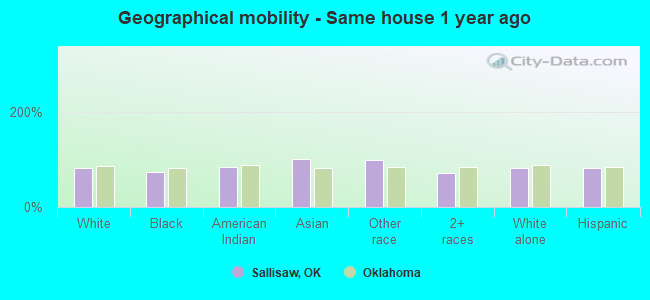
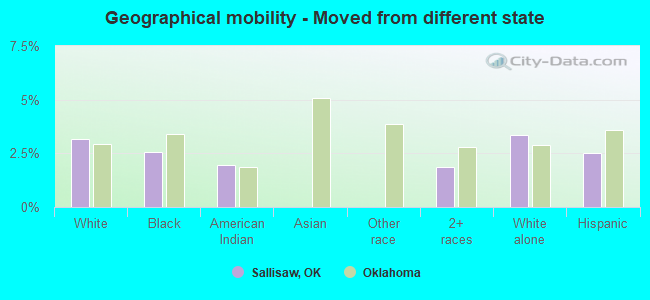
Geographical mobility in Sallisaw

- Same house 1 year ago
- 4,17180.6%White (Caucasian)
- 9574.2%Black or African American
- 1,27283.6%American Indian / Alaska Native
- 30100.0%Asian
- 30799.2%Other race
- 1,04971.8%Two or more races
- 4,11680.5%White alone, not Hispanic / Latino
- 54780.8%Hispanic or Latino
-
- Moved within same county
- 60211.6%White / Caucasian
- 1914.5%Black or African American
- 17111.3%American Indian / Alaska Native
- 29820.4%Two or more races
- 59011.6%White alone, not Hispanic / Latino
- 10715.7%Hispanic or Latino
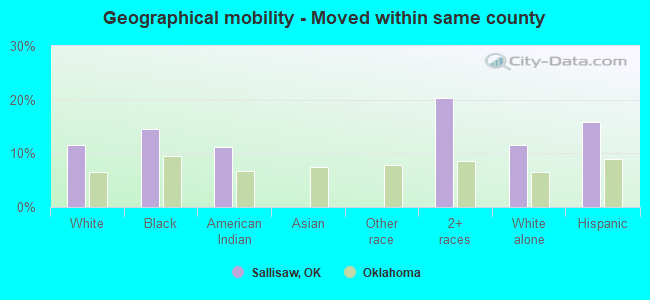
-
- Moved within same state
- 1843.6%White / Caucasian
- 96.7%Black or African American
- 322.1%American Indian / Alaska Native
- 563.8%Two or more races
- 1883.7%White alone, not Hispanic / Latino
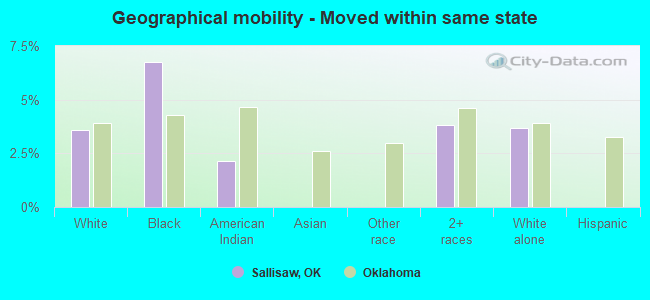
-
- Moved from different state
- 1633.2%White / Caucasian
- 32.5%Black or African American
- 291.9%American Indian / Alaska Native
- 271.8%Two or more races
- 1713.3%White alone, not Hispanic / Latino
- 172.5%Hispanic or Latino
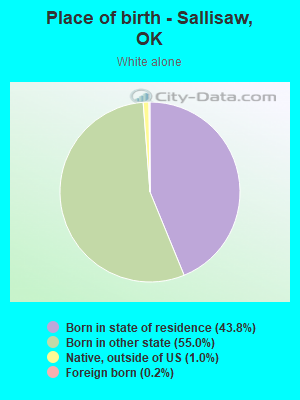
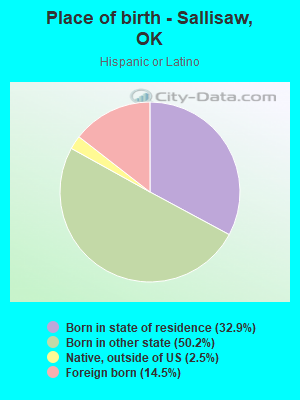
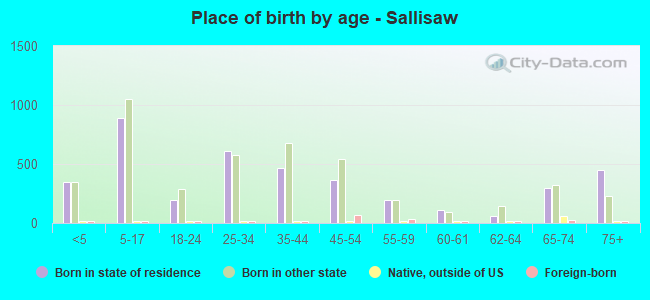
Children Nativity (place of birth) in Sallisaw
Place of birth for residents in Sallisaw
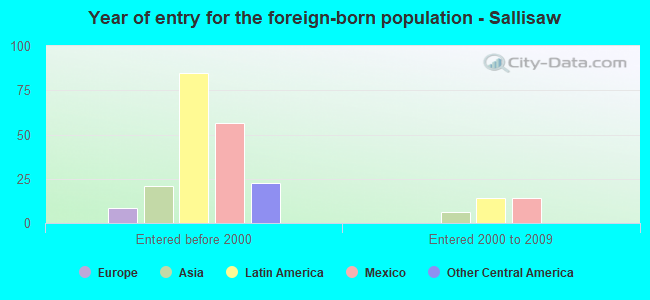
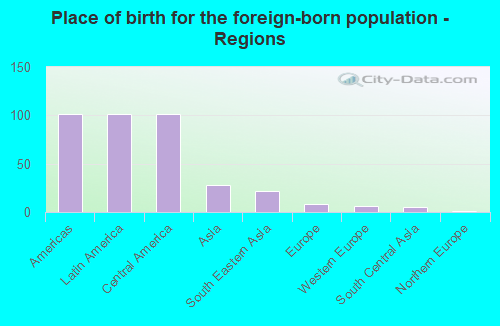
![Place of birth for the foreign-born population - Regions]()
- 101Americas
- 101Latin America
- 101Central America
- 28Asia
- 22South Eastern Asia
- 8Europe
- 6Western Europe
- 5South Central Asia
- 1Northern Europe
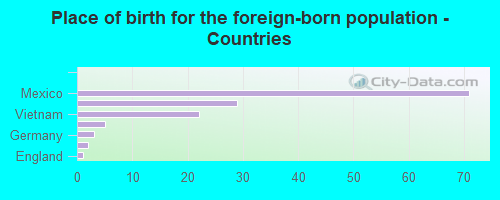
![Place of birth for the foreign-born population - Countries]()
- 71Mexico
- 29Guatemala
- 22Vietnam
- 5India
- 3Germany
- 2France
- 1England
Grandparents responsible for own grandchildren in Sallisaw
Zip codes: 74955.