Races in Sams Valley, Oregon (OR) Detailed Stats
Ancestries, Foreign-born residents, place of birth
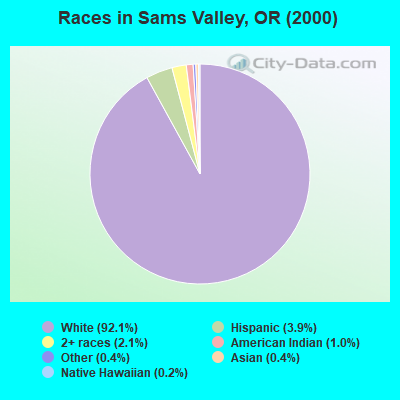
Race distribution in Sams Valley

- 4,23992.1%White alone
- 1793.9%Hispanic
- 962.1%Two or more races
- 481.0%American Indian alone
- 170.4%Asian alone
- 180.4%Other race alone
- 70.2%Native Hawaiian and Other
Pacific Islander alone - 10.02%Black alone
2000
2022
-
- 2,857,61683.5%White alone
- 275,3148.0%Hispanic
- 100,3332.9%Asian alone
- 82,7332.4%Two or more races
- 53,3251.6%Black alone
- 40,1301.2%American Indian alone
- 7,3980.2%Native Hawaiian and Other
Pacific Islander alone - 4,5500.1%Other race alone

-
- 3,037,57171.6%White alone
- 609,53814.4%Hispanic
- 252,7446.0%Two or more races
- 191,2834.5%Asian alone
- 78,2281.8%Black alone
- 29,3990.7%American Indian alone
- 25,7310.6%Other race alone
- 15,6430.4%Native Hawaiian and Other
Pacific Islander alone

Income and house value in Sams Valley
- Median household income in 2022
- $76,567White non-Hispanic householders
- $36,914American Indian and Alaska Native householders
- $107,788Asian householders
- $64,007Some other race householders
- $105,842Two or more races householders
- $54,437Hispanic or Latino race householders
- Median 2022 house value
- $408,942White Non-Hispanic householders
- $252,326American Indian or Alaska Native householders
- $725,075Asian householders
- $443,101Some other race householders
- $302,276Two or more races householders
- $273,917Hispanic or Latino householders
Household income for White non-Hispanic householders

Household income for American Indian and Alaska Native householders

Household income for Asian householders

Household income for Two or more races householders

Household income for Hispanic or Latino race householders

Zip code: 97525