Races in San Bernardino, California (CA) Detailed Stats
Data:
Races - White alone (%)
Races - White alone (% change since 2000)
Races - Black alone (%)
Races - Black alone (% change since 2000)
Races - American Indian alone (%)
Races - American Indian alone (% change since 2000)
Races - Asian alone (%)
Races - Asian alone (% change since 2000)
Races - Hispanic (%)
Races - Hispanic (% change since 2000)
Races - Native Hawaiian and Other Pacific Islander alone (%)
Races - Native Hawaiian and Other Pacific Islander alone (% change since 2000)
Races - Two or more races(%)
Races - Two or more races(% change since 2000)
Races - Other race alone (%)
Races - Other race alone (% change since 2000)
Racial diversity
Place of birth - Born in state of residence (%)
Place of birth - Born in state of residence (%) - White
Place of birth - Born in state of residence (%) - Black or African American
Place of birth - Born in state of residence (%) - Asian
Place of birth - Born in state of residence (%) - Hispanic or Latino
Place of birth - Born in state of residence (%) - American Indian and Alaska Native
Place of birth - Born in state of residence (%) - Multirace
Place of birth - Born in state of residence (%) - Other Race
Place of birth - Born in other state (%)
Place of birth - Born in other state (%) - White
Place of birth - Born in other state (%) - Black or African American
Place of birth - Born in other state (%) - Asian
Place of birth - Born in other state (%) - Hispanic or Latino
Place of birth - Born in other state (%) - American Indian and Alaska Native
Place of birth - Born in other state (%) - Multirace
Place of birth - Born in other state (%) - Other Race
Place of birth - Native, outside of US (%)
Place of birth - Native, outside of US (%) - White
Place of birth - Native, outside of US (%) - Black or African American
Place of birth - Native, outside of US (%) - Asian
Place of birth - Native, outside of US (%) - Hispanic or Latino
Place of birth - Native, outside of US (%) - American Indian and Alaska Native
Place of birth - Native, outside of US (%) - Multirace
Place of birth - Native, outside of US (%) - Other Race
Place of birth - Foreign born (%)
Place of birth - Foreign born (%) - White
Place of birth - Foreign born (%) - Black or African American
Place of birth - Foreign born (%) - Asian
Place of birth - Foreign born (%) - Hispanic or Latino
Place of birth - Foreign born (%) - American Indian and Alaska Native
Place of birth - Foreign born (%) - Multirace
Place of birth - Foreign born (%) - Other Race
Residents speaking English at home (%)
Residents speaking English at home - Born in the United States (%)
Residents speaking English at home - Native, born elsewhere (%)
Residents speaking English at home - Foreign born (%)
Residents speaking Spanish at home (%)
Residents speaking Spanish at home - Born in the United States (%)
Residents speaking Spanish at home - Native, born elsewhere (%)
Residents speaking Spanish at home - Foreign born (%)
Residents speaking other language at home (%)
Residents speaking other language at home - Born in the United States (%)
Residents speaking other language at home - Native, born elsewhere (%)
Residents speaking other language at home - Foreign born (%)
Marital status - Never married (%)
Marital status - Now married (%)
Marital status - Separated (%)
Marital status - Widowed (%)
Marital status - Divorced (%)
Ancestries Reported - Arab (%)
Ancestries Reported - Czech (%)
Ancestries Reported - Danish (%)
Ancestries Reported - Dutch (%)
Ancestries Reported - English (%)
Ancestries Reported - French (%)
Ancestries Reported - French Canadian (%)
Ancestries Reported - German (%)
Ancestries Reported - Greek (%)
Ancestries Reported - Hungarian (%)
Ancestries Reported - Irish (%)
Ancestries Reported - Italian (%)
Ancestries Reported - Lithuanian (%)
Ancestries Reported - Norwegian (%)
Ancestries Reported - Polish (%)
Ancestries Reported - Portuguese (%)
Ancestries Reported - Russian (%)
Ancestries Reported - Scotch-Irish (%)
Ancestries Reported - Scottish (%)
Ancestries Reported - Slovak (%)
Ancestries Reported - Subsaharan African (%)
Ancestries Reported - Swedish (%)
Ancestries Reported - Swiss (%)
Ancestries Reported - Ukrainian (%)
Ancestries Reported - United States (%)
Ancestries Reported - Welsh (%)
Ancestries Reported - West Indian (%)
Ancestries Reported - Other (%)
Geographical mobility - Same house 1 year ago (%)
Geographical mobility - Same house 1 year ago (%) - White
Geographical mobility - Same house 1 year ago (%) - Black or African American
Geographical mobility - Same house 1 year ago (%) - Asian
Geographical mobility - Same house 1 year ago (%) - Hispanic or Latino
Geographical mobility - Same house 1 year ago (%) - American Indian and Alaska Native
Geographical mobility - Same house 1 year ago (%) - Multirace
Geographical mobility - Same house 1 year ago (%) - Other Race
Geographical mobility - Moved within same county (%)
Geographical mobility - Moved within same county (%) - White
Geographical mobility - Moved within same county (%) - Black or African American
Geographical mobility - Moved within same county (%) - Asian
Geographical mobility - Moved within same county (%) - Hispanic or Latino
Geographical mobility - Moved within same county (%) - American Indian and Alaska Native
Geographical mobility - Moved within same county (%) - Multirace
Geographical mobility - Moved within same county (%) - Other Race
Geographical mobility - Moved from different county within same state (%)
Geographical mobility - Moved from different county within same state (%) - White
Geographical mobility - Moved from different county within same state (%) - Black or African American
Geographical mobility - Moved from different county within same state (%) - Asian
Geographical mobility - Moved from different county within same state (%) - Hispanic or Latino
Geographical mobility - Moved from different county within same state (%) - American Indian and Alaska Native
Geographical mobility - Moved from different county within same state (%) - Multirace
Geographical mobility - Moved from different county within same state (%) - Other Race
Geographical mobility - Moved from different state (%)
Geographical mobility - Moved from different state (%) - White
Geographical mobility - Moved from different state (%) - Black or African American
Geographical mobility - Moved from different state (%) - Asian
Geographical mobility - Moved from different state (%) - Hispanic or Latino
Geographical mobility - Moved from different state (%) - American Indian and Alaska Native
Geographical mobility - Moved from different state (%) - Multirace
Geographical mobility - Moved from different state (%) - Other Race
Geographical mobility - Moved from abroad (%)
Geographical mobility - Moved from abroad (%) - White
Geographical mobility - Moved from abroad (%) - Black or African American
Geographical mobility - Moved from abroad (%) - Asian
Geographical mobility - Moved from abroad (%) - Hispanic or Latino
Geographical mobility - Moved from abroad (%) - American Indian and Alaska Native
Geographical mobility - Moved from abroad (%) - Multirace
Geographical mobility - Moved from abroad (%) - Other Race
Place of birth for the foreign-born population - Ireland (%)
Place of birth for the foreign-born population - Denmark (%)
Place of birth for the foreign-born population - Norway (%)
Place of birth for the foreign-born population - Sweden (%)
Place of birth for the foreign-born population - United Kingdom (%)
Place of birth for the foreign-born population - England (%)
Place of birth for the foreign-born population - Scotland (%)
Place of birth for the foreign-born population - Other Northern Europe (%)
Place of birth for the foreign-born population - Austria (%)
Place of birth for the foreign-born population - Belgium (%)
Place of birth for the foreign-born population - France (%)
Place of birth for the foreign-born population - Germany (%)
Place of birth for the foreign-born population - Netherlands (%)
Place of birth for the foreign-born population - Switzerland (%)
Place of birth for the foreign-born population - Other Western Europe (%)
Place of birth for the foreign-born population - Greece (%)
Place of birth for the foreign-born population - Italy (%)
Place of birth for the foreign-born population - Portugal (%)
Place of birth for the foreign-born population - Spain (%)
Place of birth for the foreign-born population - Other Southern Europe (%)
Place of birth for the foreign-born population - Albania (%)
Place of birth for the foreign-born population - Belarus (%)
Place of birth for the foreign-born population - Bosnia and Herzegovina (%)
Place of birth for the foreign-born population - Bulgaria (%)
Place of birth for the foreign-born population - Croatia (%)
Place of birth for the foreign-born population - Czechoslovakia (%)
Place of birth for the foreign-born population - Hungary (%)
Place of birth for the foreign-born population - Latvia (%)
Place of birth for the foreign-born population - Lithuania (%)
Place of birth for the foreign-born population - North Macedonia (Macedonia) (%)
Place of birth for the foreign-born population - Moldova (%)
Place of birth for the foreign-born population - Poland (%)
Place of birth for the foreign-born population - Romania (%)
Place of birth for the foreign-born population - Russia (%)
Place of birth for the foreign-born population - Serbia (%)
Place of birth for the foreign-born population - Ukraine (%)
Place of birth for the foreign-born population - Other Eastern Europe (%)
Place of birth for the foreign-born population - China (%)
Place of birth for the foreign-born population - Hong Kong (%)
Place of birth for the foreign-born population - Taiwan (%)
Place of birth for the foreign-born population - Japan (%)
Place of birth for the foreign-born population - Korea (%)
Place of birth for the foreign-born population - Other Eastern Asia (%)
Place of birth for the foreign-born population - Afghanistan (%)
Place of birth for the foreign-born population - Bangladesh (%)
Place of birth for the foreign-born population - India (%)
Place of birth for the foreign-born population - Iran (%)
Place of birth for the foreign-born population - Kazakhstan (%)
Place of birth for the foreign-born population - Nepal (%)
Place of birth for the foreign-born population - Pakistan (%)
Place of birth for the foreign-born population - Sri Lanka (%)
Place of birth for the foreign-born population - Uzbekistan (%)
Place of birth for the foreign-born population - Other South Central Asia (%)
Place of birth for the foreign-born population - Burma (%)
Place of birth for the foreign-born population - Cambodia (%)
Place of birth for the foreign-born population - Indonesia (%)
Place of birth for the foreign-born population - Laos (%)
Place of birth for the foreign-born population - Malaysia (%)
Place of birth for the foreign-born population - Philippines (%)
Place of birth for the foreign-born population - Singapore (%)
Place of birth for the foreign-born population - Thailand (%)
Place of birth for the foreign-born population - Vietnam (%)
Place of birth for the foreign-born population - Other South Eastern Asia (%)
Place of birth for the foreign-born population - Armenia (%)
Place of birth for the foreign-born population - Iraq (%)
Place of birth for the foreign-born population - Israel (%)
Place of birth for the foreign-born population - Jordan (%)
Place of birth for the foreign-born population - Kuwait (%)
Place of birth for the foreign-born population - Lebanon (%)
Place of birth for the foreign-born population - Saudi Arabia (%)
Place of birth for the foreign-born population - Syria (%)
Place of birth for the foreign-born population - Turkey (%)
Place of birth for the foreign-born population - Yemen (%)
Place of birth for the foreign-born population - Other Western Asia (%)
Place of birth for the foreign-born population - Eritrea (%)
Place of birth for the foreign-born population - Ethiopia (%)
Place of birth for the foreign-born population - Kenya (%)
Place of birth for the foreign-born population - Somalia (%)
Place of birth for the foreign-born population - Uganda (%)
Place of birth for the foreign-born population - Zimbabwe (%)
Place of birth for the foreign-born population - Other Eastern Africa (%)
Place of birth for the foreign-born population - Cameroon (%)
Place of birth for the foreign-born population - Congo (%)
Place of birth for the foreign-born population - Democratic Republic of Congo (Zaire) (%)
Place of birth for the foreign-born population - Other Middle Africa (%)
Place of birth for the foreign-born population - Egypt (%)
Place of birth for the foreign-born population - Morocco (%)
Place of birth for the foreign-born population - Sudan (%)
Place of birth for the foreign-born population - Other Northern Africa (%)
Place of birth for the foreign-born population - South Africa (%)
Place of birth for the foreign-born population - Other Southern Africa (%)
Place of birth for the foreign-born population - Cabo Verde (%)
Place of birth for the foreign-born population - Ghana (%)
Place of birth for the foreign-born population - Liberia (%)
Place of birth for the foreign-born population - Nigeria (%)
Place of birth for the foreign-born population - Senegal (%)
Place of birth for the foreign-born population - Sierra Leone (%)
Place of birth for the foreign-born population - Other Western Africa (%)
Place of birth for the foreign-born population - Australia (%)
Place of birth for the foreign-born population - New Zealand (%)
Place of birth for the foreign-born population - Fiji (%)
Place of birth for the foreign-born population - Micronesia (%)
Place of birth for the foreign-born population - Bahamas (%)
Place of birth for the foreign-born population - Barbados (%)
Place of birth for the foreign-born population - Cuba (%)
Place of birth for the foreign-born population - Dominica (%)
Place of birth for the foreign-born population - Dominican Republic (%)
Place of birth for the foreign-born population - Grenada (%)
Place of birth for the foreign-born population - Haiti (%)
Place of birth for the foreign-born population - Jamaica (%)
Place of birth for the foreign-born population - St. Vincent and the Grenadines (%)
Place of birth for the foreign-born population - Trinidad and Tobago (%)
Place of birth for the foreign-born population - West Indies (%)
Place of birth for the foreign-born population - Other Caribbean (%)
Place of birth for the foreign-born population - Belize (%)
Place of birth for the foreign-born population - Costa Rica (%)
Place of birth for the foreign-born population - El Salvador (%)
Place of birth for the foreign-born population - Guatemala (%)
Place of birth for the foreign-born population - Honduras (%)
Place of birth for the foreign-born population - Mexico (%)
Place of birth for the foreign-born population - Nicaragua (%)
Place of birth for the foreign-born population - Panama (%)
Place of birth for the foreign-born population - Other Central America (%)
Place of birth for the foreign-born population - Argentina (%)
Place of birth for the foreign-born population - Bolivia (%)
Place of birth for the foreign-born population - Brazil (%)
Place of birth for the foreign-born population - Chile (%)
Place of birth for the foreign-born population - Colombia (%)
Place of birth for the foreign-born population - Ecuador (%)
Place of birth for the foreign-born population - Guyana (%)
Place of birth for the foreign-born population - Peru (%)
Place of birth for the foreign-born population - Uruguay (%)
Place of birth for the foreign-born population - Venezuela (%)
Place of birth for the foreign-born population - Other South America (%)
Place of birth for the foreign-born population - Canada (%)
Place of birth for the foreign-born population - Other Northern America (%)
Place of birth for the foreign-born population - Other (%)
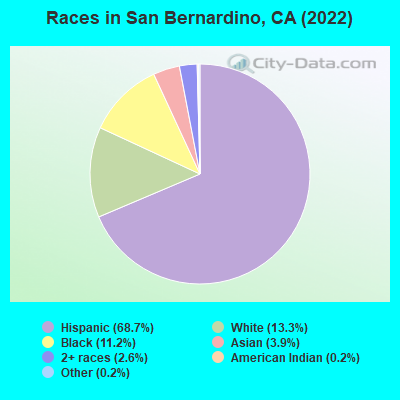
According to 2022 data, the most numerous races in San Bernardino, CA are Hispanic (142,589 residents), White alone (26,012 residents), and Asian alone (10,218 residents). 49.1% of San Bernardino residents speak English at home. 22.5% of San Bernardino, CA residents are foreign-born (18.8% born in Latin America, 3.0% born in Asia), which is 15.6% less than the foreign-born rate of 26.0% across the entire state of California.
Race distribution in San Bernardino
2000 2022
88,022 47.5% Hispanic 53,630 28.9% White alone 29,654 16.0% Black alone 7,594 4.1% Asian alone 4,502 2.4% Two or more races 1,129 0.6% American Indian alone 582 0.3% Native Hawaiian and Other 288 0.2% Other race alone
142,589 66.0% Hispanic 30,973 14.3% Black alone 26,012 12.0% White alone 10,218 4.7% Asian alone 7,677 3.6% Two or more races 217 0.1% Other race alone 311 0.1% American Indian alone 72 0.03% Native Hawaiian and Other
2000 2022
15,816,790 46.7% White alone 10,966,556 32.4% Hispanic 3,648,860 10.8% Asian alone 2,181,926 6.4% Black alone 903,115 2.7% Two or more races 178,984 0.5% American Indian alone 103,736 0.3% Native Hawaiian and Other 71,681 0.2% Other race alone
15,732,184 40.3% Hispanic 13,160,426 33.7% White alone 5,957,867 15.3% Asian alone 2,025,218 5.2% Black alone 1,663,222 4.3% Two or more races 251,618 0.6% Other race alone 135,777 0.3% Native Hawaiian and Other 103,030 0.3% American Indian alone
Income and house value in San Bernardino Median household income in 2022 $61,668 White non-Hispanic householders$38,676 Black householders$76,623 American Indian and Alaska Native householders$66,165 Asian householders$71,875 Native Hawaiian and other Pacific Islander householders$66,618 Some other race householders$40,171 Two or more races householders$68,201 Hispanic or Latino race householdersMedian 2022 house value $391,603 White Non-Hispanic householders$350,931 Black or African American householders$353,810 American Indian or Alaska Native householders $440,913 Asian householders$346,252 Native Hawaiian and other Pacific Islander householders$315,298 Some other race householders$356,330 Two or more races householders$320,337 Hispanic or Latino householders
Median age by race in San Bernardino
34.2 Median age for White residents35.0 33.4 31.9 Median age for Black or African American residents29.7 34.5 55.3 Median age for American Indian / Alaska Native residents52.4 54.2 40.3 Median age for Asian residents36.8 42.3 27.2 Median age for Native Hawaiian / Pacific Islander residents32.1 32.0 28.7 Median age for Other race residents30.8 27.1 35.3 Median age for Two or more races residents36.1 34.1 53.2 Median age for White alone residents51.4 54.1 28.8 Median age for Hispanic or Latino residents30.3 27.2
Owner/renter occupied households by race in San Bernardino
House owners and renters - White residents 17,962 57.8% Owner occupied13,111 42.2% Renter occupiedHouse owners and renters - Black or African American residents 1,854 16.9% Owner occupied9,135 83.1% Renter occupiedHouse owners and renters - American Indian / Alaska Native residents 426 53.1% Owner occupied376 46.9% Renter occupiedHouse owners and renters - Asian residents 1,612 54.0% Owner occupied1,374 46.0% Renter occupiedHouse owners and renters - Native Hawaiian / Pacific Islander residents 78 100.0% Renter occupiedHouse owners and renters - Other race residents 5,871 57.5% Owner occupied4,332 42.5% Renter occupiedHouse owners and renters - Two or more races residents 3,160 59.7% Owner occupied2,136 40.3% Renter occupiedHouse owners and renters - White alone residents 6,056 60.0% Owner occupied4,041 40.0% Renter occupiedHouse owners and renters - Hispanic or Latino residents 20,796 56.3% Owner occupied16,154 43.7% Renter occupied
Language usage in San Bernardino
English speakers - Total 49.1% of residents of San Bernardino speak English at home.
45.7% of residents speak Spanish at home 59,004 64.5% Speak English very well32,453 35.5% Speak English less than very well4.8% of residents speak other language at home 5,649 58.9% Speak English very well3,934 41.1% Speak English less than very well
English speakers - Born in the United States 82.4% of residents of San Bernardino speak English at home.
15.6% of residents speak Spanish at home 2,596 78.2% Speak English very well724 21.8% Speak English less than very well1.8% of residents speak other language at home 371 94.4% Speak English very well22 5.6% Speak English less than very well
English speakers - Native, born elsewhere 47.5% of residents of San Bernardino speak English at home.
40.4% of residents speak Spanish at home 721 69.5% Speak English very well317 30.5% Speak English less than very well12.8% of residents speak other language at home 232 70.5% Speak English very well97 29.5% Speak English less than very well
English speakers - Foreign-born 6.4% of residents of San Bernardino speak English at home.
77.0% of residents speak Spanish at home 11,820 31.8% Speak English very well25,314 68.2% Speak English less than very well14.3% of residents speak other language at home 3,348 48.5% Speak English very well3,557 51.5% Speak English less than very well
White (Caucasian) - Speak only English Native:
63.6% (47,309)Foreign-born:
6.2% (1,142)
White (Caucasian) - Speak another language Native:
30.2% (22,446)Foreign-born:
90.2% (16,702)
Black or African American - Speak only English Native:
95.4% (26,040)Foreign-born:
19.4% (169)
Black or African American - Speak another language Native:
4.8% (1,311)Foreign-born:
87.3% (758)
American Indian / Alaska Native - Speak only English Native:
62.3% (850)Foreign-born:
19.3% (57)
American Indian / Alaska Native - Speak another language Native:
37.2% (507)Foreign-born:
81.0% (240)
Asian - Speak only English Native:
44.8% (1,467)Foreign-born:
5.7% (389)
Asian - Speak another language Native:
54.3% (1,778)Foreign-born:
93.7% (6,370)
Native Hawaiian / Pacific Islander - Speak another language Native:
47.7% (347)Foreign-born:
100.0% (37)
Other race - Speak only English Native:
38.2% (10,732)Foreign-born:
11.2% (1,441)
Other race - Speak another language Native:
62.7% (17,641)Foreign-born:
90.5% (11,635)
Two or more races - Speak only English Native:
54.2% (10,450)Foreign-born:
8.5% (579)
Two or more races - Speak another language Native:
63.9% (12,308)Foreign-born:
92.2% (6,257)
White alone - Speak only English Native:
94.7% (23,290)Foreign-born:
33.8% (245)
White alone - Speak another language Native:
5.3% (1,316)Foreign-born:
66.1% (479)
Hispanic or Latino - Speak only English Native:
45.3% (43,638)Foreign-born:
6.9% (2,634)
Hispanic or Latino - Speak another language Native:
55.0% (52,951)Foreign-born:
93.5% (35,765)
Foreign-born residents in San Bernardino 49,416 residents are foreign born (18.8% Latin America , 3.0% Asia ).
This city:
22.5%California:
100.0%
Marital status for residents in San Bernardino Marital status - White (Caucasian) population 15 years and over
Males 48.3% Never married38.6% Now married2.8% Separated1.7% Widowed8.5% DivorcedFemales 37.0% Never married42.0% Now married2.2% Separated7.7% Widowed11.0% DivorcedWomen who gave birth in the past 12 months Now married:
50.1% (543)Unmarried:
49.9% (540)
Women who did not give birth in the past 12 months Now married:
42.9% (9,146)Unmarried:
57.1% (12,166)
Marital status - Black or African American population 15 years and over
Males 63.9% Never married23.1% Now married2.7% Separated2.1% Widowed8.2% DivorcedFemales 53.5% Never married20.0% Now married6.1% Separated11.6% Widowed8.9% DivorcedWomen who gave birth in the past 12 months Now married:
41.9% (156)Unmarried:
58.1% (215)
Women who did not give birth in the past 12 months Now married:
22.4% (1,762)Unmarried:
77.6% (6,094)
Marital status - American Indian / Alaska Native population 15 years and over
Males 40.0% Never married38.4% Now married7.4% Separated0.7% Widowed13.5% DivorcedFemales 40.2% Never married45.5% Now married0.0% Separated4.2% Widowed10.1% DivorcedWomen who gave birth in the past 12 months Now married:
46.6% (37)Unmarried:
53.4% (42)
Women who did not give birth in the past 12 months Now married:
40.3% (254)Unmarried:
59.7% (375)
Marital status - Asian population 15 years and over
Males 52.6% Never married40.9% Now married2.2% Separated1.7% Widowed2.6% DivorcedFemales 33.6% Never married46.2% Now married0.0% Separated11.2% Widowed9.0% DivorcedWomen who gave birth in the past 12 months Now married:
77.8% (66)Unmarried:
22.2% (19)
Women who did not give birth in the past 12 months Now married:
33.5% (664)Unmarried:
66.5% (1,320)
Marital status - Native Hawaiian / Pacific Islander population 15 years and over
Males 78.9% Never married16.3% Now married0.0% Separated0.0% Widowed4.7% DivorcedFemales 49.9% Never married8.4% Now married1.2% Separated19.6% Widowed20.8% DivorcedWomen who gave birth in the past 12 months Now married:
0.0% (0)Unmarried:
100.0% (48)
Women who did not give birth in the past 12 months Now married:
12.4% (29)Unmarried:
87.6% (203)
Marital status - Other race population 15 years and over
Males 45.0% Never married42.7% Now married3.4% Separated1.8% Widowed7.2% DivorcedFemales 49.1% Never married39.6% Now married3.3% Separated3.6% Widowed4.3% DivorcedWomen who gave birth in the past 12 months Now married:
41.6% (290)Unmarried:
58.4% (408)
Women who did not give birth in the past 12 months Now married:
39.6% (5,455)Unmarried:
60.4% (8,320)
Marital status - Two or more races population 15 years and over
Males 56.3% Never married32.0% Now married1.2% Separated2.2% Widowed8.4% DivorcedFemales 46.4% Never married42.8% Now married3.4% Separated3.5% Widowed3.9% DivorcedWomen who gave birth in the past 12 months Now married:
61.9% (343)Unmarried:
38.1% (211)
Women who did not give birth in the past 12 months Now married:
25.1% (1,874)Unmarried:
74.9% (5,578)
Marital status - White alone, not Hispanic / Latino population 15 years and over
Males 38.8% Never married42.5% Now married0.9% Separated3.0% Widowed14.9% DivorcedFemales 24.5% Never married44.4% Now married1.3% Separated14.2% Widowed15.6% DivorcedWomen who gave birth in the past 12 months Now married:
28.0% (100)Unmarried:
72.0% (258)
Women who did not give birth in the past 12 months Now married:
48.0% (1,962)Unmarried:
52.0% (2,128)
Marital status - Hispanic or Latino population 15 years and over
Males 50.7% Never married37.9% Now married3.4% Separated1.4% Widowed6.6% DivorcedFemales 44.1% Never married40.6% Now married2.8% Separated5.0% Widowed7.5% DivorcedWomen who gave birth in the past 12 months Now married:
54.8% (945)Unmarried:
45.2% (781)
Women who did not give birth in the past 12 months Now married:
41.0% (14,967)Unmarried:
59.0% (21,505)
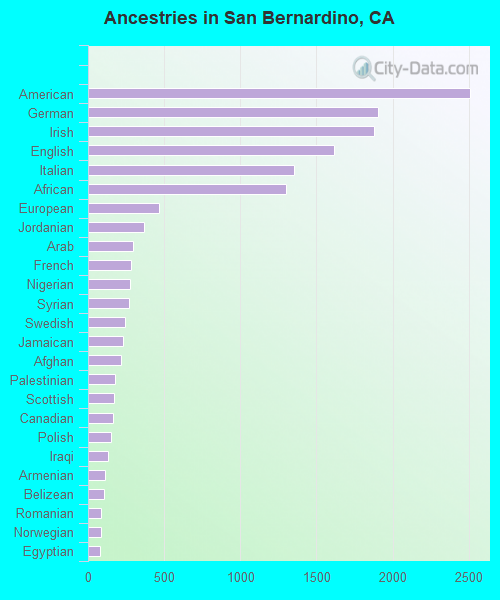
Ancestries in San Bernardino
1,929 1.3% American1,536 1.0% German1,073 0.7% Irish984 0.7% European966 0.6% Italian934 0.6% African782 0.5% English607 0.4% Jamaican551 0.4% Nigerian319 0.2% Jordanian285 0.2% French279 0.2% Polish236 0.2% Arab217 0.1% Norwegian209 0.1% Swedish191 0.1% Dutch168 0.1% Afghan165 0.1% Romanian156 0.1% Ethiopian154 0.1% Scottish150 0.10% Syrian134 0.09% Scotch-Irish122 0.08% Belizean122 0.08% French Canadian119 0.08% Armenian103 0.07% Hungarian93 0.06% Portuguese91 0.06% Canadian83 0.06% Greek77 0.05% Eastern European70 0.05% Trinidadian and Tobagonian69 0.05% Lebanese63 0.04% British60 0.04% Danish59 0.04% Palestinian56 0.04% Haitian55 0.04% Russian49 0.03% West Indian45 0.03% Moroccan41 0.03% Iranian41 0.03% Czech36 0.02% Finnish34 0.02% Ukrainian34 0.02% Slavic33 0.02% Northern European29 0.02% Egyptian27 0.02% Brazilian21 0.01% Scandinavian20 0.01% Swiss16 0.01% Ghanaian16 0.01% Welsh16 0.01% Serbian15 0.01% Lithuanian14 0.01% Sudanese14 0.01% Kenyan14 0.01% Austrian
Geographical mobility in San Bernardino Same house 1 year ago 89,589 90.7% White (Caucasian)29,274 90.4% Black or African American1,630 82.5% American Indian / Alaska Native9,392 89.3% Asian610 83.8% Native Hawaiian / Pacific Islander38,892 88.3% Other race25,848 88.8% Two or more races25,492 86.8% White alone, not Hispanic / Latino123,400 87.1% Hispanic or LatinoMoved within same county 6,578 6.7% White / Caucasian1,870 5.8% Black or African American238 12.0% American Indian / Alaska Native806 7.7% Asian108 14.8% Native Hawaiian / Pacific Islander3,177 7.2% Other race2,465 8.5% Two or more races2,180 7.4% White alone, not Hispanic / Latino11,963 8.4% Hispanic or LatinoMoved within same state 2,276 2.3% White / Caucasian881 2.7% Black or African American88 4.5% American Indian / Alaska Native231 2.2% Asian1,683 3.8% Other race680 2.3% Two or more races1,127 3.8% White alone, not Hispanic / Latino4,749 3.4% Hispanic or LatinoMoved from different state 295 0.3% White / Caucasian406 1.3% Black or African American3 0.2% American Indian / Alaska Native36 0.3% Asian35 0.1% Other race19 0.1% Two or more races491 1.7% White alone, not Hispanic / Latino686 0.5% Hispanic or LatinoMoved from abroad 67 0.1% White134 0.4% Black or African American80 0.8% Asian42 0.1% Other race86 0.3% Two or more races90 0.3% White alone, not Hispanic / Latino330 0.2% Hispanic or Latino
Children Nativity (place of birth) in San Bernardino
Children under 6 years - Living with two parents Both parents native 2,817 100.0% NativeBoth parents foreign-born 1,521 100.0% NativeOne native, one foreign-born parent 1,514 100.0% NativeChildren under 6 years - Living with one parent Native parent 7,697 100.0% Native1 0.0% Foreign-bornForeign-born parent 1,379 95.4% Native66 4.6% Foreign-bornChildren 6 to 17 years - Living with two parents Both parents native 7,493 100.0% NativeBoth parents foreign-born 7,044 85.6% Native1,186 14.4% Foreign-bornOne native, one foreign-born parent 5,335 100.0% NativeChildren 6 to 17 years - Living with one parent Native parent 14,953 100.0% NativeForeign-born parent 4,701 50.8% Native4,544 49.2% Foreign-born
Place of birth for residents in San Bernardino
Grandparents responsible for own grandchildren in San Bernardino
Grandparents (30 to 59 years) White / Caucasian 191 28.1% Responsible for grandchildren487 71.9% Not responsible for grandchildrenBlack or African American 205 56.6% Responsible for grandchildren157 43.4% Not responsible for grandchildrenAmerican Indian / Alaska Native 19 50.5% Responsible for grandchildren19 49.5% Not responsible for grandchildrenAsian 3 6.2% Responsible for grandchildren38 93.8% Not responsible for grandchildrenOther race 392 34.6% Responsible for grandchildren742 65.4% Not responsible for grandchildrenTwo or more races 114 13.0% Responsible for grandchildren759 87.0% Not responsible for grandchildrenWhite alone, not Hispanic / Latino 59 23.7% Responsible for grandchildren189 76.3% Not responsible for grandchildrenHispanic or Latino 432 23.1% Responsible for grandchildren1,439 76.9% Not responsible for grandchildrenGrandparents (60 years and over) White / Caucasian 349 26.9% Responsible for grandchildren950 73.1% Not responsible for grandchildrenBlack or African American 137 32.5% Responsible for grandchildren285 67.5% Not responsible for grandchildrenAmerican Indian / Alaska Native 22 100.0% Not responsible for grandchildrenAsian 16 9.1% Responsible for grandchildren156 90.9% Not responsible for grandchildrenOther race 219 20.9% Responsible for grandchildren830 79.1% Not responsible for grandchildrenTwo or more races 286 40.4% Responsible for grandchildren423 59.6% Not responsible for grandchildrenWhite alone, not Hispanic / Latino 192 41.8% Responsible for grandchildren268 58.2% Not responsible for grandchildrenHispanic or Latino 495 23.2% Responsible for grandchildren1,638 76.8% Not responsible for grandchildren