Races in San Clemente, California (CA) Detailed Stats
Data:
Races - White alone (%)
Races - White alone (% change since 2000)
Races - Black alone (%)
Races - Black alone (% change since 2000)
Races - American Indian alone (%)
Races - American Indian alone (% change since 2000)
Races - Asian alone (%)
Races - Asian alone (% change since 2000)
Races - Hispanic (%)
Races - Hispanic (% change since 2000)
Races - Native Hawaiian and Other Pacific Islander alone (%)
Races - Native Hawaiian and Other Pacific Islander alone (% change since 2000)
Races - Two or more races(%)
Races - Two or more races(% change since 2000)
Races - Other race alone (%)
Races - Other race alone (% change since 2000)
Racial diversity
Place of birth - Born in state of residence (%)
Place of birth - Born in state of residence (%) - White
Place of birth - Born in state of residence (%) - Black or African American
Place of birth - Born in state of residence (%) - Asian
Place of birth - Born in state of residence (%) - Hispanic or Latino
Place of birth - Born in state of residence (%) - American Indian and Alaska Native
Place of birth - Born in state of residence (%) - Multirace
Place of birth - Born in state of residence (%) - Other Race
Place of birth - Born in other state (%)
Place of birth - Born in other state (%) - White
Place of birth - Born in other state (%) - Black or African American
Place of birth - Born in other state (%) - Asian
Place of birth - Born in other state (%) - Hispanic or Latino
Place of birth - Born in other state (%) - American Indian and Alaska Native
Place of birth - Born in other state (%) - Multirace
Place of birth - Born in other state (%) - Other Race
Place of birth - Native, outside of US (%)
Place of birth - Native, outside of US (%) - White
Place of birth - Native, outside of US (%) - Black or African American
Place of birth - Native, outside of US (%) - Asian
Place of birth - Native, outside of US (%) - Hispanic or Latino
Place of birth - Native, outside of US (%) - American Indian and Alaska Native
Place of birth - Native, outside of US (%) - Multirace
Place of birth - Native, outside of US (%) - Other Race
Place of birth - Foreign born (%)
Place of birth - Foreign born (%) - White
Place of birth - Foreign born (%) - Black or African American
Place of birth - Foreign born (%) - Asian
Place of birth - Foreign born (%) - Hispanic or Latino
Place of birth - Foreign born (%) - American Indian and Alaska Native
Place of birth - Foreign born (%) - Multirace
Place of birth - Foreign born (%) - Other Race
Residents speaking English at home (%)
Residents speaking English at home - Born in the United States (%)
Residents speaking English at home - Native, born elsewhere (%)
Residents speaking English at home - Foreign born (%)
Residents speaking Spanish at home (%)
Residents speaking Spanish at home - Born in the United States (%)
Residents speaking Spanish at home - Native, born elsewhere (%)
Residents speaking Spanish at home - Foreign born (%)
Residents speaking other language at home (%)
Residents speaking other language at home - Born in the United States (%)
Residents speaking other language at home - Native, born elsewhere (%)
Residents speaking other language at home - Foreign born (%)
Marital status - Never married (%)
Marital status - Now married (%)
Marital status - Separated (%)
Marital status - Widowed (%)
Marital status - Divorced (%)
Ancestries Reported - Arab (%)
Ancestries Reported - Czech (%)
Ancestries Reported - Danish (%)
Ancestries Reported - Dutch (%)
Ancestries Reported - English (%)
Ancestries Reported - French (%)
Ancestries Reported - French Canadian (%)
Ancestries Reported - German (%)
Ancestries Reported - Greek (%)
Ancestries Reported - Hungarian (%)
Ancestries Reported - Irish (%)
Ancestries Reported - Italian (%)
Ancestries Reported - Lithuanian (%)
Ancestries Reported - Norwegian (%)
Ancestries Reported - Polish (%)
Ancestries Reported - Portuguese (%)
Ancestries Reported - Russian (%)
Ancestries Reported - Scotch-Irish (%)
Ancestries Reported - Scottish (%)
Ancestries Reported - Slovak (%)
Ancestries Reported - Subsaharan African (%)
Ancestries Reported - Swedish (%)
Ancestries Reported - Swiss (%)
Ancestries Reported - Ukrainian (%)
Ancestries Reported - United States (%)
Ancestries Reported - Welsh (%)
Ancestries Reported - West Indian (%)
Ancestries Reported - Other (%)
Geographical mobility - Same house 1 year ago (%)
Geographical mobility - Same house 1 year ago (%) - White
Geographical mobility - Same house 1 year ago (%) - Black or African American
Geographical mobility - Same house 1 year ago (%) - Asian
Geographical mobility - Same house 1 year ago (%) - Hispanic or Latino
Geographical mobility - Same house 1 year ago (%) - American Indian and Alaska Native
Geographical mobility - Same house 1 year ago (%) - Multirace
Geographical mobility - Same house 1 year ago (%) - Other Race
Geographical mobility - Moved within same county (%)
Geographical mobility - Moved within same county (%) - White
Geographical mobility - Moved within same county (%) - Black or African American
Geographical mobility - Moved within same county (%) - Asian
Geographical mobility - Moved within same county (%) - Hispanic or Latino
Geographical mobility - Moved within same county (%) - American Indian and Alaska Native
Geographical mobility - Moved within same county (%) - Multirace
Geographical mobility - Moved within same county (%) - Other Race
Geographical mobility - Moved from different county within same state (%)
Geographical mobility - Moved from different county within same state (%) - White
Geographical mobility - Moved from different county within same state (%) - Black or African American
Geographical mobility - Moved from different county within same state (%) - Asian
Geographical mobility - Moved from different county within same state (%) - Hispanic or Latino
Geographical mobility - Moved from different county within same state (%) - American Indian and Alaska Native
Geographical mobility - Moved from different county within same state (%) - Multirace
Geographical mobility - Moved from different county within same state (%) - Other Race
Geographical mobility - Moved from different state (%)
Geographical mobility - Moved from different state (%) - White
Geographical mobility - Moved from different state (%) - Black or African American
Geographical mobility - Moved from different state (%) - Asian
Geographical mobility - Moved from different state (%) - Hispanic or Latino
Geographical mobility - Moved from different state (%) - American Indian and Alaska Native
Geographical mobility - Moved from different state (%) - Multirace
Geographical mobility - Moved from different state (%) - Other Race
Geographical mobility - Moved from abroad (%)
Geographical mobility - Moved from abroad (%) - White
Geographical mobility - Moved from abroad (%) - Black or African American
Geographical mobility - Moved from abroad (%) - Asian
Geographical mobility - Moved from abroad (%) - Hispanic or Latino
Geographical mobility - Moved from abroad (%) - American Indian and Alaska Native
Geographical mobility - Moved from abroad (%) - Multirace
Geographical mobility - Moved from abroad (%) - Other Race
Place of birth for the foreign-born population - Ireland (%)
Place of birth for the foreign-born population - Denmark (%)
Place of birth for the foreign-born population - Norway (%)
Place of birth for the foreign-born population - Sweden (%)
Place of birth for the foreign-born population - United Kingdom (%)
Place of birth for the foreign-born population - England (%)
Place of birth for the foreign-born population - Scotland (%)
Place of birth for the foreign-born population - Other Northern Europe (%)
Place of birth for the foreign-born population - Austria (%)
Place of birth for the foreign-born population - Belgium (%)
Place of birth for the foreign-born population - France (%)
Place of birth for the foreign-born population - Germany (%)
Place of birth for the foreign-born population - Netherlands (%)
Place of birth for the foreign-born population - Switzerland (%)
Place of birth for the foreign-born population - Other Western Europe (%)
Place of birth for the foreign-born population - Greece (%)
Place of birth for the foreign-born population - Italy (%)
Place of birth for the foreign-born population - Portugal (%)
Place of birth for the foreign-born population - Spain (%)
Place of birth for the foreign-born population - Other Southern Europe (%)
Place of birth for the foreign-born population - Albania (%)
Place of birth for the foreign-born population - Belarus (%)
Place of birth for the foreign-born population - Bosnia and Herzegovina (%)
Place of birth for the foreign-born population - Bulgaria (%)
Place of birth for the foreign-born population - Croatia (%)
Place of birth for the foreign-born population - Czechoslovakia (%)
Place of birth for the foreign-born population - Hungary (%)
Place of birth for the foreign-born population - Latvia (%)
Place of birth for the foreign-born population - Lithuania (%)
Place of birth for the foreign-born population - North Macedonia (Macedonia) (%)
Place of birth for the foreign-born population - Moldova (%)
Place of birth for the foreign-born population - Poland (%)
Place of birth for the foreign-born population - Romania (%)
Place of birth for the foreign-born population - Russia (%)
Place of birth for the foreign-born population - Serbia (%)
Place of birth for the foreign-born population - Ukraine (%)
Place of birth for the foreign-born population - Other Eastern Europe (%)
Place of birth for the foreign-born population - China (%)
Place of birth for the foreign-born population - Hong Kong (%)
Place of birth for the foreign-born population - Taiwan (%)
Place of birth for the foreign-born population - Japan (%)
Place of birth for the foreign-born population - Korea (%)
Place of birth for the foreign-born population - Other Eastern Asia (%)
Place of birth for the foreign-born population - Afghanistan (%)
Place of birth for the foreign-born population - Bangladesh (%)
Place of birth for the foreign-born population - India (%)
Place of birth for the foreign-born population - Iran (%)
Place of birth for the foreign-born population - Kazakhstan (%)
Place of birth for the foreign-born population - Nepal (%)
Place of birth for the foreign-born population - Pakistan (%)
Place of birth for the foreign-born population - Sri Lanka (%)
Place of birth for the foreign-born population - Uzbekistan (%)
Place of birth for the foreign-born population - Other South Central Asia (%)
Place of birth for the foreign-born population - Burma (%)
Place of birth for the foreign-born population - Cambodia (%)
Place of birth for the foreign-born population - Indonesia (%)
Place of birth for the foreign-born population - Laos (%)
Place of birth for the foreign-born population - Malaysia (%)
Place of birth for the foreign-born population - Philippines (%)
Place of birth for the foreign-born population - Singapore (%)
Place of birth for the foreign-born population - Thailand (%)
Place of birth for the foreign-born population - Vietnam (%)
Place of birth for the foreign-born population - Other South Eastern Asia (%)
Place of birth for the foreign-born population - Armenia (%)
Place of birth for the foreign-born population - Iraq (%)
Place of birth for the foreign-born population - Israel (%)
Place of birth for the foreign-born population - Jordan (%)
Place of birth for the foreign-born population - Kuwait (%)
Place of birth for the foreign-born population - Lebanon (%)
Place of birth for the foreign-born population - Saudi Arabia (%)
Place of birth for the foreign-born population - Syria (%)
Place of birth for the foreign-born population - Turkey (%)
Place of birth for the foreign-born population - Yemen (%)
Place of birth for the foreign-born population - Other Western Asia (%)
Place of birth for the foreign-born population - Eritrea (%)
Place of birth for the foreign-born population - Ethiopia (%)
Place of birth for the foreign-born population - Kenya (%)
Place of birth for the foreign-born population - Somalia (%)
Place of birth for the foreign-born population - Uganda (%)
Place of birth for the foreign-born population - Zimbabwe (%)
Place of birth for the foreign-born population - Other Eastern Africa (%)
Place of birth for the foreign-born population - Cameroon (%)
Place of birth for the foreign-born population - Congo (%)
Place of birth for the foreign-born population - Democratic Republic of Congo (Zaire) (%)
Place of birth for the foreign-born population - Other Middle Africa (%)
Place of birth for the foreign-born population - Egypt (%)
Place of birth for the foreign-born population - Morocco (%)
Place of birth for the foreign-born population - Sudan (%)
Place of birth for the foreign-born population - Other Northern Africa (%)
Place of birth for the foreign-born population - South Africa (%)
Place of birth for the foreign-born population - Other Southern Africa (%)
Place of birth for the foreign-born population - Cabo Verde (%)
Place of birth for the foreign-born population - Ghana (%)
Place of birth for the foreign-born population - Liberia (%)
Place of birth for the foreign-born population - Nigeria (%)
Place of birth for the foreign-born population - Senegal (%)
Place of birth for the foreign-born population - Sierra Leone (%)
Place of birth for the foreign-born population - Other Western Africa (%)
Place of birth for the foreign-born population - Australia (%)
Place of birth for the foreign-born population - New Zealand (%)
Place of birth for the foreign-born population - Fiji (%)
Place of birth for the foreign-born population - Micronesia (%)
Place of birth for the foreign-born population - Bahamas (%)
Place of birth for the foreign-born population - Barbados (%)
Place of birth for the foreign-born population - Cuba (%)
Place of birth for the foreign-born population - Dominica (%)
Place of birth for the foreign-born population - Dominican Republic (%)
Place of birth for the foreign-born population - Grenada (%)
Place of birth for the foreign-born population - Haiti (%)
Place of birth for the foreign-born population - Jamaica (%)
Place of birth for the foreign-born population - St. Vincent and the Grenadines (%)
Place of birth for the foreign-born population - Trinidad and Tobago (%)
Place of birth for the foreign-born population - West Indies (%)
Place of birth for the foreign-born population - Other Caribbean (%)
Place of birth for the foreign-born population - Belize (%)
Place of birth for the foreign-born population - Costa Rica (%)
Place of birth for the foreign-born population - El Salvador (%)
Place of birth for the foreign-born population - Guatemala (%)
Place of birth for the foreign-born population - Honduras (%)
Place of birth for the foreign-born population - Mexico (%)
Place of birth for the foreign-born population - Nicaragua (%)
Place of birth for the foreign-born population - Panama (%)
Place of birth for the foreign-born population - Other Central America (%)
Place of birth for the foreign-born population - Argentina (%)
Place of birth for the foreign-born population - Bolivia (%)
Place of birth for the foreign-born population - Brazil (%)
Place of birth for the foreign-born population - Chile (%)
Place of birth for the foreign-born population - Colombia (%)
Place of birth for the foreign-born population - Ecuador (%)
Place of birth for the foreign-born population - Guyana (%)
Place of birth for the foreign-born population - Peru (%)
Place of birth for the foreign-born population - Uruguay (%)
Place of birth for the foreign-born population - Venezuela (%)
Place of birth for the foreign-born population - Other South America (%)
Place of birth for the foreign-born population - Canada (%)
Place of birth for the foreign-born population - Other Northern America (%)
Place of birth for the foreign-born population - Other (%)
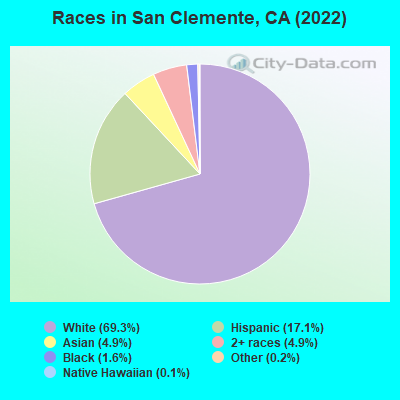
According to 2022 data, the most numerous races in San Clemente, CA are Hispanic (10,852 residents), White alone (45,057 residents), and Asian alone (2,993 residents). 84.8% of San Clemente residents speak English at home. 12.1% of San Clemente, CA residents are foreign-born (5.2% born in Latin America, 3.3% born in Asia, 2.5% born in Europe), which is 114.4% less than the foreign-born rate of 26.0% across the entire state of California.
Race distribution in San Clemente
2000 2022
15,816,790 46.7% White alone 10,966,556 32.4% Hispanic 3,648,860 10.8% Asian alone 2,181,926 6.4% Black alone 903,115 2.7% Two or more races 178,984 0.5% American Indian alone 103,736 0.3% Native Hawaiian and Other 71,681 0.2% Other race alone
15,732,184 40.3% Hispanic 13,160,426 33.7% White alone 5,957,867 15.3% Asian alone 2,025,218 5.2% Black alone 1,663,222 4.3% Two or more races 251,618 0.6% Other race alone 135,777 0.3% Native Hawaiian and Other 103,030 0.3% American Indian alone
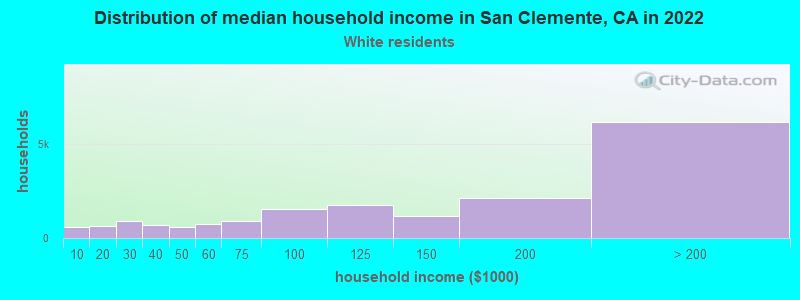
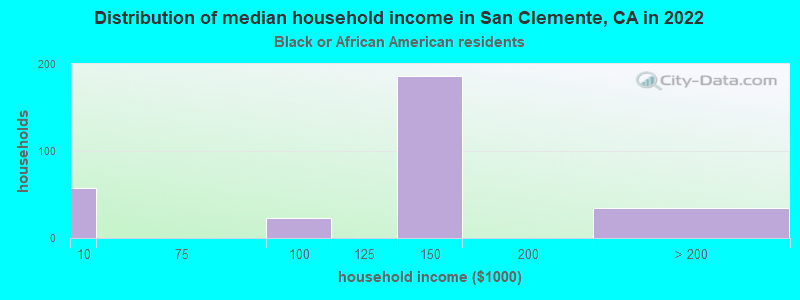
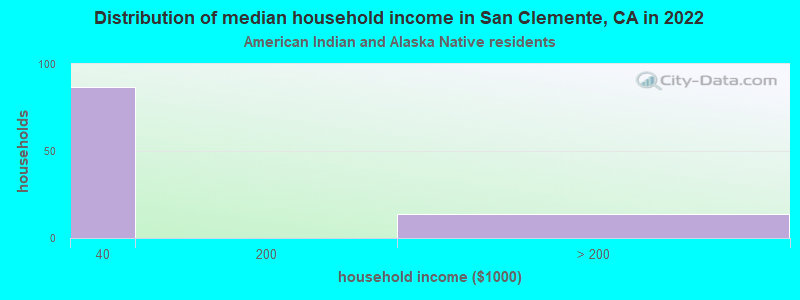
Income and house value in San Clemente Median household income in 2022 $157,506 White non-Hispanic householdersover $200,000 Black householders$130,340 American Indian and Alaska Native householders$153,585 Asian householdersover $200,000 Native Hawaiian and other Pacific Islander householders$87,846 Some other race householders$170,258 Two or more races householders$117,876 Hispanic or Latino race householdersMedian 2022 house value over $1,000,000 White Non-Hispanic householders$877,508 Black or African American householdersover $1,000,000 American Indian or Alaska Native householders over $1,000,000 Asian householdersover $1,000,000 Native Hawaiian and other Pacific Islander householdersover $1,000,000 Some other race householders$939,776 Two or more races householdersover $1,000,000 Hispanic or Latino householders
Median age by race in San Clemente
47.3 Median age for White residents42.5 50.9 38.9 Median age for Black or African American residents41.9 27.9 38.1 Median age for American Indian / Alaska Native residents34.9 40.6 45.7 Median age for Asian residents51.5 41.2 53.0 Median age for Native Hawaiian / Pacific Islander residents26.2 Median age for Other race residents33.3 19.4 32.7 Median age for Two or more races residents34.3 28.9 45.8 Median age for White alone residents40.9 49.5 27.0 Median age for Hispanic or Latino residents27.3 23.7
Owner/renter occupied households by race in San Clemente
House owners and renters - White residents 13,718 75.4% Owner occupied4,476 24.6% Renter occupiedHouse owners and renters - Black or African American residents 62 50.7% Owner occupied61 49.3% Renter occupiedHouse owners and renters - American Indian / Alaska Native residents 47 53.9% Owner occupied40 46.1% Renter occupiedHouse owners and renters - Asian residents 819 82.0% Owner occupied180 18.0% Renter occupiedHouse owners and renters - Native Hawaiian / Pacific Islander residents 52 100.0% Renter occupiedHouse owners and renters - Other race residents 350 58.9% Owner occupied245 41.1% Renter occupiedHouse owners and renters - Two or more races residents 1,549 51.9% Owner occupied1,438 48.1% Renter occupiedHouse owners and renters - White alone residents 14,126 75.5% Owner occupied4,596 24.5% Renter occupiedHouse owners and renters - Hispanic or Latino residents 911 53.0% Owner occupied809 47.0% Renter occupied
Language usage in San Clemente
English speakers - Total 84.8% of residents of San Clemente speak English at home.
9.3% of residents speak Spanish at home 3,894 67.1% Speak English very well1,905 32.9% Speak English less than very well6.3% of residents speak other language at home 2,938 74.8% Speak English very well991 25.2% Speak English less than very well
English speakers - Born in the United States 95.5% of residents of San Clemente speak English at home.
2.7% of residents speak Spanish at home 405 84.9% Speak English very well72 15.1% Speak English less than very well1.6% of residents speak other language at home 249 88.9% Speak English very well31 11.1% Speak English less than very well
English speakers - Native, born elsewhere 80.7% of residents of San Clemente speak English at home.
6.5% of residents speak Spanish at home 57 100.0% Speak English very well12.8% of residents speak other language at home 62 54.9% Speak English very well51 45.1% Speak English less than very well
English speakers - Foreign-born 35.2% of residents of San Clemente speak English at home.
34.3% of residents speak Spanish at home 1,104 41.7% Speak English very well1,546 58.3% Speak English less than very well33.6% of residents speak other language at home 1,911 73.7% Speak English very well682 26.3% Speak English less than very well
White (Caucasian) - Speak only English Native:
100.0% (40,073)Foreign-born:
43.3% (1,115)
White (Caucasian) - Speak another language Native:
4.2% (1,690)Foreign-born:
64.3% (1,658)
Black or African American - Speak only English Native:
88.8% (316)Foreign-born:
52.4% (69)
Black or African American - Speak another language Native:
11.6% (41)Foreign-born:
42.3% (55)
Asian - Speak only English Native:
88.1% (1,239)Foreign-born:
27.8% (540)
Asian - Speak another language Native:
14.0% (196)Foreign-born:
73.9% (1,433)
Native Hawaiian / Pacific Islander - Speak another language Native:
59.1% (41)Foreign-born:
96.4% (12)
Other race - Speak only English Native:
41.8% (1,193)Foreign-born:
7.9% (162)
Other race - Speak another language Native:
58.5% (1,669)Foreign-born:
93.0% (1,913)
Two or more races - Speak only English Native:
68.6% (4,225)Foreign-born:
41.0% (865)
Two or more races - Speak another language Native:
19.5% (1,202)Foreign-born:
47.6% (1,005)
White alone - Speak only English Native:
94.7% (39,912)Foreign-born:
41.8% (993)
White alone - Speak another language Native:
5.3% (2,250)Foreign-born:
58.0% (1,378)
Hispanic or Latino - Speak only English Native:
95.9% (4,798)Foreign-born:
36.7% (693)
Hispanic or Latino - Speak another language Native:
8.4% (422)Foreign-born:
71.4% (1,347)
Foreign-born residents in San Clemente 7,901 residents are foreign born (5.2% Latin America , 3.3% Asia , 2.5% Europe ).
This city:
12.1%California:
100.0%
Marital status for residents in San Clemente Marital status - White (Caucasian) population 15 years and over
Males 30.8% Never married61.0% Now married0.7% Separated2.0% Widowed5.5% DivorcedFemales 17.8% Never married61.3% Now married1.2% Separated7.1% Widowed12.6% DivorcedWomen who gave birth in the past 12 months Now married:
100.0% (560)Unmarried:
0.0% (0)
Women who did not give birth in the past 12 months Now married:
58.2% (4,372)Unmarried:
41.8% (3,141)
Marital status - Black or African American population 15 years and over
Males 18.0% Never married58.0% Now married0.0% Separated0.0% Widowed24.0% DivorcedFemales 48.9% Never married41.7% Now married3.8% Separated4.3% Widowed1.3% DivorcedWomen who gave birth in the past 12 months Now married:
100.0% (25)Unmarried:
0.0% (0)
Women who did not give birth in the past 12 months Now married:
33.7% (53)Unmarried:
66.3% (103)
Marital status - American Indian / Alaska Native population 15 years and over
Males 38.9% Never married34.7% Now married0.0% Separated0.0% Widowed26.4% DivorcedFemales 22.5% Never married29.1% Now married0.0% Separated0.0% Widowed48.3% DivorcedWomen who did not give birth in the past 12 months Now married:
56.4% (58)Unmarried:
43.6% (45)
Marital status - Asian population 15 years and over
Males 34.7% Never married55.6% Now married0.0% Separated0.9% Widowed8.8% DivorcedFemales 17.7% Never married63.0% Now married2.7% Separated7.0% Widowed9.6% DivorcedWomen who gave birth in the past 12 months Now married:
100.0% (73)Unmarried:
0.0% (0)
Women who did not give birth in the past 12 months Now married:
54.9% (369)Unmarried:
45.1% (304)
Marital status - Native Hawaiian / Pacific Islander population 15 years and over
Males 0.0% Never married100.0% Now married0.0% Separated0.0% Widowed0.0% DivorcedFemales 84.6% Never married15.4% Now married0.0% Separated0.0% Widowed0.0% DivorcedWomen who did not give birth in the past 12 months Now married:
15.4% (10)Unmarried:
84.6% (57)
Marital status - Other race population 15 years and over
Males 44.8% Never married43.8% Now married5.3% Separated0.0% Widowed6.2% DivorcedFemales 24.4% Never married61.4% Now married3.1% Separated1.5% Widowed9.6% DivorcedWomen who gave birth in the past 12 months Now married:
100.0% (13)Unmarried:
0.0% (0)
Women who did not give birth in the past 12 months Now married:
69.9% (881)Unmarried:
30.1% (380)
Marital status - Two or more races population 15 years and over
Males 56.1% Never married36.3% Now married1.2% Separated0.0% Widowed6.4% DivorcedFemales 33.4% Never married48.5% Now married0.0% Separated5.2% Widowed12.9% DivorcedWomen who gave birth in the past 12 months Now married:
100.0% (210)Unmarried:
0.0% (0)
Women who did not give birth in the past 12 months Now married:
35.7% (604)Unmarried:
64.3% (1,088)
Marital status - White alone, not Hispanic / Latino population 15 years and over
Males 30.5% Never married61.3% Now married0.7% Separated2.2% Widowed5.3% DivorcedFemales 18.1% Never married62.2% Now married1.0% Separated6.9% Widowed11.7% DivorcedWomen who gave birth in the past 12 months Now married:
100.0% (667)Unmarried:
0.0% (0)
Women who did not give birth in the past 12 months Now married:
59.3% (4,731)Unmarried:
40.7% (3,250)
Marital status - Hispanic or Latino population 15 years and over
Males 47.4% Never married44.7% Now married2.4% Separated0.0% Widowed5.5% DivorcedFemales 25.1% Never married56.9% Now married2.6% Separated3.7% Widowed11.8% DivorcedWomen who gave birth in the past 12 months Now married:
80.4% (41)Unmarried:
19.6% (10)
Women who did not give birth in the past 12 months Now married:
57.0% (1,508)Unmarried:
43.0% (1,139)
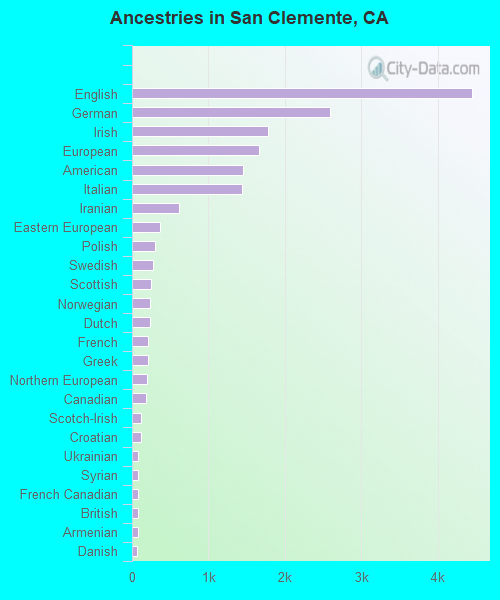
Ancestries in San Clemente
2,666 9.7% English2,095 7.6% German2,040 7.4% European1,832 6.7% American1,486 5.4% Irish1,089 4.0% Italian459 1.7% Northern European423 1.5% Swedish417 1.5% Scottish413 1.5% Polish310 1.1% Norwegian272 1.0% Eastern European256 0.9% British237 0.9% Iranian218 0.8% Dutch186 0.7% Hungarian176 0.6% Scandinavian162 0.6% Greek161 0.6% French128 0.5% Danish123 0.4% Austrian120 0.4% Jamaican117 0.4% Romanian111 0.4% Ukrainian107 0.4% Bulgarian106 0.4% Portuguese99 0.4% Canadian93 0.3% Palestinian90 0.3% Scotch-Irish77 0.3% Armenian76 0.3% Egyptian75 0.3% Lebanese62 0.2% Russian46 0.2% French Canadian46 0.2% Czech42 0.2% Croatian38 0.1% Syrian37 0.1% Slovak35 0.1% Swiss33 0.1% Czechoslovakian31 0.1% Finnish27 0.10% Welsh20 0.07% South African19 0.07% Belgian15 0.05% Afghan15 0.05% Slovene14 0.05% Turkish12 0.04% Lithuanian12 0.04% Macedonian10 0.04% Iraqi10 0.04% West Indian9 0.03% New Zealander6 0.02% Arab6 0.02% Haitian
Geographical mobility in San Clemente Same house 1 year ago 39,086 90.7% White (Caucasian)300 61.3% Black or African American357 100.0% American Indian / Alaska Native2,371 79.5% Asian87 100.0% Native Hawaiian / Pacific Islander4,176 87.7% Other race7,589 86.3% Two or more races40,206 88.0% White alone, not Hispanic / Latino9,351 86.2% Hispanic or LatinoMoved within same county 1,680 3.9% White / Caucasian74 15.0% Black or African American247 8.3% Asian294 6.2% Other race774 8.8% Two or more races3,125 6.8% White alone, not Hispanic / Latino856 7.9% Hispanic or LatinoMoved within same state 1,963 4.6% White / Caucasian84 17.2% Black or African American167 5.6% Asian211 4.4% Other race125 1.4% Two or more races1,334 2.9% White alone, not Hispanic / Latino322 3.0% Hispanic or LatinoMoved from different state 511 1.2% White / Caucasian8 1.6% Black or African American193 6.5% Asian8 0.2% Other race84 1.0% Two or more races983 2.2% White alone, not Hispanic / Latino142 1.3% Hispanic or LatinoMoved from abroad 63 0.1% White12 2.4% Black or African American25 0.8% Asian48 1.0% Other race119 1.4% Two or more races77 0.2% White alone, not Hispanic / Latino133 1.2% Hispanic or Latino
Children Nativity (place of birth) in San Clemente
Children under 6 years - Living with two parents Both parents native 2,452 100.0% NativeBoth parents foreign-born 159 91.4% Native15 8.6% Foreign-bornOne native, one foreign-born parent 514 100.0% NativeChildren under 6 years - Living with one parent Native parent 358 100.0% NativeForeign-born parent 55 100.0% NativeChildren 6 to 17 years - Living with two parents Both parents native 6,352 100.0% Native0 0.0% Foreign-bornBoth parents foreign-born 703 91.4% Native66 8.6% Foreign-bornOne native, one foreign-born parent 599 100.0% NativeChildren 6 to 17 years - Living with one parent Native parent 1,554 100.0% NativeForeign-born parent 239 50.0% Native239 50.0% Foreign-born
Grandparents responsible for own grandchildren in San Clemente
Grandparents (30 to 59 years) White / Caucasian 88 63.0% Responsible for grandchildren52 37.0% Not responsible for grandchildrenAsian 20 100.0% Not responsible for grandchildrenOther race 32 100.0% Not responsible for grandchildrenWhite alone, not Hispanic / Latino 65 52.7% Responsible for grandchildren58 47.3% Not responsible for grandchildrenHispanic or Latino 35 53.7% Responsible for grandchildren30 46.3% Not responsible for grandchildrenGrandparents (60 years and over) White / Caucasian 71 24.2% Responsible for grandchildren224 75.8% Not responsible for grandchildrenAsian 114 100.0% Not responsible for grandchildrenWhite alone, not Hispanic / Latino 88 30.5% Responsible for grandchildren200 69.5% Not responsible for grandchildrenHispanic or Latino 124 100.0% Not responsible for grandchildren