Races in San Lorenzo, California (CA) Detailed Stats
Data:
Races - White alone (%)
Races - White alone (% change since 2000)
Races - Black alone (%)
Races - Black alone (% change since 2000)
Races - American Indian alone (%)
Races - American Indian alone (% change since 2000)
Races - Asian alone (%)
Races - Asian alone (% change since 2000)
Races - Hispanic (%)
Races - Hispanic (% change since 2000)
Races - Native Hawaiian and Other Pacific Islander alone (%)
Races - Native Hawaiian and Other Pacific Islander alone (% change since 2000)
Races - Two or more races(%)
Races - Two or more races(% change since 2000)
Races - Other race alone (%)
Races - Other race alone (% change since 2000)
Racial diversity
Place of birth - Born in state of residence (%)
Place of birth - Born in state of residence (%) - White
Place of birth - Born in state of residence (%) - Black or African American
Place of birth - Born in state of residence (%) - Asian
Place of birth - Born in state of residence (%) - Hispanic or Latino
Place of birth - Born in state of residence (%) - American Indian and Alaska Native
Place of birth - Born in state of residence (%) - Multirace
Place of birth - Born in state of residence (%) - Other Race
Place of birth - Born in other state (%)
Place of birth - Born in other state (%) - White
Place of birth - Born in other state (%) - Black or African American
Place of birth - Born in other state (%) - Asian
Place of birth - Born in other state (%) - Hispanic or Latino
Place of birth - Born in other state (%) - American Indian and Alaska Native
Place of birth - Born in other state (%) - Multirace
Place of birth - Born in other state (%) - Other Race
Place of birth - Native, outside of US (%)
Place of birth - Native, outside of US (%) - White
Place of birth - Native, outside of US (%) - Black or African American
Place of birth - Native, outside of US (%) - Asian
Place of birth - Native, outside of US (%) - Hispanic or Latino
Place of birth - Native, outside of US (%) - American Indian and Alaska Native
Place of birth - Native, outside of US (%) - Multirace
Place of birth - Native, outside of US (%) - Other Race
Place of birth - Foreign born (%)
Place of birth - Foreign born (%) - White
Place of birth - Foreign born (%) - Black or African American
Place of birth - Foreign born (%) - Asian
Place of birth - Foreign born (%) - Hispanic or Latino
Place of birth - Foreign born (%) - American Indian and Alaska Native
Place of birth - Foreign born (%) - Multirace
Place of birth - Foreign born (%) - Other Race
Residents speaking English at home (%)
Residents speaking English at home - Born in the United States (%)
Residents speaking English at home - Native, born elsewhere (%)
Residents speaking English at home - Foreign born (%)
Residents speaking Spanish at home (%)
Residents speaking Spanish at home - Born in the United States (%)
Residents speaking Spanish at home - Native, born elsewhere (%)
Residents speaking Spanish at home - Foreign born (%)
Residents speaking other language at home (%)
Residents speaking other language at home - Born in the United States (%)
Residents speaking other language at home - Native, born elsewhere (%)
Residents speaking other language at home - Foreign born (%)
Marital status - Never married (%)
Marital status - Now married (%)
Marital status - Separated (%)
Marital status - Widowed (%)
Marital status - Divorced (%)
Ancestries Reported - Arab (%)
Ancestries Reported - Czech (%)
Ancestries Reported - Danish (%)
Ancestries Reported - Dutch (%)
Ancestries Reported - English (%)
Ancestries Reported - French (%)
Ancestries Reported - French Canadian (%)
Ancestries Reported - German (%)
Ancestries Reported - Greek (%)
Ancestries Reported - Hungarian (%)
Ancestries Reported - Irish (%)
Ancestries Reported - Italian (%)
Ancestries Reported - Lithuanian (%)
Ancestries Reported - Norwegian (%)
Ancestries Reported - Polish (%)
Ancestries Reported - Portuguese (%)
Ancestries Reported - Russian (%)
Ancestries Reported - Scotch-Irish (%)
Ancestries Reported - Scottish (%)
Ancestries Reported - Slovak (%)
Ancestries Reported - Subsaharan African (%)
Ancestries Reported - Swedish (%)
Ancestries Reported - Swiss (%)
Ancestries Reported - Ukrainian (%)
Ancestries Reported - United States (%)
Ancestries Reported - Welsh (%)
Ancestries Reported - West Indian (%)
Ancestries Reported - Other (%)
Geographical mobility - Same house 1 year ago (%)
Geographical mobility - Same house 1 year ago (%) - White
Geographical mobility - Same house 1 year ago (%) - Black or African American
Geographical mobility - Same house 1 year ago (%) - Asian
Geographical mobility - Same house 1 year ago (%) - Hispanic or Latino
Geographical mobility - Same house 1 year ago (%) - American Indian and Alaska Native
Geographical mobility - Same house 1 year ago (%) - Multirace
Geographical mobility - Same house 1 year ago (%) - Other Race
Geographical mobility - Moved within same county (%)
Geographical mobility - Moved within same county (%) - White
Geographical mobility - Moved within same county (%) - Black or African American
Geographical mobility - Moved within same county (%) - Asian
Geographical mobility - Moved within same county (%) - Hispanic or Latino
Geographical mobility - Moved within same county (%) - American Indian and Alaska Native
Geographical mobility - Moved within same county (%) - Multirace
Geographical mobility - Moved within same county (%) - Other Race
Geographical mobility - Moved from different county within same state (%)
Geographical mobility - Moved from different county within same state (%) - White
Geographical mobility - Moved from different county within same state (%) - Black or African American
Geographical mobility - Moved from different county within same state (%) - Asian
Geographical mobility - Moved from different county within same state (%) - Hispanic or Latino
Geographical mobility - Moved from different county within same state (%) - American Indian and Alaska Native
Geographical mobility - Moved from different county within same state (%) - Multirace
Geographical mobility - Moved from different county within same state (%) - Other Race
Geographical mobility - Moved from different state (%)
Geographical mobility - Moved from different state (%) - White
Geographical mobility - Moved from different state (%) - Black or African American
Geographical mobility - Moved from different state (%) - Asian
Geographical mobility - Moved from different state (%) - Hispanic or Latino
Geographical mobility - Moved from different state (%) - American Indian and Alaska Native
Geographical mobility - Moved from different state (%) - Multirace
Geographical mobility - Moved from different state (%) - Other Race
Geographical mobility - Moved from abroad (%)
Geographical mobility - Moved from abroad (%) - White
Geographical mobility - Moved from abroad (%) - Black or African American
Geographical mobility - Moved from abroad (%) - Asian
Geographical mobility - Moved from abroad (%) - Hispanic or Latino
Geographical mobility - Moved from abroad (%) - American Indian and Alaska Native
Geographical mobility - Moved from abroad (%) - Multirace
Geographical mobility - Moved from abroad (%) - Other Race
Place of birth for the foreign-born population - Ireland (%)
Place of birth for the foreign-born population - Denmark (%)
Place of birth for the foreign-born population - Norway (%)
Place of birth for the foreign-born population - Sweden (%)
Place of birth for the foreign-born population - United Kingdom (%)
Place of birth for the foreign-born population - England (%)
Place of birth for the foreign-born population - Scotland (%)
Place of birth for the foreign-born population - Other Northern Europe (%)
Place of birth for the foreign-born population - Austria (%)
Place of birth for the foreign-born population - Belgium (%)
Place of birth for the foreign-born population - France (%)
Place of birth for the foreign-born population - Germany (%)
Place of birth for the foreign-born population - Netherlands (%)
Place of birth for the foreign-born population - Switzerland (%)
Place of birth for the foreign-born population - Other Western Europe (%)
Place of birth for the foreign-born population - Greece (%)
Place of birth for the foreign-born population - Italy (%)
Place of birth for the foreign-born population - Portugal (%)
Place of birth for the foreign-born population - Spain (%)
Place of birth for the foreign-born population - Other Southern Europe (%)
Place of birth for the foreign-born population - Albania (%)
Place of birth for the foreign-born population - Belarus (%)
Place of birth for the foreign-born population - Bosnia and Herzegovina (%)
Place of birth for the foreign-born population - Bulgaria (%)
Place of birth for the foreign-born population - Croatia (%)
Place of birth for the foreign-born population - Czechoslovakia (%)
Place of birth for the foreign-born population - Hungary (%)
Place of birth for the foreign-born population - Latvia (%)
Place of birth for the foreign-born population - Lithuania (%)
Place of birth for the foreign-born population - North Macedonia (Macedonia) (%)
Place of birth for the foreign-born population - Moldova (%)
Place of birth for the foreign-born population - Poland (%)
Place of birth for the foreign-born population - Romania (%)
Place of birth for the foreign-born population - Russia (%)
Place of birth for the foreign-born population - Serbia (%)
Place of birth for the foreign-born population - Ukraine (%)
Place of birth for the foreign-born population - Other Eastern Europe (%)
Place of birth for the foreign-born population - China (%)
Place of birth for the foreign-born population - Hong Kong (%)
Place of birth for the foreign-born population - Taiwan (%)
Place of birth for the foreign-born population - Japan (%)
Place of birth for the foreign-born population - Korea (%)
Place of birth for the foreign-born population - Other Eastern Asia (%)
Place of birth for the foreign-born population - Afghanistan (%)
Place of birth for the foreign-born population - Bangladesh (%)
Place of birth for the foreign-born population - India (%)
Place of birth for the foreign-born population - Iran (%)
Place of birth for the foreign-born population - Kazakhstan (%)
Place of birth for the foreign-born population - Nepal (%)
Place of birth for the foreign-born population - Pakistan (%)
Place of birth for the foreign-born population - Sri Lanka (%)
Place of birth for the foreign-born population - Uzbekistan (%)
Place of birth for the foreign-born population - Other South Central Asia (%)
Place of birth for the foreign-born population - Burma (%)
Place of birth for the foreign-born population - Cambodia (%)
Place of birth for the foreign-born population - Indonesia (%)
Place of birth for the foreign-born population - Laos (%)
Place of birth for the foreign-born population - Malaysia (%)
Place of birth for the foreign-born population - Philippines (%)
Place of birth for the foreign-born population - Singapore (%)
Place of birth for the foreign-born population - Thailand (%)
Place of birth for the foreign-born population - Vietnam (%)
Place of birth for the foreign-born population - Other South Eastern Asia (%)
Place of birth for the foreign-born population - Armenia (%)
Place of birth for the foreign-born population - Iraq (%)
Place of birth for the foreign-born population - Israel (%)
Place of birth for the foreign-born population - Jordan (%)
Place of birth for the foreign-born population - Kuwait (%)
Place of birth for the foreign-born population - Lebanon (%)
Place of birth for the foreign-born population - Saudi Arabia (%)
Place of birth for the foreign-born population - Syria (%)
Place of birth for the foreign-born population - Turkey (%)
Place of birth for the foreign-born population - Yemen (%)
Place of birth for the foreign-born population - Other Western Asia (%)
Place of birth for the foreign-born population - Eritrea (%)
Place of birth for the foreign-born population - Ethiopia (%)
Place of birth for the foreign-born population - Kenya (%)
Place of birth for the foreign-born population - Somalia (%)
Place of birth for the foreign-born population - Uganda (%)
Place of birth for the foreign-born population - Zimbabwe (%)
Place of birth for the foreign-born population - Other Eastern Africa (%)
Place of birth for the foreign-born population - Cameroon (%)
Place of birth for the foreign-born population - Congo (%)
Place of birth for the foreign-born population - Democratic Republic of Congo (Zaire) (%)
Place of birth for the foreign-born population - Other Middle Africa (%)
Place of birth for the foreign-born population - Egypt (%)
Place of birth for the foreign-born population - Morocco (%)
Place of birth for the foreign-born population - Sudan (%)
Place of birth for the foreign-born population - Other Northern Africa (%)
Place of birth for the foreign-born population - South Africa (%)
Place of birth for the foreign-born population - Other Southern Africa (%)
Place of birth for the foreign-born population - Cabo Verde (%)
Place of birth for the foreign-born population - Ghana (%)
Place of birth for the foreign-born population - Liberia (%)
Place of birth for the foreign-born population - Nigeria (%)
Place of birth for the foreign-born population - Senegal (%)
Place of birth for the foreign-born population - Sierra Leone (%)
Place of birth for the foreign-born population - Other Western Africa (%)
Place of birth for the foreign-born population - Australia (%)
Place of birth for the foreign-born population - New Zealand (%)
Place of birth for the foreign-born population - Fiji (%)
Place of birth for the foreign-born population - Micronesia (%)
Place of birth for the foreign-born population - Bahamas (%)
Place of birth for the foreign-born population - Barbados (%)
Place of birth for the foreign-born population - Cuba (%)
Place of birth for the foreign-born population - Dominica (%)
Place of birth for the foreign-born population - Dominican Republic (%)
Place of birth for the foreign-born population - Grenada (%)
Place of birth for the foreign-born population - Haiti (%)
Place of birth for the foreign-born population - Jamaica (%)
Place of birth for the foreign-born population - St. Vincent and the Grenadines (%)
Place of birth for the foreign-born population - Trinidad and Tobago (%)
Place of birth for the foreign-born population - West Indies (%)
Place of birth for the foreign-born population - Other Caribbean (%)
Place of birth for the foreign-born population - Belize (%)
Place of birth for the foreign-born population - Costa Rica (%)
Place of birth for the foreign-born population - El Salvador (%)
Place of birth for the foreign-born population - Guatemala (%)
Place of birth for the foreign-born population - Honduras (%)
Place of birth for the foreign-born population - Mexico (%)
Place of birth for the foreign-born population - Nicaragua (%)
Place of birth for the foreign-born population - Panama (%)
Place of birth for the foreign-born population - Other Central America (%)
Place of birth for the foreign-born population - Argentina (%)
Place of birth for the foreign-born population - Bolivia (%)
Place of birth for the foreign-born population - Brazil (%)
Place of birth for the foreign-born population - Chile (%)
Place of birth for the foreign-born population - Colombia (%)
Place of birth for the foreign-born population - Ecuador (%)
Place of birth for the foreign-born population - Guyana (%)
Place of birth for the foreign-born population - Peru (%)
Place of birth for the foreign-born population - Uruguay (%)
Place of birth for the foreign-born population - Venezuela (%)
Place of birth for the foreign-born population - Other South America (%)
Place of birth for the foreign-born population - Canada (%)
Place of birth for the foreign-born population - Other Northern America (%)
Place of birth for the foreign-born population - Other (%)
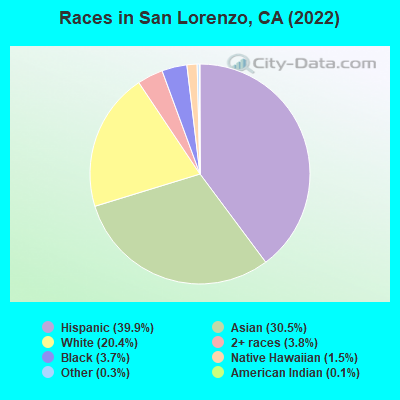
According to 2022 data, the most numerous races in San Lorenzo, CA are Hispanic (10,755 residents), White alone (5,968 residents), and Asian alone (7,158 residents). 50.7% of San Lorenzo residents speak English at home. 32.1% of San Lorenzo, CA residents are foreign-born (17.5% born in Asia, 12.6% born in Latin America), which is 19.1% greater than the foreign-born rate of 26.0% across the entire state of California.
Race distribution in San Lorenzo
2000 2022
15,816,790 46.7% White alone 10,966,556 32.4% Hispanic 3,648,860 10.8% Asian alone 2,181,926 6.4% Black alone 903,115 2.7% Two or more races 178,984 0.5% American Indian alone 103,736 0.3% Native Hawaiian and Other 71,681 0.2% Other race alone
15,732,184 40.3% Hispanic 13,160,426 33.7% White alone 5,957,867 15.3% Asian alone 2,025,218 5.2% Black alone 1,663,222 4.3% Two or more races 251,618 0.6% Other race alone 135,777 0.3% Native Hawaiian and Other 103,030 0.3% American Indian alone
Income and house value in San Lorenzo Median household income in 2022 $111,919 White non-Hispanic householders$159,387 Black householders$146,291 American Indian and Alaska Native householders$132,004 Asian householders$116,314 Native Hawaiian and other Pacific Islander householders$144,077 Some other race householders$163,431 Two or more races householders$155,572 Hispanic or Latino race householdersMedian 2022 house value $795,084 White Non-Hispanic householders$709,781 Black or African American householders$715,900 American Indian or Alaska Native householders $862,391 Asian householdersover $1,000,000 Native Hawaiian and other Pacific Islander householders$813,800 Some other race householders$833,596 Two or more races householders$800,123 Hispanic or Latino householders
Median age by race in San Lorenzo
47.0 Median age for White residents45.2 50.4 38.5 Median age for Black or African American residents37.1 49.2 33.4 Median age for American Indian / Alaska Native residents35.9 36.9 43.6 Median age for Asian residents42.1 45.2 28.3 Median age for Native Hawaiian / Pacific Islander residents26.9 51.0 34.5 Median age for Other race residents36.6 33.6 24.3 Median age for Two or more races residents24.9 23.5 56.3 Median age for White alone residents54.8 56.9 33.1 Median age for Hispanic or Latino residents32.3 34.0
Owner/renter occupied households by race in San Lorenzo
House owners and renters - White residents 2,735 75.9% Owner occupied867 24.1% Renter occupiedHouse owners and renters - Black or African American residents 131 52.0% Owner occupied120 48.0% Renter occupiedHouse owners and renters - American Indian / Alaska Native residents 75 59.6% Owner occupied51 40.4% Renter occupiedHouse owners and renters - Asian residents 1,708 77.6% Owner occupied494 22.4% Renter occupiedHouse owners and renters - Native Hawaiian / Pacific Islander residents 60 74.3% Owner occupied21 25.7% Renter occupiedHouse owners and renters - Other race residents 775 71.8% Owner occupied305 28.2% Renter occupiedHouse owners and renters - Two or more races residents 605 76.2% Owner occupied189 23.8% Renter occupiedHouse owners and renters - White alone residents 1,958 76.0% Owner occupied617 24.0% Renter occupiedHouse owners and renters - Hispanic or Latino residents 1,978 72.0% Owner occupied769 28.0% Renter occupied
Language usage in San Lorenzo
English speakers - Total 50.7% of residents of San Lorenzo speak English at home.
26.5% of residents speak Spanish at home 4,460 68.8% Speak English very well2,020 31.2% Speak English less than very well22.8% of residents speak other language at home 2,668 47.8% Speak English very well2,909 52.2% Speak English less than very well
English speakers - Born in the United States 81.4% of residents of San Lorenzo speak English at home.
11.7% of residents speak Spanish at home 235 89.4% Speak English very well28 10.6% Speak English less than very well7.1% of residents speak other language at home 153 95.0% Speak English very well8 5.0% Speak English less than very well
English speakers - Native, born elsewhere 60.7% of residents of San Lorenzo speak English at home.
23.4% of residents speak Spanish at home 58 74.4% Speak English very well20 25.6% Speak English less than very well15.6% of residents speak other language at home 43 82.7% Speak English very well9 17.3% Speak English less than very well
English speakers - Foreign-born 12.9% of residents of San Lorenzo speak English at home.
34.9% of residents speak Spanish at home 1,103 39.0% Speak English very well1,723 61.0% Speak English less than very well52.7% of residents speak other language at home 1,584 37.1% Speak English very well2,686 62.9% Speak English less than very well
White (Caucasian) - Speak only English Native:
79.7% (6,579)Foreign-born:
17.6% (228)
White (Caucasian) - Speak another language Native:
19.4% (1,603)Foreign-born:
81.4% (1,052)
Black or African American - Speak only English Native:
87.9% (552)Foreign-born:
71.1% (82)
Black or African American - Speak another language Native:
12.4% (78)Foreign-born:
42.8% (50)
American Indian / Alaska Native - Speak another language Native:
71.1% (198)Foreign-born:
100.0% (217)
Asian - Speak only English Native:
50.1% (1,187)Foreign-born:
14.5% (669)
Asian - Speak another language Native:
49.3% (1,168)Foreign-born:
86.1% (3,968)
Native Hawaiian / Pacific Islander - Speak only English Native:
95.4% (193)Foreign-born:
6.4% (10)
Native Hawaiian / Pacific Islander - Speak another language Native:
7.8% (16)Foreign-born:
93.6% (151)
Other race - Speak only English Native:
55.2% (1,325)Foreign-born:
12.0% (161)
Other race - Speak another language Native:
51.6% (1,237)Foreign-born:
91.1% (1,226)
Two or more races - Speak only English Native:
68.6% (2,276)Foreign-born:
9.3% (34)
Two or more races - Speak another language Native:
24.3% (806)Foreign-born:
90.6% (330)
White alone - Speak only English Native:
95.3% (5,149)Foreign-born:
50.7% (201)
White alone - Speak another language Native:
4.3% (235)Foreign-born:
48.1% (191)
Hispanic or Latino - Speak only English Native:
51.3% (3,812)Foreign-born:
6.6% (188)
Hispanic or Latino - Speak another language Native:
49.6% (3,685)Foreign-born:
93.7% (2,655)
Foreign-born residents in San Lorenzo 8,301 residents are foreign born (17.5% Asia , 12.6% Latin America ).
This city:
32.1%California:
100.0%
Marital status for residents in San Lorenzo Marital status - White (Caucasian) population 15 years and over
Males 38.9% Never married49.2% Now married1.1% Separated2.7% Widowed8.1% DivorcedFemales 24.8% Never married45.5% Now married3.4% Separated12.1% Widowed14.3% DivorcedWomen who gave birth in the past 12 months Now married:
100.0% (99)Unmarried:
0.0% (0)
Women who did not give birth in the past 12 months Now married:
45.9% (842)Unmarried:
54.1% (992)
Marital status - Black or African American population 15 years and over
Males 51.9% Never married38.9% Now married0.0% Separated0.8% Widowed8.4% DivorcedFemales 26.6% Never married36.6% Now married11.6% Separated0.0% Widowed25.3% DivorcedWomen who gave birth in the past 12 months Now married:
100.0% (27)Unmarried:
0.0% (0)
Women who did not give birth in the past 12 months Now married:
26.8% (29)Unmarried:
73.2% (79)
Marital status - American Indian / Alaska Native population 15 years and over
Males 42.9% Never married47.4% Now married0.0% Separated6.0% Widowed3.8% DivorcedFemales 45.3% Never married36.5% Now married0.0% Separated5.5% Widowed12.7% DivorcedWomen who did not give birth in the past 12 months Now married:
30.5% (61)Unmarried:
69.5% (139)
Marital status - Asian population 15 years and over
Males 31.2% Never married62.8% Now married1.3% Separated2.9% Widowed1.8% DivorcedFemales 24.8% Never married59.6% Now married1.6% Separated8.5% Widowed5.5% DivorcedWomen who gave birth in the past 12 months Now married:
100.0% (146)Unmarried:
0.0% (0)
Women who did not give birth in the past 12 months Now married:
54.4% (845)Unmarried:
45.6% (708)
Marital status - Native Hawaiian / Pacific Islander population 15 years and over
Males 47.7% Never married39.9% Now married12.4% Separated0.0% Widowed0.0% DivorcedFemales 39.7% Never married47.9% Now married4.8% Separated0.0% Widowed7.5% DivorcedWomen who did not give birth in the past 12 months Now married:
17.9% (14)Unmarried:
82.1% (64)
Marital status - Other race population 15 years and over
Males 29.9% Never married69.2% Now married0.0% Separated0.0% Widowed1.0% DivorcedFemales 34.4% Never married60.0% Now married0.0% Separated1.9% Widowed3.7% DivorcedWomen who gave birth in the past 12 months Now married:
100.0% (40)Unmarried:
0.0% (0)
Women who did not give birth in the past 12 months Now married:
56.4% (667)Unmarried:
43.6% (516)
Marital status - Two or more races population 15 years and over
Males 56.3% Never married37.3% Now married0.0% Separated0.8% Widowed5.6% DivorcedFemales 43.7% Never married30.5% Now married1.4% Separated3.8% Widowed20.6% DivorcedWomen who did not give birth in the past 12 months Now married:
36.7% (347)Unmarried:
63.3% (600)
Marital status - White alone, not Hispanic / Latino population 15 years and over
Males 33.2% Never married50.4% Now married0.9% Separated5.1% Widowed10.4% DivorcedFemales 20.0% Never married41.5% Now married2.1% Separated17.0% Widowed19.4% DivorcedWomen who gave birth in the past 12 months Now married:
100.0% (25)Unmarried:
0.0% (0)
Women who did not give birth in the past 12 months Now married:
40.3% (380)Unmarried:
59.7% (564)
Marital status - Hispanic or Latino population 15 years and over
Males 41.9% Never married52.9% Now married0.8% Separated0.2% Widowed4.3% DivorcedFemales 33.8% Never married51.4% Now married2.9% Separated4.4% Widowed7.5% DivorcedWomen who gave birth in the past 12 months Now married:
100.0% (151)Unmarried:
0.0% (0)
Women who did not give birth in the past 12 months Now married:
49.7% (1,345)Unmarried:
50.3% (1,363)
Ancestries in San Lorenzo
359 2.3% German298 1.9% Italian289 1.8% European249 1.6% Irish215 1.4% Portuguese211 1.3% American159 1.0% English145 0.9% British109 0.7% Polish94 0.6% Norwegian75 0.5% Brazilian70 0.4% Scotch-Irish43 0.3% Scottish42 0.3% African33 0.2% Kenyan25 0.2% Swedish21 0.1% Cape Verdean21 0.1% Yugoslavian20 0.1% Croatian18 0.1% Greek17 0.1% Russian15 0.10% French14 0.09% Finnish14 0.09% Eastern European13 0.08% Lebanese13 0.08% Iranian13 0.08% French Canadian11 0.07% Egyptian11 0.07% Guyanese11 0.07% Jamaican9 0.06% Armenian8 0.05% Czechoslovakian7 0.04% Danish7 0.04% Canadian7 0.04% Bulgarian5 0.03% Afghan4 0.03% Dutch1 0.01% Nigerian
Geographical mobility in San Lorenzo Same house 1 year ago 9,335 95.3% White (Caucasian)738 98.6% Black or African American451 100.0% American Indian / Alaska Native6,872 95.6% Asian345 90.9% Native Hawaiian / Pacific Islander3,894 97.7% Other race4,129 97.0% Two or more races5,716 93.6% White alone, not Hispanic / Latino10,344 98.2% Hispanic or LatinoMoved within same county 301 3.1% White / Caucasian22 2.9% Black or African American9 2.0% American Indian / Alaska Native126 1.8% Asian41 1.0% Other race234 5.5% Two or more races212 3.5% White alone, not Hispanic / Latino219 2.1% Hispanic or LatinoMoved within same state 82 0.8% White / Caucasian132 1.8% Asian98 2.5% Other race18 0.4% Two or more races87 1.4% White alone, not Hispanic / Latino33 0.3% Hispanic or LatinoMoved from different state 89 0.9% White / Caucasian4 0.9% Native Hawaiian / Pacific Islander20 0.5% Other race89 1.5% White alone, not Hispanic / Latino42 0.4% Hispanic or LatinoMoved from abroad 27 0.3% White1 0.1% Black or African American82 1.1% Asian35 9.1% Native Hawaiian / Pacific Islander34 0.6% White alone, not Hispanic / Latino
Children Nativity (place of birth) in San Lorenzo
Children under 6 years - Living with two parents Both parents native 612 100.0% NativeBoth parents foreign-born 377 96.0% Native16 4.0% Foreign-bornOne native, one foreign-born parent 318 100.0% NativeChildren under 6 years - Living with one parent Native parent 136 100.0% NativeForeign-born parent 38 100.0% NativeChildren 6 to 17 years - Living with two parents Both parents native 738 99.9% Native0 0.1% Foreign-bornBoth parents foreign-born 746 92.3% Native62 7.7% Foreign-bornOne native, one foreign-born parent 816 100.0% NativeChildren 6 to 17 years - Living with one parent Native parent 558 100.0% NativeForeign-born parent 239 52.0% Native220 48.0% Foreign-born
Place of birth for residents in San Lorenzo 4,546 Asia3,295 Americas3,262 Latin America2,817 Central America2,203 South Eastern Asia2,185 Eastern Asia2,048 China341 South America276 Europe164 Western Europe143 South Central Asia130 Oceania103 Caribbean55 Eastern Europe51 Africa39 Eastern Africa33 Northern America29 Northern Europe27 Southern Europe13 Western Asia11 Northern Africa10 Australia and New Zealand Subregion1 Western Africa2,483 Mexico1,564 China1,086 Philippines923 Vietnam414 Hong Kong289 El Salvador191 Bolivia158 Germany105 Brazil95 India82 Japan68 Taiwan55 Korea45 Cambodia43 Indonesia39 Kenya39 Laos33 Canada33 Burma31 Dominican Republic31 Cuba31 Thailand30 Trinidad and Tobago29 England25 Portugal21 Poland20 Pakistan18 Colombia17 Nicaragua16 Bulgaria14 Guyana13 Lebanon13 Guatemala12 Uzbekistan12 Peru10 Australia10 Jamaica10 Croatia10 Panama8 Ukraine8 Azores Islands7 Kazakhstan6 Netherlands5 Iran4 Afghanistan4 Belize2 Italy1 Nigeria
Grandparents responsible for own grandchildren in San Lorenzo
Grandparents (30 to 59 years) White / Caucasian 50 47.8% Responsible for grandchildren55 52.2% Not responsible for grandchildrenBlack or African American 10 100.0% Responsible for grandchildrenAsian 18 100.0% Not responsible for grandchildrenNative Hawaiian / Pacific Islander 48 100.0% Responsible for grandchildrenOther race 9 12.5% Responsible for grandchildren64 87.5% Not responsible for grandchildrenWhite alone, not Hispanic / Latino 17 32.4% Responsible for grandchildren36 67.6% Not responsible for grandchildrenHispanic or Latino 41 25.3% Responsible for grandchildren121 74.7% Not responsible for grandchildrenGrandparents (60 years and over) White / Caucasian 23 8.8% Responsible for grandchildren237 91.2% Not responsible for grandchildrenBlack or African American 8 100.0% Not responsible for grandchildrenAsian 24 9.9% Responsible for grandchildren219 90.1% Not responsible for grandchildrenOther race 126 100.0% Not responsible for grandchildrenWhite alone, not Hispanic / Latino 26 14.3% Responsible for grandchildren157 85.7% Not responsible for grandchildrenHispanic or Latino 15 4.1% Responsible for grandchildren346 95.9% Not responsible for grandchildren