Races in Sarasota Springs, Florida (FL) Detailed Stats
Ancestries, Foreign-born residents, place of birth
Settings
X


Recent posts about races in Sarasota Springs, Florida on our local forum with over 2,400,000 registered users:

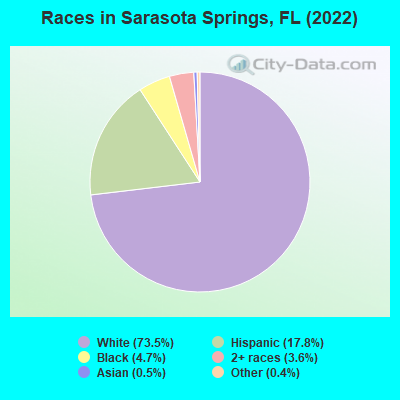
According to 2022 data, the most numerous races in Sarasota Springs, FL are White alone (9,661 residents), Hispanic (2,339 residents), and Black alone (613 residents). 82.0% of Sarasota Springs residents speak English at home. 12.7% of Sarasota Springs, FL residents are foreign-born (10.3% born in Latin America, 2.0% born in Europe), which is 66.0% less than the foreign-born rate of 21.0% across the entire state of Florida.
Race distribution in Sarasota Springs
2000
2022

- 14,67292.4%White alone
- 7594.8%Hispanic
- 1651.0%Two or more races
- 1100.7%Black alone
- 1180.7%Asian alone
- 320.2%American Indian alone
- 150.09%Other race alone
- 40.03%Native Hawaiian and Other
Pacific Islander alone

-
- 9,66173.5%White alone
- 2,33917.8%Hispanic
- 6134.7%Black alone
- 4793.6%Two or more races
- 630.5%Asian alone
- 480.4%Other race alone
- 60.05%American Indian alone
2000
2022
-
- 10,458,50965.4%White alone
- 2,682,71516.8%Hispanic
- 2,264,26814.2%Black alone
- 261,6931.6%Asian alone
- 236,9541.5%Two or more races
- 42,3580.3%American Indian alone
- 28,9940.2%Other race alone
- 6,8870.04%Native Hawaiian and Other
Pacific Islander alone

-
- 11,309,40350.8%White alone
- 6,025,03927.1%Hispanic
- 3,241,01514.6%Black alone
- 861,6303.9%Two or more races
- 623,6922.8%Asian alone
- 152,0540.7%Other race alone
- 22,5040.1%American Indian alone
- 9,4860.04%Native Hawaiian and Other
Pacific Islander alone

Income and house value in Sarasota Springs
- Median household income in 2022
- $88,600White non-Hispanic householders
- $72,532Black householders
- $133,198Two or more races householders
- $92,900Hispanic or Latino race householders
- Median 2022 house value
- $339,094White Non-Hispanic householders
- $285,773Black or African American householders
- $331,079Asian householders
- $457,586Some other race householders
- $323,760Two or more races householders
- $323,063Hispanic or Latino householders
Household income for White non-Hispanic householders

Household income for Black householders

Household income for American Indian and Alaska Native householders

Household income for Asian householders

Household income for Some other race householders

Household income for Two or more races householders

Household income for Hispanic or Latino race householders

Median age by race in Sarasota Springs
- 42.4Median age for White residents
- 38.9Males
- 46.5Females
- 19.3Median age for Black or African American residents
- 30.2Males
- 16.3Females
- 113.3Median age for American Indian / Alaska Native residents
- -856,941,507.2Males
- -594,925,633.7Females
- 46.5Median age for Asian residents
- 12.8Males
- 46.5Females
- -679,849,340.2Median age for Native Hawaiian / Pacific Islander residents
- -858,307,848.3Males
- -443,298,968.6Females
- 32.5Median age for Other race residents
- 14.5Males
- 42.2Females
- 41.2Median age for Two or more races residents
- 50.6Males
- 34.7Females
- 45.0Median age for White alone residents
- 39.2Males
- 48.6Females
- 33.3Median age for Hispanic or Latino residents
- 33.1Males
- 35.1Females
Owner/renter occupied households by race in Sarasota Springs
- House owners and renters - White residents
- 3,48479.8%Owner occupied
- 87920.2%Renter occupied
- House owners and renters - Black or African American residents
- 7160.0%Owner occupied
- 4740.0%Renter occupied
- House owners and renters - American Indian / Alaska Native residents
- 10100.0%Owner occupied
- House owners and renters - Asian residents
- 39100.0%Owner occupied
- House owners and renters - Other race residents
- 5757.3%Owner occupied
- 4242.7%Renter occupied
- House owners and renters - Two or more races residents
- 29570.5%Owner occupied
- 12429.5%Renter occupied
- House owners and renters - White alone residents
- 3,30279.4%Owner occupied
- 85920.6%Renter occupied
- House owners and renters - Hispanic or Latino residents
- 44276.4%Owner occupied
- 13623.6%Renter occupied
Language usage in Sarasota Springs
- English speakers - Total
- 82.0% of residents of Sarasota Springs speak English at home.
- 13.2% of residents speak Spanish at home
- 69941.5%Speak English very well
- 98758.5%Speak English less than very well
- 4.5% of residents speak other language at home
- 44577.1%Speak English very well
- 13222.9%Speak English less than very well
- English speakers - Born in the United States
- 93.4% of residents of Sarasota Springs speak English at home.
- 2.3% of residents speak Spanish at home
- 11883.1%Speak English very well
- 2416.9%Speak English less than very well
- 4.4% of residents speak other language at home
- 273100.0%Speak English very well
- English speakers - Native, born elsewhere
- 59.3% of residents of Sarasota Springs speak English at home.
- 39.8% of residents speak Spanish at home
- 6873.9%Speak English very well
- 2426.1%Speak English less than very well
- 2.6% of residents speak other language at home
- 6100.0%Speak English less than very well
- English speakers - Foreign-born
- 12.6% of residents of Sarasota Springs speak English at home.
- 73.1% of residents speak Spanish at home
- 44031.8%Speak English very well
- 94368.2%Speak English less than very well
- 13.0% of residents speak other language at home
- 12149.0%Speak English very well
- 12651.0%Speak English less than very well
White (Caucasian) - Speak only English
| Native: | 96.4% (8,969) |
| Foreign-born: | 18.2% (173) |
White (Caucasian) - Speak another language
| Native: | 3.6% (331) |
| Foreign-born: | 82.5% (781) |
Black or African American - Speak only English
| Native: | 89.9% (528) |
| Foreign-born: | 100.0% (30) |
Other race - Speak only English
| Native: | 47.4% (103) |
| Foreign-born: | 19.6% (51) |
Other race - Speak another language
| Native: | 51.3% (111) |
| Foreign-born: | 79.4% (205) |
Two or more races - Speak another language
| Native: | 25.5% (186) |
| Foreign-born: | 100.0% (821) |
White alone - Speak only English
| Native: | 97.5% (8,744) |
| Foreign-born: | 39.7% (136) |
White alone - Speak another language
| Native: | 2.5% (222) |
| Foreign-born: | 61.0% (210) |
Hispanic or Latino - Speak only English
| Native: | 66.1% (551) |
| Foreign-born: | 3.5% (49) |
Hispanic or Latino - Speak another language
| Native: | 35.4% (295) |
| Foreign-born: | 99.3% (1,372) |
Foreign-born residents in Sarasota Springs
1,664 residents are foreign born (10.3% Latin America, 2.0% Europe).
| This city: | 12.7% |
| Florida: | 21.1% |


Marital status for residents in Sarasota Springs
Marital status - White (Caucasian) population 15 years and over
- Males
- 37.3%Never married
- 49.7%Now married
- 0.0%Separated
- 0.5%Widowed
- 12.5%Divorced
- Females
- 27.3%Never married
- 42.3%Now married
- 0.6%Separated
- 6.7%Widowed
- 23.1%Divorced
Women who gave birth in the past 12 months
| Now married: | 100.0% (45) |
| Unmarried: | 0.0% (0) |
Women who did not give birth in the past 12 months
| Now married: | 30.5% (694) |
| Unmarried: | 69.5% (1,582) |
Marital status - Black or African American population 15 years and over
- Males
- 58.1%Never married
- 30.9%Now married
- 0.0%Separated
- 0.0%Widowed
- 11.0%Divorced
- Females
- 65.6%Never married
- 34.4%Now married
- 0.0%Separated
- 0.0%Widowed
- 0.0%Divorced
Women who did not give birth in the past 12 months
| Now married: | 34.4% (55) |
| Unmarried: | 65.6% (105) |
Marital status - American Indian / Alaska Native population 15 years and over
- Males
- 0.0%Never married
- 100.0%Now married
- 0.0%Separated
- 0.0%Widowed
- 0.0%Divorced
- Females
- 0.0%Never married
- 0.0%Now married
- 0.0%Separated
- 0.0%Widowed
- 100.0%Divorced
Marital status - Asian population 15 years and over
- Males
- 0.0%Never married
- 0.0%Now married
- 0.0%Separated
- 0.0%Widowed
- 100.0%Divorced
- Females
- 0.0%Never married
- 60.7%Now married
- 0.0%Separated
- 0.0%Widowed
- 39.3%Divorced
Women who did not give birth in the past 12 months
| Now married: | 50.0% (11) |
| Unmarried: | 50.0% (11) |
Marital status - Other race population 15 years and over
- Males
- 23.0%Never married
- 77.0%Now married
- 0.0%Separated
- 0.0%Widowed
- 0.0%Divorced
- Females
- 25.0%Never married
- 56.0%Now married
- 0.0%Separated
- 6.5%Widowed
- 12.5%Divorced
Women who gave birth in the past 12 months
| Now married: | 100.0% (16) |
| Unmarried: | 0.0% (0) |
Women who did not give birth in the past 12 months
| Now married: | 50.0% (66) |
| Unmarried: | 50.0% (66) |
Marital status - Two or more races population 15 years and over
- Males
- 28.1%Never married
- 65.4%Now married
- 0.0%Separated
- 0.0%Widowed
- 6.4%Divorced
- Females
- 38.0%Never married
- 53.2%Now married
- 0.0%Separated
- 5.3%Widowed
- 3.5%Divorced
Women who did not give birth in the past 12 months
| Now married: | 30.3% (123) |
| Unmarried: | 69.7% (283) |
Marital status - White alone, not Hispanic / Latino population 15 years and over
- Males
- 35.3%Never married
- 50.1%Now married
- 0.0%Separated
- 0.5%Widowed
- 14.1%Divorced
- Females
- 24.3%Never married
- 42.2%Now married
- 0.7%Separated
- 7.4%Widowed
- 25.4%Divorced
Women who gave birth in the past 12 months
| Now married: | 100.0% (47) |
| Unmarried: | 0.0% (0) |
Women who did not give birth in the past 12 months
| Now married: | 29.5% (598) |
| Unmarried: | 70.5% (1,429) |
Marital status - Hispanic or Latino population 15 years and over
- Males
- 44.8%Never married
- 54.7%Now married
- 0.0%Separated
- 0.0%Widowed
- 0.5%Divorced
- Females
- 41.1%Never married
- 50.3%Now married
- 0.0%Separated
- 3.5%Widowed
- 5.1%Divorced
Women who gave birth in the past 12 months
| Now married: | 100.0% (12) |
| Unmarried: | 0.0% (0) |
Women who did not give birth in the past 12 months
| Now married: | 37.1% (221) |
| Unmarried: | 62.9% (376) |
Ancestries in Sarasota Springs

- 1,88727.1%American
- 5688.2%German
- 5077.3%Irish
- 4516.5%Italian
- 3775.4%English
- 1482.1%Norwegian
- 1151.7%Swedish
- 1121.6%Polish
- 1091.6%Scottish
- 941.4%French
- 831.2%Dutch
- 630.9%Scotch-Irish
- 590.8%Russian
- 450.6%British
- 380.5%European
- 340.5%Turkish
- 330.5%Ukrainian
- 310.4%Welsh
- 270.4%Brazilian
- 210.3%Lebanese
- 190.3%Swiss
- 180.3%Eastern European
- 160.2%Czech
- 160.2%Slovak
- 160.2%Yugoslavian
- 120.2%Croatian
- 110.2%Northern European
- 110.2%Scandinavian
- 90.1%Canadian
- 80.1%Hungarian
- 50.07%Danish
- 50.07%French Canadian
- 40.06%Austrian
- 40.06%Portuguese
- 40.06%Slovene

Geographical mobility in Sarasota Springs

- Same house 1 year ago
- 9,31188.3%White (Caucasian)
- 52585.0%Black or African American
- 28100.0%American Indian / Alaska Native
- 5282.7%Asian
- 42879.8%Other race
- 1,661100.0%Two or more races
- 8,68290.2%White alone, not Hispanic / Latino
- 1,97984.3%Hispanic or Latino

-
- Moved within same county
- 6876.5%White / Caucasian
- 1015.4%Asian
- 203.7%Other race
- 4734.9%White alone, not Hispanic / Latino
- 1948.3%Hispanic or Latino

-
- Moved within same state
- 1931.8%White / Caucasian
- 7512.2%Black or African American
- 356.5%Other race
- 201.3%Two or more races
- 1932.0%White alone, not Hispanic / Latino
- 632.7%Hispanic or Latino

-
- Moved from different state
- 2001.9%White / Caucasian
- 346.4%Other race
- 40.3%Two or more races
- 2002.1%White alone, not Hispanic / Latino
- 261.1%Hispanic or Latino

Children Nativity (place of birth) in Sarasota Springs
Place of birth for residents in Sarasota Springs
![Place of birth for the foreign-born population - Regions]()
- 1,392Americas
- 1,351Latin America
- 635Caribbean
- 451Central America
- 268Europe
- 264South America
- 122Eastern Europe
- 71Western Europe
- 55Northern Europe
- 41Northern America
- 18Southern Europe
- 4Africa
- 4Southern Africa

![Place of birth for the foreign-born population - Countries]()
- 580Cuba
- 414Mexico
- 129Venezuela
- 66Colombia
- 54Netherlands
- 45Russia
- 41Dominican Republic
- 41Canada
- 40Peru
- 32Bosnia and Herzegovina
- 28Brazil
- 27Ukraine
- 25England
- 18Italy
- 16Austria
- 15Scotland
- 14Ireland
- 14Guatemala
- 13Barbados
- 13Nicaragua
- 9Hungary
- 8Belize
- 7Poland
- 4South Africa

Grandparents responsible for own grandchildren in Sarasota Springs
Zip codes: 34232.