Races in Scottsboro, Alabama (AL) Detailed Stats
Data:
Races - White alone (%)
Races - White alone (% change since 2000)
Races - Black alone (%)
Races - Black alone (% change since 2000)
Races - American Indian alone (%)
Races - American Indian alone (% change since 2000)
Races - Asian alone (%)
Races - Asian alone (% change since 2000)
Races - Hispanic (%)
Races - Hispanic (% change since 2000)
Races - Native Hawaiian and Other Pacific Islander alone (%)
Races - Native Hawaiian and Other Pacific Islander alone (% change since 2000)
Races - Two or more races(%)
Races - Two or more races(% change since 2000)
Races - Other race alone (%)
Races - Other race alone (% change since 2000)
Racial diversity
Place of birth - Born in state of residence (%)
Place of birth - Born in state of residence (%) - White
Place of birth - Born in state of residence (%) - Black or African American
Place of birth - Born in state of residence (%) - Asian
Place of birth - Born in state of residence (%) - Hispanic or Latino
Place of birth - Born in state of residence (%) - American Indian and Alaska Native
Place of birth - Born in state of residence (%) - Multirace
Place of birth - Born in state of residence (%) - Other Race
Place of birth - Born in other state (%)
Place of birth - Born in other state (%) - White
Place of birth - Born in other state (%) - Black or African American
Place of birth - Born in other state (%) - Asian
Place of birth - Born in other state (%) - Hispanic or Latino
Place of birth - Born in other state (%) - American Indian and Alaska Native
Place of birth - Born in other state (%) - Multirace
Place of birth - Born in other state (%) - Other Race
Place of birth - Native, outside of US (%)
Place of birth - Native, outside of US (%) - White
Place of birth - Native, outside of US (%) - Black or African American
Place of birth - Native, outside of US (%) - Asian
Place of birth - Native, outside of US (%) - Hispanic or Latino
Place of birth - Native, outside of US (%) - American Indian and Alaska Native
Place of birth - Native, outside of US (%) - Multirace
Place of birth - Native, outside of US (%) - Other Race
Place of birth - Foreign born (%)
Place of birth - Foreign born (%) - White
Place of birth - Foreign born (%) - Black or African American
Place of birth - Foreign born (%) - Asian
Place of birth - Foreign born (%) - Hispanic or Latino
Place of birth - Foreign born (%) - American Indian and Alaska Native
Place of birth - Foreign born (%) - Multirace
Place of birth - Foreign born (%) - Other Race
Residents speaking English at home (%)
Residents speaking English at home - Born in the United States (%)
Residents speaking English at home - Native, born elsewhere (%)
Residents speaking English at home - Foreign born (%)
Residents speaking Spanish at home (%)
Residents speaking Spanish at home - Born in the United States (%)
Residents speaking Spanish at home - Native, born elsewhere (%)
Residents speaking Spanish at home - Foreign born (%)
Residents speaking other language at home (%)
Residents speaking other language at home - Born in the United States (%)
Residents speaking other language at home - Native, born elsewhere (%)
Residents speaking other language at home - Foreign born (%)
Marital status - Never married (%)
Marital status - Now married (%)
Marital status - Separated (%)
Marital status - Widowed (%)
Marital status - Divorced (%)
Ancestries Reported - Arab (%)
Ancestries Reported - Czech (%)
Ancestries Reported - Danish (%)
Ancestries Reported - Dutch (%)
Ancestries Reported - English (%)
Ancestries Reported - French (%)
Ancestries Reported - French Canadian (%)
Ancestries Reported - German (%)
Ancestries Reported - Greek (%)
Ancestries Reported - Hungarian (%)
Ancestries Reported - Irish (%)
Ancestries Reported - Italian (%)
Ancestries Reported - Lithuanian (%)
Ancestries Reported - Norwegian (%)
Ancestries Reported - Polish (%)
Ancestries Reported - Portuguese (%)
Ancestries Reported - Russian (%)
Ancestries Reported - Scotch-Irish (%)
Ancestries Reported - Scottish (%)
Ancestries Reported - Slovak (%)
Ancestries Reported - Subsaharan African (%)
Ancestries Reported - Swedish (%)
Ancestries Reported - Swiss (%)
Ancestries Reported - Ukrainian (%)
Ancestries Reported - United States (%)
Ancestries Reported - Welsh (%)
Ancestries Reported - West Indian (%)
Ancestries Reported - Other (%)
Geographical mobility - Same house 1 year ago (%)
Geographical mobility - Same house 1 year ago (%) - White
Geographical mobility - Same house 1 year ago (%) - Black or African American
Geographical mobility - Same house 1 year ago (%) - Asian
Geographical mobility - Same house 1 year ago (%) - Hispanic or Latino
Geographical mobility - Same house 1 year ago (%) - American Indian and Alaska Native
Geographical mobility - Same house 1 year ago (%) - Multirace
Geographical mobility - Same house 1 year ago (%) - Other Race
Geographical mobility - Moved within same county (%)
Geographical mobility - Moved within same county (%) - White
Geographical mobility - Moved within same county (%) - Black or African American
Geographical mobility - Moved within same county (%) - Asian
Geographical mobility - Moved within same county (%) - Hispanic or Latino
Geographical mobility - Moved within same county (%) - American Indian and Alaska Native
Geographical mobility - Moved within same county (%) - Multirace
Geographical mobility - Moved within same county (%) - Other Race
Geographical mobility - Moved from different county within same state (%)
Geographical mobility - Moved from different county within same state (%) - White
Geographical mobility - Moved from different county within same state (%) - Black or African American
Geographical mobility - Moved from different county within same state (%) - Asian
Geographical mobility - Moved from different county within same state (%) - Hispanic or Latino
Geographical mobility - Moved from different county within same state (%) - American Indian and Alaska Native
Geographical mobility - Moved from different county within same state (%) - Multirace
Geographical mobility - Moved from different county within same state (%) - Other Race
Geographical mobility - Moved from different state (%)
Geographical mobility - Moved from different state (%) - White
Geographical mobility - Moved from different state (%) - Black or African American
Geographical mobility - Moved from different state (%) - Asian
Geographical mobility - Moved from different state (%) - Hispanic or Latino
Geographical mobility - Moved from different state (%) - American Indian and Alaska Native
Geographical mobility - Moved from different state (%) - Multirace
Geographical mobility - Moved from different state (%) - Other Race
Geographical mobility - Moved from abroad (%)
Geographical mobility - Moved from abroad (%) - White
Geographical mobility - Moved from abroad (%) - Black or African American
Geographical mobility - Moved from abroad (%) - Asian
Geographical mobility - Moved from abroad (%) - Hispanic or Latino
Geographical mobility - Moved from abroad (%) - American Indian and Alaska Native
Geographical mobility - Moved from abroad (%) - Multirace
Geographical mobility - Moved from abroad (%) - Other Race
Place of birth for the foreign-born population - Ireland (%)
Place of birth for the foreign-born population - Denmark (%)
Place of birth for the foreign-born population - Norway (%)
Place of birth for the foreign-born population - Sweden (%)
Place of birth for the foreign-born population - United Kingdom (%)
Place of birth for the foreign-born population - England (%)
Place of birth for the foreign-born population - Scotland (%)
Place of birth for the foreign-born population - Other Northern Europe (%)
Place of birth for the foreign-born population - Austria (%)
Place of birth for the foreign-born population - Belgium (%)
Place of birth for the foreign-born population - France (%)
Place of birth for the foreign-born population - Germany (%)
Place of birth for the foreign-born population - Netherlands (%)
Place of birth for the foreign-born population - Switzerland (%)
Place of birth for the foreign-born population - Other Western Europe (%)
Place of birth for the foreign-born population - Greece (%)
Place of birth for the foreign-born population - Italy (%)
Place of birth for the foreign-born population - Portugal (%)
Place of birth for the foreign-born population - Spain (%)
Place of birth for the foreign-born population - Other Southern Europe (%)
Place of birth for the foreign-born population - Albania (%)
Place of birth for the foreign-born population - Belarus (%)
Place of birth for the foreign-born population - Bosnia and Herzegovina (%)
Place of birth for the foreign-born population - Bulgaria (%)
Place of birth for the foreign-born population - Croatia (%)
Place of birth for the foreign-born population - Czechoslovakia (%)
Place of birth for the foreign-born population - Hungary (%)
Place of birth for the foreign-born population - Latvia (%)
Place of birth for the foreign-born population - Lithuania (%)
Place of birth for the foreign-born population - North Macedonia (Macedonia) (%)
Place of birth for the foreign-born population - Moldova (%)
Place of birth for the foreign-born population - Poland (%)
Place of birth for the foreign-born population - Romania (%)
Place of birth for the foreign-born population - Russia (%)
Place of birth for the foreign-born population - Serbia (%)
Place of birth for the foreign-born population - Ukraine (%)
Place of birth for the foreign-born population - Other Eastern Europe (%)
Place of birth for the foreign-born population - China (%)
Place of birth for the foreign-born population - Hong Kong (%)
Place of birth for the foreign-born population - Taiwan (%)
Place of birth for the foreign-born population - Japan (%)
Place of birth for the foreign-born population - Korea (%)
Place of birth for the foreign-born population - Other Eastern Asia (%)
Place of birth for the foreign-born population - Afghanistan (%)
Place of birth for the foreign-born population - Bangladesh (%)
Place of birth for the foreign-born population - India (%)
Place of birth for the foreign-born population - Iran (%)
Place of birth for the foreign-born population - Kazakhstan (%)
Place of birth for the foreign-born population - Nepal (%)
Place of birth for the foreign-born population - Pakistan (%)
Place of birth for the foreign-born population - Sri Lanka (%)
Place of birth for the foreign-born population - Uzbekistan (%)
Place of birth for the foreign-born population - Other South Central Asia (%)
Place of birth for the foreign-born population - Burma (%)
Place of birth for the foreign-born population - Cambodia (%)
Place of birth for the foreign-born population - Indonesia (%)
Place of birth for the foreign-born population - Laos (%)
Place of birth for the foreign-born population - Malaysia (%)
Place of birth for the foreign-born population - Philippines (%)
Place of birth for the foreign-born population - Singapore (%)
Place of birth for the foreign-born population - Thailand (%)
Place of birth for the foreign-born population - Vietnam (%)
Place of birth for the foreign-born population - Other South Eastern Asia (%)
Place of birth for the foreign-born population - Armenia (%)
Place of birth for the foreign-born population - Iraq (%)
Place of birth for the foreign-born population - Israel (%)
Place of birth for the foreign-born population - Jordan (%)
Place of birth for the foreign-born population - Kuwait (%)
Place of birth for the foreign-born population - Lebanon (%)
Place of birth for the foreign-born population - Saudi Arabia (%)
Place of birth for the foreign-born population - Syria (%)
Place of birth for the foreign-born population - Turkey (%)
Place of birth for the foreign-born population - Yemen (%)
Place of birth for the foreign-born population - Other Western Asia (%)
Place of birth for the foreign-born population - Eritrea (%)
Place of birth for the foreign-born population - Ethiopia (%)
Place of birth for the foreign-born population - Kenya (%)
Place of birth for the foreign-born population - Somalia (%)
Place of birth for the foreign-born population - Uganda (%)
Place of birth for the foreign-born population - Zimbabwe (%)
Place of birth for the foreign-born population - Other Eastern Africa (%)
Place of birth for the foreign-born population - Cameroon (%)
Place of birth for the foreign-born population - Congo (%)
Place of birth for the foreign-born population - Democratic Republic of Congo (Zaire) (%)
Place of birth for the foreign-born population - Other Middle Africa (%)
Place of birth for the foreign-born population - Egypt (%)
Place of birth for the foreign-born population - Morocco (%)
Place of birth for the foreign-born population - Sudan (%)
Place of birth for the foreign-born population - Other Northern Africa (%)
Place of birth for the foreign-born population - South Africa (%)
Place of birth for the foreign-born population - Other Southern Africa (%)
Place of birth for the foreign-born population - Cabo Verde (%)
Place of birth for the foreign-born population - Ghana (%)
Place of birth for the foreign-born population - Liberia (%)
Place of birth for the foreign-born population - Nigeria (%)
Place of birth for the foreign-born population - Senegal (%)
Place of birth for the foreign-born population - Sierra Leone (%)
Place of birth for the foreign-born population - Other Western Africa (%)
Place of birth for the foreign-born population - Australia (%)
Place of birth for the foreign-born population - New Zealand (%)
Place of birth for the foreign-born population - Fiji (%)
Place of birth for the foreign-born population - Micronesia (%)
Place of birth for the foreign-born population - Bahamas (%)
Place of birth for the foreign-born population - Barbados (%)
Place of birth for the foreign-born population - Cuba (%)
Place of birth for the foreign-born population - Dominica (%)
Place of birth for the foreign-born population - Dominican Republic (%)
Place of birth for the foreign-born population - Grenada (%)
Place of birth for the foreign-born population - Haiti (%)
Place of birth for the foreign-born population - Jamaica (%)
Place of birth for the foreign-born population - St. Vincent and the Grenadines (%)
Place of birth for the foreign-born population - Trinidad and Tobago (%)
Place of birth for the foreign-born population - West Indies (%)
Place of birth for the foreign-born population - Other Caribbean (%)
Place of birth for the foreign-born population - Belize (%)
Place of birth for the foreign-born population - Costa Rica (%)
Place of birth for the foreign-born population - El Salvador (%)
Place of birth for the foreign-born population - Guatemala (%)
Place of birth for the foreign-born population - Honduras (%)
Place of birth for the foreign-born population - Mexico (%)
Place of birth for the foreign-born population - Nicaragua (%)
Place of birth for the foreign-born population - Panama (%)
Place of birth for the foreign-born population - Other Central America (%)
Place of birth for the foreign-born population - Argentina (%)
Place of birth for the foreign-born population - Bolivia (%)
Place of birth for the foreign-born population - Brazil (%)
Place of birth for the foreign-born population - Chile (%)
Place of birth for the foreign-born population - Colombia (%)
Place of birth for the foreign-born population - Ecuador (%)
Place of birth for the foreign-born population - Guyana (%)
Place of birth for the foreign-born population - Peru (%)
Place of birth for the foreign-born population - Uruguay (%)
Place of birth for the foreign-born population - Venezuela (%)
Place of birth for the foreign-born population - Other South America (%)
Place of birth for the foreign-born population - Canada (%)
Place of birth for the foreign-born population - Other Northern America (%)
Place of birth for the foreign-born population - Other (%)
Latest news about races in Scottsboro, AL collected exclusively by city-data.com from local newspapers, TV, and radio stations
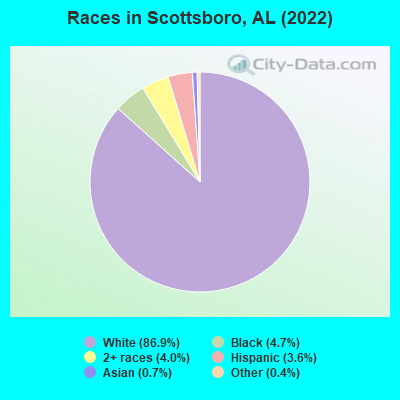
According to 2022 data, the most numerous races in Scottsboro, AL are White alone (13,044 residents), Black alone (893 residents), and Hispanic (425 residents). 98.4% of Scottsboro residents speak English at home. 1.6% of Scottsboro, AL residents are foreign-born , which is 87.5% less than the foreign-born rate of 3.0% across the entire state of Alabama.
Race distribution in Scottsboro
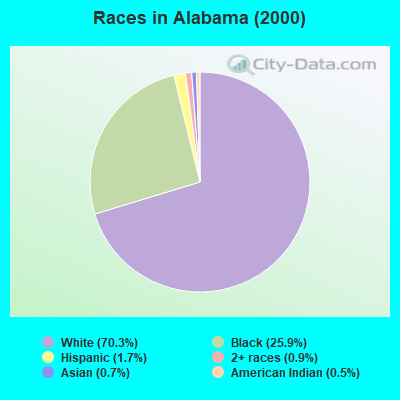
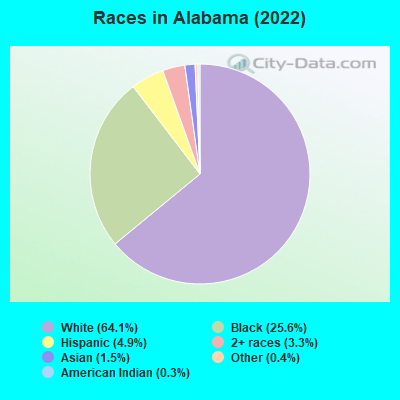
2000 2022
3,125,819 70.3% White alone 1,150,076 25.9% Black alone 75,830 1.7% Hispanic 39,086 0.9% Two or more races 30,989 0.7% Asian alone 21,618 0.5% American Indian alone 2,623 0.06% Other race alone 1,059 0.02% Native Hawaiian and Other
3,250,182 64.1% White alone 1,296,500 25.6% Black alone 246,477 4.9% Hispanic 169,880 3.3% Two or more races 76,682 1.5% Asian alone 19,927 0.4% Other race alone 12,694 0.3% American Indian alone 1,954 0.04% Native Hawaiian and Other
Income and house value in Scottsboro Median household income in 2022 $54,019 White non-Hispanic householders$38,272 Black householders$100,436 American Indian and Alaska Native householders$27,713 Asian householders$28,064 Some other race householders$104,111 Two or more races householders$37,077 Hispanic or Latino race householdersMedian 2022 house value $213,734 White Non-Hispanic householders$126,250 Black or African American householders$172,349 American Indian or Alaska Native householders $85,127 Asian householders$150,085 Two or more races householders$248,833 Hispanic or Latino householders
Median age by race in Scottsboro
45.1 Median age for White residents42.3 47.4 34.7 Median age for Black or African American residents34.8 51.5 26.6 Median age for American Indian / Alaska Native residents21.5 Median age for Asian residents37.5 22.1 39.0 Median age for Other race residents30.5 Median age for Two or more races residents3.8 65.6 45.5 Median age for White alone residents42.4 48.6 28.5 Median age for Hispanic or Latino residents28.3 28.5
Owner/renter occupied households by race in Scottsboro
House owners and renters - White residents 3,991 71.7% Owner occupied1,579 28.3% Renter occupiedHouse owners and renters - Black or African American residents 193 56.7% Owner occupied148 43.3% Renter occupiedHouse owners and renters - American Indian / Alaska Native residents 35 100.0% Renter occupiedHouse owners and renters - Asian residents 25 100.0% Owner occupiedHouse owners and renters - Two or more races residents 197 84.8% Owner occupied35 15.2% Renter occupiedHouse owners and renters - White alone residents 3,918 71.0% Owner occupied1,601 29.0% Renter occupiedHouse owners and renters - Hispanic or Latino residents 121 100.0% Owner occupied
Language usage in Scottsboro
English speakers - Total 98.4% of residents of Scottsboro speak English at home.
1.1% of residents speak Spanish at home 43 28.3% Speak English very well109 71.7% Speak English less than very well0.5% of residents speak other language at home 21 30.0% Speak English very well49 70.0% Speak English less than very well
English speakers - Born in the United States 98.9% of residents of Scottsboro speak English at home.
1.0% of residents speak other language at home 20 44.4% Speak English very well25 55.6% Speak English less than very well
All residents speak only English at home
English speakers - Foreign-born 36.5% of residents of Scottsboro speak English at home.
53.8% of residents speak Spanish at home 33 24.6% Speak English very well101 75.4% Speak English less than very well8.0% of residents speak other language at home 20 100.0% Speak English less than very well
White (Caucasian) - Speak only English Native:
100.0% (12,482)Foreign-born:
42.7% (44)
White (Caucasian) - Speak another language Native:
0.2% (23)Foreign-born:
59.5% (61)
Asian - Speak only English Native:
74.7% (62)Foreign-born:
66.1% (42)
Asian - Speak another language Native:
30.0% (25)Foreign-born:
33.9% (21)
White alone - Speak only English Native:
99.8% (12,422)Foreign-born:
95.5% (30)
Hispanic or Latino - Speak only English Native:
100.0% (187)Foreign-born:
8.6% (14)
Foreign-born residents in Scottsboro 241 residents are foreign born
This city:
1.6%Alabama:
100.0%
Marital status for residents in Scottsboro Marital status - White (Caucasian) population 15 years and over
Males 26.8% Never married55.2% Now married0.6% Separated2.9% Widowed14.5% DivorcedFemales 17.1% Never married48.6% Now married4.9% Separated15.2% Widowed14.3% DivorcedWomen who gave birth in the past 12 months Now married:
77.4% (95)Unmarried:
22.6% (28)
Women who did not give birth in the past 12 months Now married:
59.4% (1,470)Unmarried:
40.6% (1,003)
Marital status - Black or African American population 15 years and over
Males 64.0% Never married17.6% Now married0.0% Separated0.0% Widowed18.4% DivorcedFemales 36.8% Never married15.5% Now married11.5% Separated34.1% Widowed2.0% DivorcedWomen who did not give birth in the past 12 months Now married:
14.0% (17)Unmarried:
86.0% (105)
Marital status - American Indian / Alaska Native population 15 years and over
Males 65.9% Never married0.0% Now married34.1% Separated0.0% Widowed0.0% DivorcedFemales 0.0% Never married100.0% Now married0.0% Separated0.0% Widowed0.0% DivorcedWomen who gave birth in the past 12 months Now married:
100.0% (23)Unmarried:
0.0% (0)
Marital status - Asian population 15 years and over
Males 0.0% Never married50.0% Now married0.0% Separated0.0% Widowed50.0% DivorcedFemales 72.4% Never married17.2% Now married0.0% Separated0.0% Widowed10.3% DivorcedWomen who did not give birth in the past 12 months Now married:
19.2% (16)Unmarried:
80.8% (66)
Marital status - Other race population 15 years and over
Males 19.0% Never married81.0% Now married0.0% Separated0.0% Widowed0.0% DivorcedFemales 15.4% Never married84.6% Now married0.0% Separated0.0% Widowed0.0% DivorcedWomen who did not give birth in the past 12 months Now married:
84.6% (44)Unmarried:
15.4% (8)
Marital status - Two or more races population 15 years and over
Males 0.0% Never married78.4% Now married0.0% Separated0.0% Widowed21.6% DivorcedFemales 37.1% Never married34.5% Now married0.0% Separated28.4% Widowed0.0% DivorcedWomen who did not give birth in the past 12 months Now married:
0.0% (0)Unmarried:
100.0% (92)
Marital status - White alone, not Hispanic / Latino population 15 years and over
Males 27.0% Never married55.0% Now married0.6% Separated2.7% Widowed14.7% DivorcedFemales 17.4% Never married48.2% Now married5.0% Separated15.0% Widowed14.5% DivorcedWomen who gave birth in the past 12 months Now married:
77.4% (96)Unmarried:
22.6% (28)
Women who did not give birth in the past 12 months Now married:
58.3% (1,413)Unmarried:
41.7% (1,011)
Marital status - Hispanic or Latino population 15 years and over
Males 23.9% Never married64.1% Now married0.0% Separated12.0% Widowed0.0% DivorcedFemales 0.0% Never married84.7% Now married0.0% Separated15.3% Widowed0.0% DivorcedWomen who did not give birth in the past 12 months Now married:
100.0% (126)Unmarried:
0.0% (0)
Ancestries in Scottsboro
2,476 28.3% American804 9.2% English402 4.6% Irish279 3.2% German195 2.2% African170 1.9% Scottish117 1.3% Eastern European66 0.8% British64 0.7% Scotch-Irish57 0.7% French54 0.6% European27 0.3% Italian26 0.3% Norwegian22 0.3% Swedish21 0.2% Slovak15 0.2% Pennsylvania German14 0.2% Hungarian14 0.2% Northern European11 0.1% Russian9 0.1% Austrian9 0.1% Danish9 0.1% Greek8 0.09% Welsh4 0.05% Dutch
Children Nativity (place of birth) in Scottsboro
Children under 6 years - Living with two parents Both parents native 481 100.0% NativeChildren under 6 years - Living with one parent Native parent 356 100.0% NativeChildren 6 to 17 years - Living with two parents Both parents native 1,327 99.1% Native13 0.9% Foreign-bornBoth parents foreign-born 20 100.0% NativeOne native, one foreign-born parent 14 100.0% NativeChildren 6 to 17 years - Living with one parent Native parent 474 94.2% Native29 5.8% Foreign-born
Grandparents responsible for own grandchildren in Scottsboro
Grandparents (30 to 59 years) White / Caucasian 114 82.3% Responsible for grandchildren25 17.7% Not responsible for grandchildrenWhite alone, not Hispanic / Latino 110 80.9% Responsible for grandchildren26 19.1% Not responsible for grandchildrenGrandparents (60 years and over) White / Caucasian 140 66.9% Responsible for grandchildren69 33.1% Not responsible for grandchildrenWhite alone, not Hispanic / Latino 142 66.1% Responsible for grandchildren73 33.9% Not responsible for grandchildren