Races in Seneca, South Carolina (SC) Detailed Stats
Ancestries, Foreign-born residents, place of birth
Settings
X


Recent posts about races in Seneca, South Carolina on our local forum with over 2,400,000 registered users:
 | Anderson, South Carolina Retail (155 replies) |
| The housing market is in this area is insane right now (52 replies) |
| adult programs/services for autism in south carolina (14 replies) |
| Moving to SC (45 replies) |
| Seraching for small town in SC to retire (26 replies) |
| Relo to Greenville (16 replies) |
Latest news about races in Seneca, SC collected exclusively by city-data.com from local newspapers, TV, and radio stations
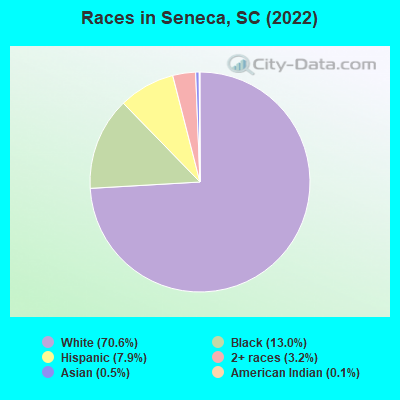
According to 2022 data, the most numerous races in Seneca, SC are White alone (6,345 residents), Black alone (1,166 residents), and Hispanic (714 residents). 97.0% of Seneca residents speak English at home. 2.4% of Seneca, SC residents are foreign-born (1.3% born in Latin America, 0.6% born in Europe, 0.5% born in Asia), which is 109.1% less than the foreign-born rate of 5.0% across the entire state of South Carolina.
Race distribution in Seneca
2000
2022

- 4,78462.5%White alone
- 2,58133.7%Black alone
- 1171.5%Hispanic
- 911.2%Two or more races
- 470.6%Asian alone
- 120.2%Other race alone
- 190.2%American Indian alone
- 10.01%Native Hawaiian and Other
Pacific Islander alone

-
- 6,34570.6%White alone
- 1,16613.0%Black alone
- 7147.9%Hispanic
- 2913.2%Two or more races
- 480.5%Asian alone
- 120.1%American Indian alone
2000
2022
-
- 2,652,29166.1%White alone
- 1,178,48629.4%Black alone
- 95,0762.4%Hispanic
- 35,5680.9%Asian alone
- 33,2900.8%Two or more races
- 12,7650.3%American Indian alone
- 3,2660.08%Other race alone
- 1,2700.03%Native Hawaiian and Other
Pacific Islander alone

-
- 3,301,73962.5%White alone
- 1,313,29024.9%Black alone
- 343,7836.5%Hispanic
- 190,5083.6%Two or more races
- 89,8881.7%Asian alone
- 29,3900.6%Other race alone
- 12,1120.2%American Indian alone
- 1,9240.04%Native Hawaiian and Other
Pacific Islander alone

Income and house value in Seneca
- Median household income in 2022
- $54,021White non-Hispanic householders
- $38,778Black householders
- $145,056Hispanic or Latino race householders
- Median 2022 house value
- $250,420White Non-Hispanic householders
- $189,528Black or African American householders
- $190,289Asian householders
- $412,293Two or more races householders
Household income for White non-Hispanic householders

Household income for Black householders

Household income for American Indian and Alaska Native householders

Household income for Asian householders

Household income for Two or more races householders

Household income for Hispanic or Latino race householders

Median age by race in Seneca
- 47.4Median age for White residents
- 42.4Males
- 54.3Females
- 52.9Median age for Black or African American residents
- 53.5Males
- 53.2Females
- 64.5Median age for American Indian / Alaska Native residents
- -583,333,332.8Males
- -805,269,185.9Females
- 64.8Median age for Asian residents
- -720,616,569.6Males
- -688,832,053.9Females
- -666,666,666.0Median age for Native Hawaiian / Pacific Islander residents
- -666,666,666.0Males
- -666,666,666.0Females
- 40.5Median age for Other race residents
- 60.2Males
- 34.5Females
- 16.9Median age for Two or more races residents
- 20.6Males
- 17.2Females
- 47.1Median age for White alone residents
- 41.7Males
- 54.2Females
- 42.6Median age for Hispanic or Latino residents
- 75.2Males
- 41.4Females
Owner/renter occupied households by race in Seneca
- House owners and renters - White residents
- 1,85254.8%Owner occupied
- 1,52945.2%Renter occupied
- House owners and renters - Black or African American residents
- 32860.0%Owner occupied
- 21940.0%Renter occupied
- House owners and renters - American Indian / Alaska Native residents
- 652.8%Owner occupied
- 547.2%Renter occupied
- House owners and renters - Asian residents
- 2077.7%Owner occupied
- 622.3%Renter occupied
- House owners and renters - Other race residents
- 40100.0%Renter occupied
- House owners and renters - Two or more races residents
- 919.2%Owner occupied
- 3980.8%Renter occupied
- House owners and renters - White alone residents
- 1,85654.5%Owner occupied
- 1,54745.5%Renter occupied
- House owners and renters - Hispanic or Latino residents
- 12.4%Owner occupied
- 5997.6%Renter occupied
Language usage in Seneca
- English speakers - Total
- 97.0% of residents of Seneca speak English at home.
- 1.8% of residents speak Spanish at home
- 6946.6%Speak English very well
- 7953.4%Speak English less than very well
- 1.0% of residents speak other language at home
- 6068.2%Speak English very well
- 2831.8%Speak English less than very well
- English speakers - Born in the United States
- 99.4% of residents of Seneca speak English at home.
- 0.2% of residents speak Spanish at home
- 6100.0%Speak English very well
- 0.4% of residents speak other language at home
- 14100.0%Speak English very well
- English speakers - Native, born elsewhere
- 9.7% of residents of Seneca speak English at home.
- 102.8% of residents speak Spanish at home
- 74100.0%Speak English very well
- English speakers - Foreign-born
- 51.2% of residents of Seneca speak English at home.
- 15.8% of residents speak Spanish at home
- 34100.0%Speak English less than very well
- 29.3% of residents speak other language at home
- 3555.6%Speak English very well
- 2844.4%Speak English less than very well
White (Caucasian) - Speak only English
| Native: | 100.0% (5,968) |
| Foreign-born: | 67.5% (37) |
White (Caucasian) - Speak another language
| Native: | 0.4% (24) |
| Foreign-born: | 39.9% (22) |
Other race - Speak only English
| Native: | 51.1% (74) |
| Foreign-born: | 72.7% (73) |
Other race - Speak another language
| Native: | 49.6% (72) |
| Foreign-born: | 37.2% (37) |
White alone - Speak only English
| Native: | 99.5% (5,978) |
| Foreign-born: | 56.8% (40) |
White alone - Speak another language
| Native: | 0.5% (29) |
| Foreign-born: | 43.7% (30) |
Hispanic or Latino - Speak only English
| Native: | 46.7% (161) |
| Foreign-born: | 92.8% (113) |
Hispanic or Latino - Speak another language
| Native: | 29.6% (102) |
| Foreign-born: | 35.4% (43) |
Foreign-born residents in Seneca
215 residents are foreign born (1.3% Latin America, 0.6% Europe, 0.5% Asia).
| This city: | 2.4% |
| South Carolina: | 5.3% |


Marital status for residents in Seneca
Marital status - White (Caucasian) population 15 years and over
- Males
- 35.8%Never married
- 42.5%Now married
- 1.0%Separated
- 3.8%Widowed
- 16.9%Divorced
- Females
- 24.0%Never married
- 37.2%Now married
- 6.2%Separated
- 16.6%Widowed
- 16.1%Divorced
Women who gave birth in the past 12 months
| Now married: | 40.0% (4) |
| Unmarried: | 60.0% (6) |
Women who did not give birth in the past 12 months
| Now married: | 39.0% (488) |
| Unmarried: | 61.0% (762) |
Marital status - Black or African American population 15 years and over
- Males
- 27.7%Never married
- 52.4%Now married
- 0.0%Separated
- 13.8%Widowed
- 6.1%Divorced
- Females
- 57.6%Never married
- 27.2%Now married
- 0.0%Separated
- 3.2%Widowed
- 12.0%Divorced
Women who did not give birth in the past 12 months
| Now married: | 8.8% (36) |
| Unmarried: | 91.2% (369) |
Marital status - American Indian / Alaska Native population 15 years and over
- Males
- 0.0%Never married
- 80.0%Now married
- 0.0%Separated
- 0.0%Widowed
- 20.0%Divorced
- Females
- 0.0%Never married
- 0.0%Now married
- 0.0%Separated
- 16.7%Widowed
- 83.3%Divorced
Marital status - Asian population 15 years and over
- Males
- 0.0%Never married
- 100.0%Now married
- 0.0%Separated
- 0.0%Widowed
- 0.0%Divorced
- Females
- 75.0%Never married
- 25.0%Now married
- 0.0%Separated
- 0.0%Widowed
- 0.0%Divorced
Women who did not give birth in the past 12 months
| Now married: | 0.0% (0) |
| Unmarried: | 100.0% (20) |
Marital status - Other race population 15 years and over
- Males
- 0.0%Never married
- 100.0%Now married
- 0.0%Separated
- 0.0%Widowed
- 0.0%Divorced
- Females
- 0.0%Never married
- 100.0%Now married
- 0.0%Separated
- 0.0%Widowed
- 0.0%Divorced
Women who gave birth in the past 12 months
| Now married: | 100.0% (83) |
| Unmarried: | 0.0% (0) |
Women who did not give birth in the past 12 months
| Now married: | 100.0% (57) |
| Unmarried: | 0.0% (0) |
Marital status - Two or more races population 15 years and over
- Males
- 100.0%Never married
- 0.0%Now married
- 0.0%Separated
- 0.0%Widowed
- 0.0%Divorced
- Females
- 84.1%Never married
- 0.0%Now married
- 6.0%Separated
- 0.0%Widowed
- 9.9%Divorced
Women who did not give birth in the past 12 months
| Now married: | 6.7% (19) |
| Unmarried: | 93.3% (263) |
Marital status - White alone, not Hispanic / Latino population 15 years and over
- Males
- 35.9%Never married
- 42.4%Now married
- 1.0%Separated
- 3.8%Widowed
- 16.9%Divorced
- Females
- 24.0%Never married
- 37.2%Now married
- 6.2%Separated
- 16.6%Widowed
- 16.1%Divorced
Women who gave birth in the past 12 months
| Now married: | 40.0% (4) |
| Unmarried: | 60.0% (6) |
Women who did not give birth in the past 12 months
| Now married: | 39.0% (488) |
| Unmarried: | 61.0% (763) |
Marital status - Hispanic or Latino population 15 years and over
- Males
- 22.0%Never married
- 72.4%Now married
- 0.0%Separated
- 5.7%Widowed
- 0.0%Divorced
- Females
- 66.4%Never married
- 33.6%Now married
- 0.0%Separated
- 0.0%Widowed
- 0.0%Divorced
Women who gave birth in the past 12 months
| Now married: | 100.0% (68) |
| Unmarried: | 0.0% (0) |
Women who did not give birth in the past 12 months
| Now married: | 18.1% (47) |
| Unmarried: | 81.9% (212) |
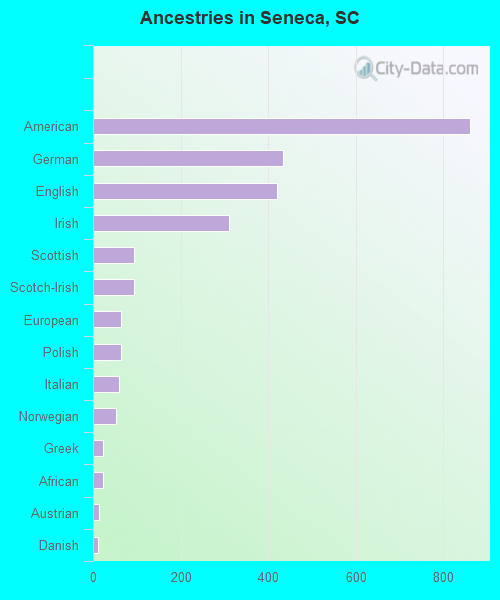
Ancestries in Seneca

- 86120.5%American
- 43410.3%German
- 42110.0%English
- 3117.4%Irish
- 942.2%Scottish
- 932.2%Scotch-Irish
- 641.5%European
- 641.5%Polish
- 601.4%Italian
- 521.2%Norwegian
- 230.5%Greek
- 220.5%African
- 140.3%Austrian
- 120.3%Danish
- 60.1%British
- 60.1%Northern European
- 10.02%Russian
Geographical mobility in Seneca

- Same house 1 year ago
- 5,29584.7%White (Caucasian)
- 1,48289.8%Black or African American
- 15100.0%American Indian / Alaska Native
- 5099.7%Asian
- 15659.0%Other race
- 21726.2%Two or more races
- 5,37885.2%White alone, not Hispanic / Latino
- 16522.7%Hispanic or Latino

-
- Moved within same county
- 4086.5%White / Caucasian
- 241.5%Black or African American
- 3814.2%Other race
- 30536.9%Two or more races
- 4096.5%White alone, not Hispanic / Latino
- 29941.0%Hispanic or Latino

-
- Moved within same state
- 370.6%White / Caucasian
- 1468.9%Black or African American
- 340.5%White alone, not Hispanic / Latino
- 10.2%Hispanic or Latino

-
- Moved from different state
- 2484.0%White / Caucasian
- 10138.1%Other race
- 26331.9%Two or more races
- 2393.8%White alone, not Hispanic / Latino
- 31543.3%Hispanic or Latino

-
- Moved from abroad
- 601.0%White
- 601.0%White alone, not Hispanic / Latino

Children Nativity (place of birth) in Seneca
Place of birth for residents in Seneca
![Place of birth for the foreign-born population - Regions]()
- 116Americas
- 116Latin America
- 78South America
- 51Europe
- 47Asia
- 30Eastern Asia
- 30China
- 27Caribbean
- 20Northern Europe
- 17Eastern Europe
- 17South Eastern Asia
- 14Western Europe
- 10Central America

![Place of birth for the foreign-born population - Countries]()
- 61Ecuador
- 30China
- 27Dominican Republic
- 17Philippines
- 17Bolivia
- 14Germany
- 11England
- 10Mexico
- 9United Kingdom
- 3Russia

Grandparents responsible for own grandchildren in Seneca
Zip codes: 29678.