Races in Shawnee, Kansas (KS) Detailed Stats
Data:
Races - White alone (%)
Races - White alone (% change since 2000)
Races - Black alone (%)
Races - Black alone (% change since 2000)
Races - American Indian alone (%)
Races - American Indian alone (% change since 2000)
Races - Asian alone (%)
Races - Asian alone (% change since 2000)
Races - Hispanic (%)
Races - Hispanic (% change since 2000)
Races - Native Hawaiian and Other Pacific Islander alone (%)
Races - Native Hawaiian and Other Pacific Islander alone (% change since 2000)
Races - Two or more races(%)
Races - Two or more races(% change since 2000)
Races - Other race alone (%)
Races - Other race alone (% change since 2000)
Racial diversity
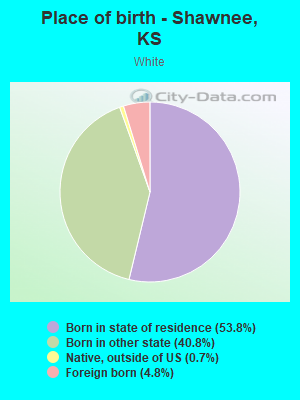
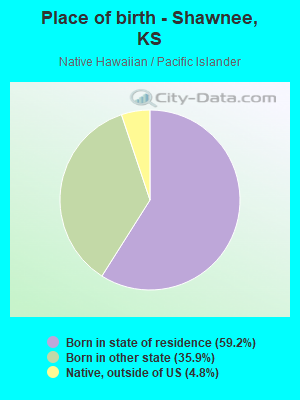
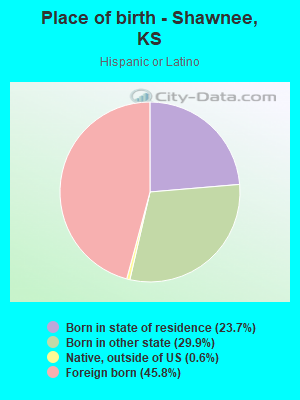
Place of birth - Born in state of residence (%)
Place of birth - Born in state of residence (%) - White
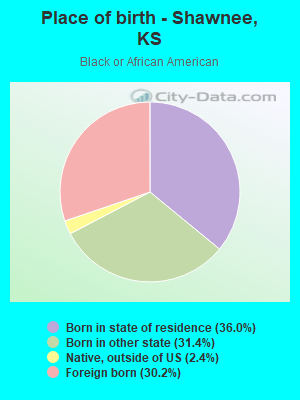
Place of birth - Born in state of residence (%) - Black or African American
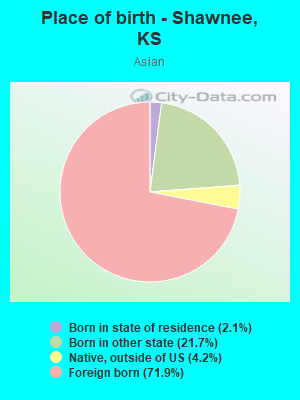
Place of birth - Born in state of residence (%) - Asian
Place of birth - Born in state of residence (%) - Hispanic or Latino
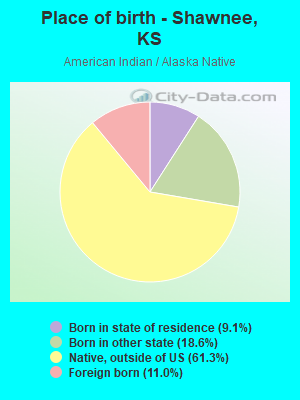
Place of birth - Born in state of residence (%) - American Indian and Alaska Native
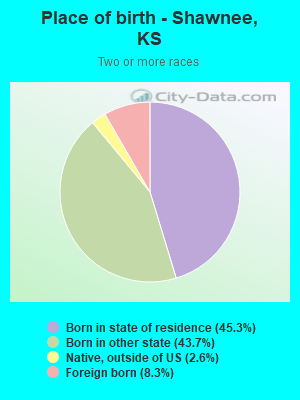
Place of birth - Born in state of residence (%) - Multirace
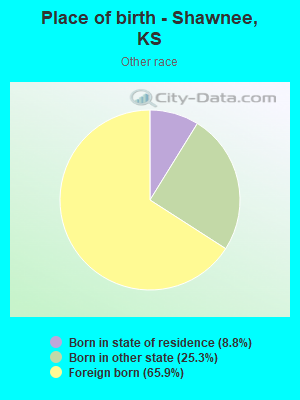
Place of birth - Born in state of residence (%) - Other Race
Place of birth - Born in other state (%)
Place of birth - Born in other state (%) - White
Place of birth - Born in other state (%) - Black or African American
Place of birth - Born in other state (%) - Asian
Place of birth - Born in other state (%) - Hispanic or Latino
Place of birth - Born in other state (%) - American Indian and Alaska Native
Place of birth - Born in other state (%) - Multirace
Place of birth - Born in other state (%) - Other Race
Place of birth - Native, outside of US (%)
Place of birth - Native, outside of US (%) - White
Place of birth - Native, outside of US (%) - Black or African American
Place of birth - Native, outside of US (%) - Asian
Place of birth - Native, outside of US (%) - Hispanic or Latino
Place of birth - Native, outside of US (%) - American Indian and Alaska Native
Place of birth - Native, outside of US (%) - Multirace
Place of birth - Native, outside of US (%) - Other Race
Place of birth - Foreign born (%)
Place of birth - Foreign born (%) - White
Place of birth - Foreign born (%) - Black or African American
Place of birth - Foreign born (%) - Asian
Place of birth - Foreign born (%) - Hispanic or Latino
Place of birth - Foreign born (%) - American Indian and Alaska Native
Place of birth - Foreign born (%) - Multirace
Place of birth - Foreign born (%) - Other Race
Residents speaking English at home (%)
Residents speaking English at home - Born in the United States (%)
Residents speaking English at home - Native, born elsewhere (%)
Residents speaking English at home - Foreign born (%)
Residents speaking Spanish at home (%)
Residents speaking Spanish at home - Born in the United States (%)
Residents speaking Spanish at home - Native, born elsewhere (%)
Residents speaking Spanish at home - Foreign born (%)
Residents speaking other language at home (%)
Residents speaking other language at home - Born in the United States (%)
Residents speaking other language at home - Native, born elsewhere (%)
Residents speaking other language at home - Foreign born (%)
Marital status - Never married (%)
Marital status - Now married (%)
Marital status - Separated (%)
Marital status - Widowed (%)
Marital status - Divorced (%)
Ancestries Reported - Arab (%)
Ancestries Reported - Czech (%)
Ancestries Reported - Danish (%)
Ancestries Reported - Dutch (%)
Ancestries Reported - English (%)
Ancestries Reported - French (%)
Ancestries Reported - French Canadian (%)
Ancestries Reported - German (%)
Ancestries Reported - Greek (%)
Ancestries Reported - Hungarian (%)
Ancestries Reported - Irish (%)
Ancestries Reported - Italian (%)
Ancestries Reported - Lithuanian (%)
Ancestries Reported - Norwegian (%)
Ancestries Reported - Polish (%)
Ancestries Reported - Portuguese (%)
Ancestries Reported - Russian (%)
Ancestries Reported - Scotch-Irish (%)
Ancestries Reported - Scottish (%)
Ancestries Reported - Slovak (%)
Ancestries Reported - Subsaharan African (%)
Ancestries Reported - Swedish (%)
Ancestries Reported - Swiss (%)
Ancestries Reported - Ukrainian (%)
Ancestries Reported - United States (%)
Ancestries Reported - Welsh (%)
Ancestries Reported - West Indian (%)
Ancestries Reported - Other (%)
Geographical mobility - Same house 1 year ago (%)
Geographical mobility - Same house 1 year ago (%) - White
Geographical mobility - Same house 1 year ago (%) - Black or African American
Geographical mobility - Same house 1 year ago (%) - Asian
Geographical mobility - Same house 1 year ago (%) - Hispanic or Latino
Geographical mobility - Same house 1 year ago (%) - American Indian and Alaska Native
Geographical mobility - Same house 1 year ago (%) - Multirace
Geographical mobility - Same house 1 year ago (%) - Other Race
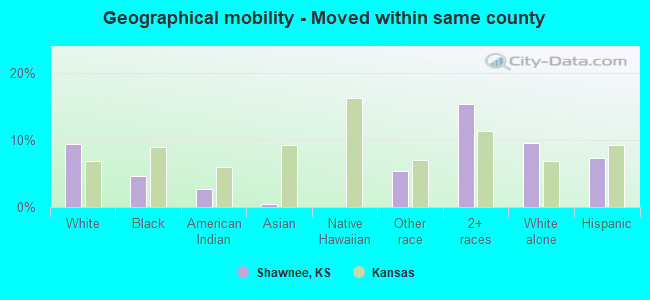
Geographical mobility - Moved within same county (%)
Geographical mobility - Moved within same county (%) - White
Geographical mobility - Moved within same county (%) - Black or African American
Geographical mobility - Moved within same county (%) - Asian
Geographical mobility - Moved within same county (%) - Hispanic or Latino
Geographical mobility - Moved within same county (%) - American Indian and Alaska Native
Geographical mobility - Moved within same county (%) - Multirace
Geographical mobility - Moved within same county (%) - Other Race
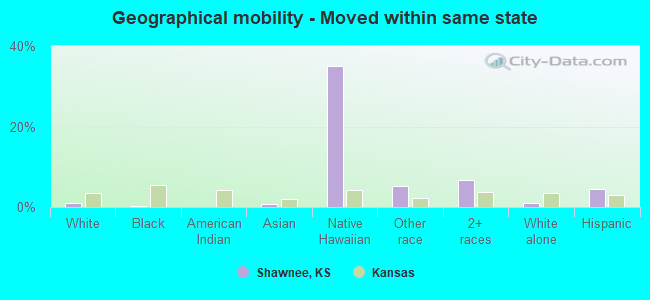
Geographical mobility - Moved from different county within same state (%)
Geographical mobility - Moved from different county within same state (%) - White
Geographical mobility - Moved from different county within same state (%) - Black or African American
Geographical mobility - Moved from different county within same state (%) - Asian
Geographical mobility - Moved from different county within same state (%) - Hispanic or Latino
Geographical mobility - Moved from different county within same state (%) - American Indian and Alaska Native
Geographical mobility - Moved from different county within same state (%) - Multirace
Geographical mobility - Moved from different county within same state (%) - Other Race
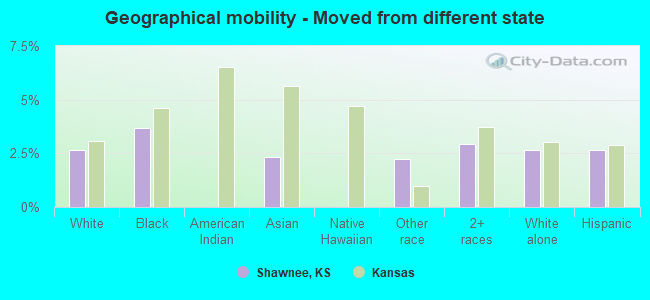
Geographical mobility - Moved from different state (%)
Geographical mobility - Moved from different state (%) - White
Geographical mobility - Moved from different state (%) - Black or African American
Geographical mobility - Moved from different state (%) - Asian
Geographical mobility - Moved from different state (%) - Hispanic or Latino
Geographical mobility - Moved from different state (%) - American Indian and Alaska Native
Geographical mobility - Moved from different state (%) - Multirace
Geographical mobility - Moved from different state (%) - Other Race
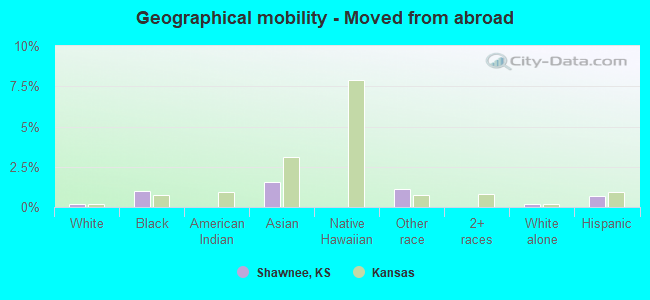
Geographical mobility - Moved from abroad (%)
Geographical mobility - Moved from abroad (%) - White
Geographical mobility - Moved from abroad (%) - Black or African American
Geographical mobility - Moved from abroad (%) - Asian
Geographical mobility - Moved from abroad (%) - Hispanic or Latino
Geographical mobility - Moved from abroad (%) - American Indian and Alaska Native
Geographical mobility - Moved from abroad (%) - Multirace
Geographical mobility - Moved from abroad (%) - Other Race
Place of birth for the foreign-born population - Ireland (%)
Place of birth for the foreign-born population - Denmark (%)
Place of birth for the foreign-born population - Norway (%)
Place of birth for the foreign-born population - Sweden (%)
Place of birth for the foreign-born population - United Kingdom (%)
Place of birth for the foreign-born population - England (%)
Place of birth for the foreign-born population - Scotland (%)
Place of birth for the foreign-born population - Other Northern Europe (%)
Place of birth for the foreign-born population - Austria (%)
Place of birth for the foreign-born population - Belgium (%)
Place of birth for the foreign-born population - France (%)
Place of birth for the foreign-born population - Germany (%)
Place of birth for the foreign-born population - Netherlands (%)
Place of birth for the foreign-born population - Switzerland (%)
Place of birth for the foreign-born population - Other Western Europe (%)
Place of birth for the foreign-born population - Greece (%)
Place of birth for the foreign-born population - Italy (%)
Place of birth for the foreign-born population - Portugal (%)
Place of birth for the foreign-born population - Spain (%)
Place of birth for the foreign-born population - Other Southern Europe (%)
Place of birth for the foreign-born population - Albania (%)
Place of birth for the foreign-born population - Belarus (%)
Place of birth for the foreign-born population - Bosnia and Herzegovina (%)
Place of birth for the foreign-born population - Bulgaria (%)
Place of birth for the foreign-born population - Croatia (%)
Place of birth for the foreign-born population - Czechoslovakia (%)
Place of birth for the foreign-born population - Hungary (%)
Place of birth for the foreign-born population - Latvia (%)
Place of birth for the foreign-born population - Lithuania (%)
Place of birth for the foreign-born population - North Macedonia (Macedonia) (%)
Place of birth for the foreign-born population - Moldova (%)
Place of birth for the foreign-born population - Poland (%)
Place of birth for the foreign-born population - Romania (%)
Place of birth for the foreign-born population - Russia (%)
Place of birth for the foreign-born population - Serbia (%)
Place of birth for the foreign-born population - Ukraine (%)
Place of birth for the foreign-born population - Other Eastern Europe (%)
Place of birth for the foreign-born population - China (%)
Place of birth for the foreign-born population - Hong Kong (%)
Place of birth for the foreign-born population - Taiwan (%)
Place of birth for the foreign-born population - Japan (%)
Place of birth for the foreign-born population - Korea (%)
Place of birth for the foreign-born population - Other Eastern Asia (%)
Place of birth for the foreign-born population - Afghanistan (%)
Place of birth for the foreign-born population - Bangladesh (%)
Place of birth for the foreign-born population - India (%)
Place of birth for the foreign-born population - Iran (%)
Place of birth for the foreign-born population - Kazakhstan (%)
Place of birth for the foreign-born population - Nepal (%)
Place of birth for the foreign-born population - Pakistan (%)
Place of birth for the foreign-born population - Sri Lanka (%)
Place of birth for the foreign-born population - Uzbekistan (%)
Place of birth for the foreign-born population - Other South Central Asia (%)
Place of birth for the foreign-born population - Burma (%)
Place of birth for the foreign-born population - Cambodia (%)
Place of birth for the foreign-born population - Indonesia (%)
Place of birth for the foreign-born population - Laos (%)
Place of birth for the foreign-born population - Malaysia (%)
Place of birth for the foreign-born population - Philippines (%)
Place of birth for the foreign-born population - Singapore (%)
Place of birth for the foreign-born population - Thailand (%)
Place of birth for the foreign-born population - Vietnam (%)
Place of birth for the foreign-born population - Other South Eastern Asia (%)
Place of birth for the foreign-born population - Armenia (%)
Place of birth for the foreign-born population - Iraq (%)
Place of birth for the foreign-born population - Israel (%)
Place of birth for the foreign-born population - Jordan (%)
Place of birth for the foreign-born population - Kuwait (%)
Place of birth for the foreign-born population - Lebanon (%)
Place of birth for the foreign-born population - Saudi Arabia (%)
Place of birth for the foreign-born population - Syria (%)
Place of birth for the foreign-born population - Turkey (%)
Place of birth for the foreign-born population - Yemen (%)
Place of birth for the foreign-born population - Other Western Asia (%)
Place of birth for the foreign-born population - Eritrea (%)
Place of birth for the foreign-born population - Ethiopia (%)
Place of birth for the foreign-born population - Kenya (%)
Place of birth for the foreign-born population - Somalia (%)
Place of birth for the foreign-born population - Uganda (%)
Place of birth for the foreign-born population - Zimbabwe (%)
Place of birth for the foreign-born population - Other Eastern Africa (%)
Place of birth for the foreign-born population - Cameroon (%)
Place of birth for the foreign-born population - Congo (%)
Place of birth for the foreign-born population - Democratic Republic of Congo (Zaire) (%)
Place of birth for the foreign-born population - Other Middle Africa (%)
Place of birth for the foreign-born population - Egypt (%)
Place of birth for the foreign-born population - Morocco (%)
Place of birth for the foreign-born population - Sudan (%)
Place of birth for the foreign-born population - Other Northern Africa (%)
Place of birth for the foreign-born population - South Africa (%)
Place of birth for the foreign-born population - Other Southern Africa (%)
Place of birth for the foreign-born population - Cabo Verde (%)
Place of birth for the foreign-born population - Ghana (%)
Place of birth for the foreign-born population - Liberia (%)
Place of birth for the foreign-born population - Nigeria (%)
Place of birth for the foreign-born population - Senegal (%)
Place of birth for the foreign-born population - Sierra Leone (%)
Place of birth for the foreign-born population - Other Western Africa (%)
Place of birth for the foreign-born population - Australia (%)
Place of birth for the foreign-born population - New Zealand (%)
Place of birth for the foreign-born population - Fiji (%)
Place of birth for the foreign-born population - Micronesia (%)
Place of birth for the foreign-born population - Bahamas (%)
Place of birth for the foreign-born population - Barbados (%)
Place of birth for the foreign-born population - Cuba (%)
Place of birth for the foreign-born population - Dominica (%)
Place of birth for the foreign-born population - Dominican Republic (%)
Place of birth for the foreign-born population - Grenada (%)
Place of birth for the foreign-born population - Haiti (%)
Place of birth for the foreign-born population - Jamaica (%)
Place of birth for the foreign-born population - St. Vincent and the Grenadines (%)
Place of birth for the foreign-born population - Trinidad and Tobago (%)
Place of birth for the foreign-born population - West Indies (%)
Place of birth for the foreign-born population - Other Caribbean (%)
Place of birth for the foreign-born population - Belize (%)
Place of birth for the foreign-born population - Costa Rica (%)
Place of birth for the foreign-born population - El Salvador (%)
Place of birth for the foreign-born population - Guatemala (%)
Place of birth for the foreign-born population - Honduras (%)
Place of birth for the foreign-born population - Mexico (%)
Place of birth for the foreign-born population - Nicaragua (%)
Place of birth for the foreign-born population - Panama (%)
Place of birth for the foreign-born population - Other Central America (%)
Place of birth for the foreign-born population - Argentina (%)
Place of birth for the foreign-born population - Bolivia (%)
Place of birth for the foreign-born population - Brazil (%)
Place of birth for the foreign-born population - Chile (%)
Place of birth for the foreign-born population - Colombia (%)
Place of birth for the foreign-born population - Ecuador (%)
Place of birth for the foreign-born population - Guyana (%)
Place of birth for the foreign-born population - Peru (%)
Place of birth for the foreign-born population - Uruguay (%)
Place of birth for the foreign-born population - Venezuela (%)
Place of birth for the foreign-born population - Other South America (%)
Place of birth for the foreign-born population - Canada (%)
Place of birth for the foreign-born population - Other Northern America (%)
Place of birth for the foreign-born population - Other (%)
Latest news about races in Shawnee, KS collected exclusively by city-data.com from local newspapers, TV, and radio stations
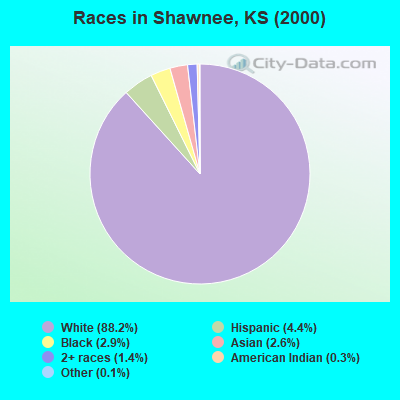
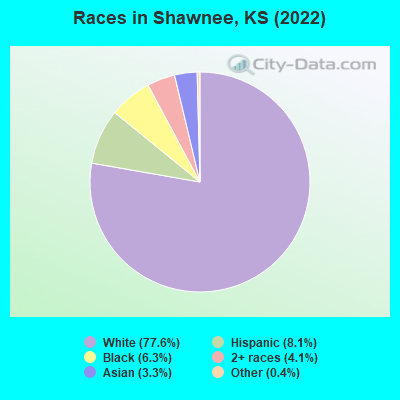
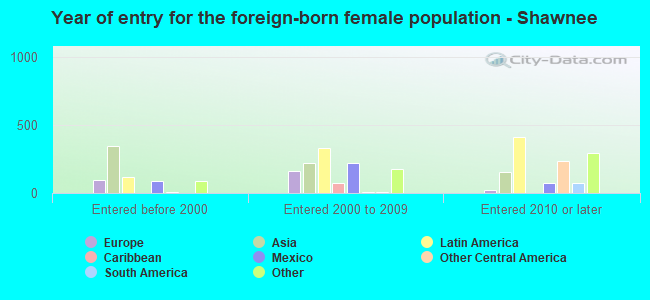
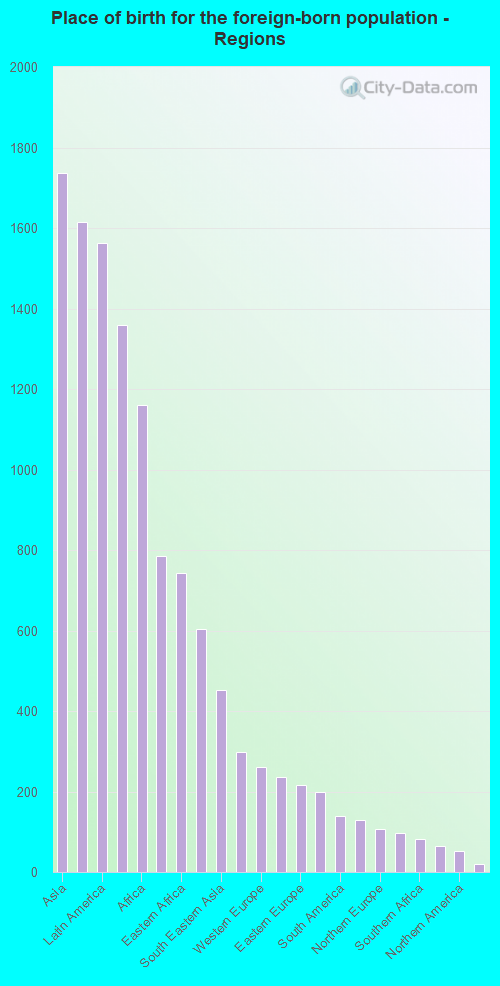
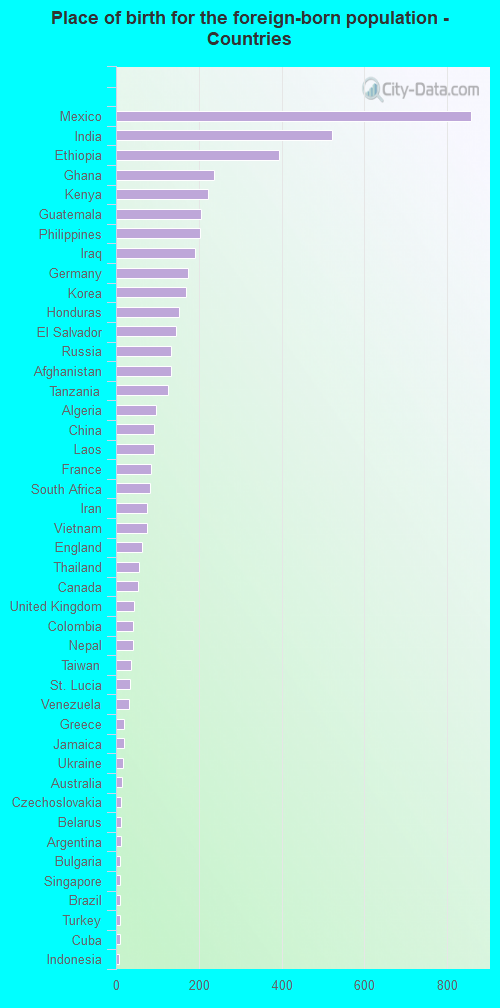
According to 2022 data, the most numerous races in Shawnee, KS are White alone (53,232 residents), Hispanic (5,591 residents), and Black alone (4,300 residents). 88.2% of Shawnee residents speak English at home. 7.5% of Shawnee, KS residents are foreign-born (2.5% born in Asia, 2.3% born in Latin America, 1.7% born in Africa, 0.9% born in Europe), which is 6.4% greater than the foreign-born rate of 7.0% across the entire state of Kansas.
Race distribution in Shawnee
2000 2022
2,233,997 83.1% White alone 188,252 7.0% Hispanic 151,407 5.6% Black alone 46,301 1.7% Asian alone 42,508 1.6% Two or more races 22,322 0.8% American Indian alone 2,477 0.09% Other race alone 1,154 0.04% Native Hawaiian and Other
2,147,943 73.1% White alone 381,746 13.0% Hispanic 147,666 5.0% Black alone 145,362 4.9% Two or more races 85,085 2.9% Asian alone 13,263 0.5% Other race alone 12,065 0.4% American Indian alone 4,020 0.1% Native Hawaiian and Other
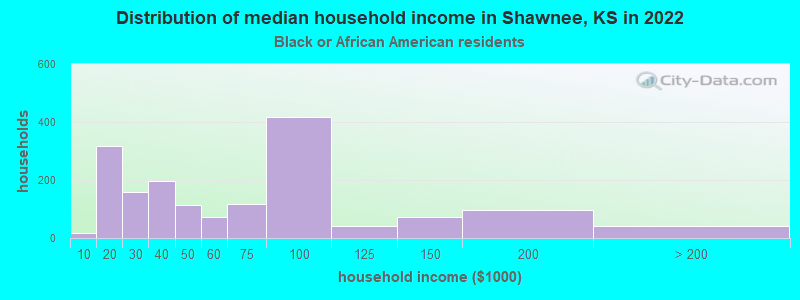
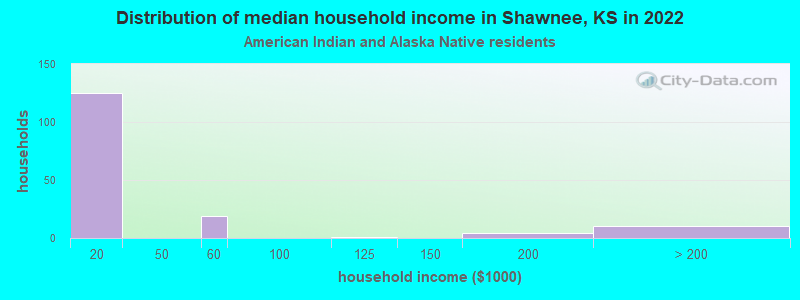
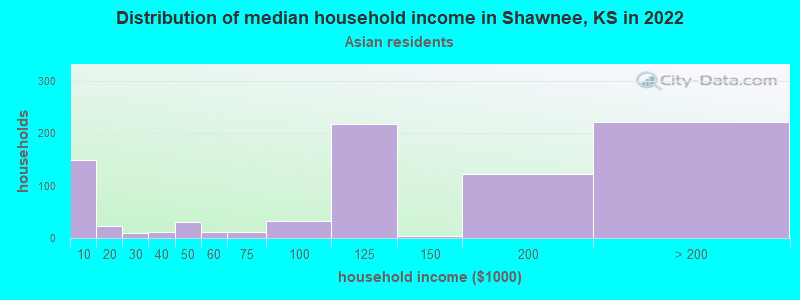
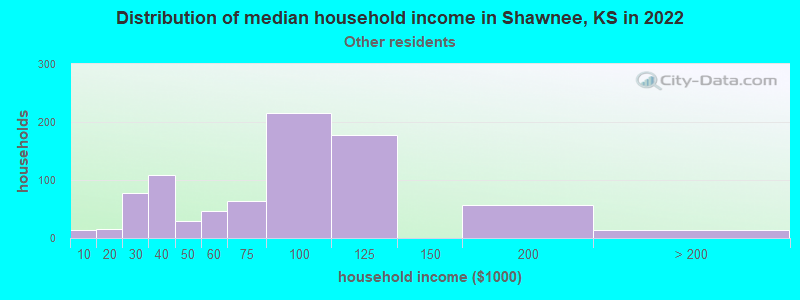
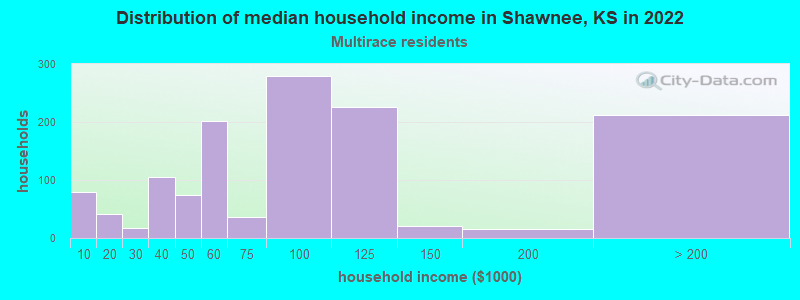
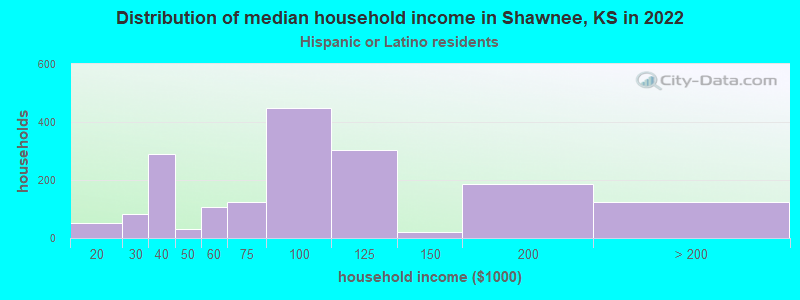
Income and house value in Shawnee Median household income in 2022 $109,123 White non-Hispanic householders$57,408 Black householders$111,417 Asian householders$76,325 Some other race householders$110,084 Two or more races householders$86,992 Hispanic or Latino race householdersMedian 2022 house value $351,742 White Non-Hispanic householders$441,913 Black or African American householders$365,652 American Indian or Alaska Native householders $358,448 Asian householders$273,494 Some other race householders$334,105 Two or more races householders$341,557 Hispanic or Latino householders
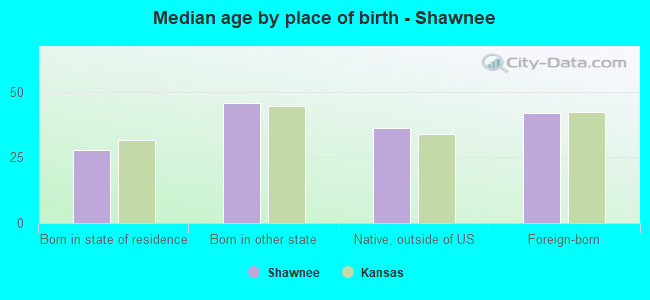
Median age by race in Shawnee
40.0 Median age for White residents37.9 41.4 34.3 Median age for Black or African American residents34.5 34.1 8.0 Median age for American Indian / Alaska Native residents-666,666,666.0 -666,666,666.0 43.9 Median age for Asian residents43.9 46.1 -666,666,666.0 Median age for Native Hawaiian / Pacific Islander residents-666,666,666.0 -666,666,666.0 34.2 Median age for Other race residents34.5 32.6 18.6 Median age for Two or more races residents18.4 19.0 39.7 Median age for White alone residents37.3 41.0 34.1 Median age for Hispanic or Latino residents32.5 35.9
Owner/renter occupied households by race in Shawnee
House owners and renters - White residents 16,695 78.1% Owner occupied4,681 21.9% Renter occupiedHouse owners and renters - Black or African American residents 289 16.5% Owner occupied1,462 83.5% Renter occupiedHouse owners and renters - American Indian / Alaska Native residents 17 13.0% Owner occupied116 87.0% Renter occupiedHouse owners and renters - Asian residents 547 72.0% Owner occupied213 28.0% Renter occupiedHouse owners and renters - Native Hawaiian / Pacific Islander residents 1 100.0% Owner occupiedHouse owners and renters - Other race residents 334 39.8% Owner occupied506 60.2% Renter occupiedHouse owners and renters - Two or more races residents 1,096 82.8% Owner occupied227 17.2% Renter occupiedHouse owners and renters - White alone residents 16,449 79.5% Owner occupied4,252 20.5% Renter occupiedHouse owners and renters - Hispanic or Latino residents 1,096 57.6% Owner occupied808 42.4% Renter occupied
Language usage in Shawnee
English speakers - Total 88.2% of residents of Shawnee speak English at home.
5.5% of residents speak Spanish at home 1,413 40.0% Speak English very well2,123 60.0% Speak English less than very well6.4% of residents speak other language at home 2,344 56.8% Speak English very well1,783 43.2% Speak English less than very well
English speakers - Born in the United States 95.9% of residents of Shawnee speak English at home.
1.7% of residents speak Spanish at home 416 91.8% Speak English very well37 8.2% Speak English less than very well2.4% of residents speak other language at home 591 90.4% Speak English very well63 9.6% Speak English less than very well
English speakers - Native, born elsewhere 85.4% of residents of Shawnee speak English at home.
14.6% of residents speak other language at home 104 100.0% Speak English very well
English speakers - Foreign-born 16.0% of residents of Shawnee speak English at home.
38.0% of residents speak Spanish at home 776 27.9% Speak English very well2,001 72.1% Speak English less than very well46.0% of residents speak other language at home 1,649 48.9% Speak English very well1,720 51.1% Speak English less than very well
White (Caucasian) - Speak only English Native:
98.5% (47,881)Foreign-born:
23.9% (555)
White (Caucasian) - Speak another language Native:
1.5% (718)Foreign-born:
76.1% (1,770)
Black or African American - Speak only English Native:
96.2% (3,025)Foreign-born:
1.8% (15)
Black or African American - Speak another language Native:
3.7% (118)Foreign-born:
100.0% (846)
American Indian / Alaska Native - Speak only English Native:
85.9% (136)Foreign-born:
64.2% (12)
Asian - Speak only English Native:
87.0% (328)Foreign-born:
18.2% (176)
Asian - Speak another language Native:
13.0% (49)Foreign-born:
81.8% (791)
Other race - Speak only English Native:
73.1% (1,082)Foreign-born:
10.3% (97)
Other race - Speak another language Native:
26.5% (392)Foreign-born:
81.1% (765)
Two or more races - Speak another language Native:
12.8% (470)Foreign-born:
100.0% (516)
White alone - Speak only English Native:
98.6% (47,452)Foreign-born:
33.5% (508)
White alone - Speak another language Native:
1.4% (653)Foreign-born:
66.5% (1,008)
Hispanic or Latino - Speak only English Native:
83.3% (2,308)Foreign-born:
1.7% (47)
Hispanic or Latino - Speak another language Native:
16.7% (462)Foreign-born:
98.3% (2,689)
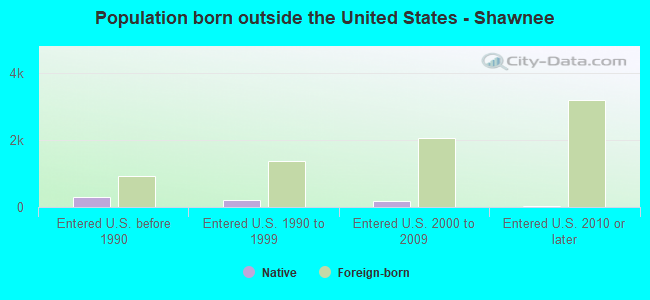
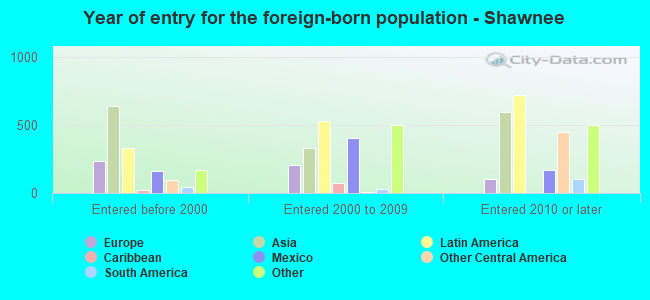
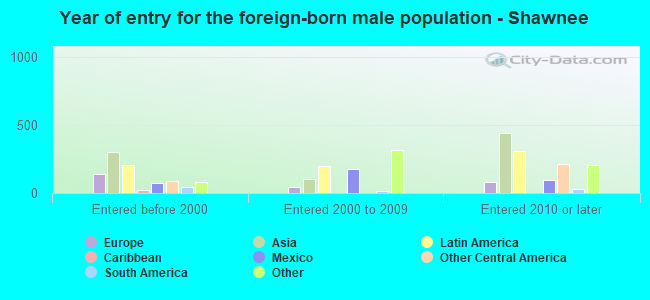
Foreign-born residents in Shawnee 5,132 residents are foreign born (2.5% Asia , 2.3% Latin America , 1.7% Africa , 0.9% Europe ).
This city:
7.5%Kansas:
7.1%
Marital status for residents in Shawnee Marital status - White (Caucasian) population 15 years and over
Males 26.8% Never married63.9% Now married0.9% Separated1.2% Widowed7.2% DivorcedFemales 22.4% Never married57.0% Now married1.3% Separated7.4% Widowed12.0% DivorcedWomen who gave birth in the past 12 months Now married:
86.3% (879)Unmarried:
13.7% (139)
Women who did not give birth in the past 12 months Now married:
56.5% (6,243)Unmarried:
43.5% (4,805)
Marital status - Black or African American population 15 years and over
Males 41.3% Never married42.3% Now married7.9% Separated0.3% Widowed8.2% DivorcedFemales 46.3% Never married33.3% Now married3.2% Separated6.9% Widowed10.3% DivorcedWomen who gave birth in the past 12 months Now married:
100.0% (147)Unmarried:
0.0% (0)
Women who did not give birth in the past 12 months Now married:
40.6% (611)Unmarried:
59.4% (893)
Marital status - American Indian / Alaska Native population 15 years and over
Males 20.0% Never married75.0% Now married0.0% Separated0.0% Widowed5.0% DivorcedFemales 0.0% Never married3.1% Now married0.0% Separated0.0% Widowed96.9% DivorcedWomen who gave birth in the past 12 months Now married:
100.0% (3)Unmarried:
0.0% (0)
Women who did not give birth in the past 12 months Now married:
100.0% (1)Unmarried:
0.0% (0)
Marital status - Asian population 15 years and over
Males 36.8% Never married57.8% Now married0.0% Separated0.0% Widowed5.5% DivorcedFemales 14.8% Never married70.4% Now married0.0% Separated6.8% Widowed8.1% DivorcedWomen who gave birth in the past 12 months Now married:
100.0% (19)Unmarried:
0.0% (0)
Women who did not give birth in the past 12 months Now married:
68.9% (447)Unmarried:
31.1% (202)
Marital status - Native Hawaiian / Pacific Islander population 15 years and over
Males 50.0% Never married0.0% Now married0.0% Separated0.0% Widowed50.0% DivorcedFemales 0.0% Never married0.0% Now married0.0% Separated50.0% Widowed50.0% DivorcedMarital status - Other race population 15 years and over
Males 44.1% Never married47.3% Now married0.0% Separated0.0% Widowed8.5% DivorcedFemales 44.1% Never married33.5% Now married0.0% Separated4.7% Widowed17.7% DivorcedWomen who gave birth in the past 12 months Now married:
100.0% (30)Unmarried:
0.0% (0)
Women who did not give birth in the past 12 months Now married:
36.9% (301)Unmarried:
63.1% (515)
Marital status - Two or more races population 15 years and over
Males 58.6% Never married38.0% Now married0.0% Separated0.4% Widowed3.1% DivorcedFemales 56.8% Never married40.0% Now married0.0% Separated0.2% Widowed3.0% DivorcedWomen who gave birth in the past 12 months Now married:
0.0% (0)Unmarried:
100.0% (60)
Women who did not give birth in the past 12 months Now married:
37.8% (501)Unmarried:
62.2% (823)
Marital status - White alone, not Hispanic / Latino population 15 years and over
Males 25.9% Never married64.5% Now married0.9% Separated1.3% Widowed7.3% DivorcedFemales 22.0% Never married58.6% Now married0.4% Separated7.3% Widowed11.7% DivorcedWomen who gave birth in the past 12 months Now married:
86.3% (879)Unmarried:
13.7% (139)
Women who did not give birth in the past 12 months Now married:
55.4% (5,908)Unmarried:
44.6% (4,760)
Marital status - Hispanic or Latino population 15 years and over
Males 55.6% Never married42.6% Now married0.0% Separated0.0% Widowed1.9% DivorcedFemales 42.1% Never married35.6% Now married8.1% Separated3.1% Widowed11.2% DivorcedWomen who gave birth in the past 12 months Now married:
48.9% (24)Unmarried:
51.1% (25)
Women who did not give birth in the past 12 months Now married:
43.8% (674)Unmarried:
56.2% (865)
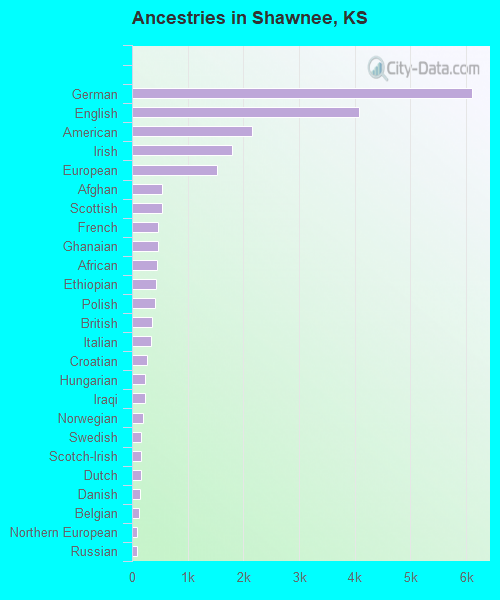
Ancestries in Shawnee
6,107 20.0% German4,069 13.3% English2,161 7.1% American1,789 5.9% Irish1,521 5.0% European535 1.8% Afghan531 1.7% Scottish473 1.5% French464 1.5% Ghanaian451 1.5% African425 1.4% Ethiopian405 1.3% Polish367 1.2% British341 1.1% Italian266 0.9% Croatian239 0.8% Hungarian232 0.8% Iraqi191 0.6% Norwegian169 0.6% Swedish165 0.5% Scotch-Irish160 0.5% Dutch151 0.5% Danish134 0.4% Belgian92 0.3% Northern European86 0.3% Russian82 0.3% South African70 0.2% Scandinavian64 0.2% Kenyan63 0.2% Czech55 0.2% Finnish37 0.1% Slovak36 0.1% Welsh32 0.1% Jamaican27 0.09% Iranian22 0.07% Lithuanian21 0.07% Portuguese21 0.07% West Indian17 0.06% Eastern European12 0.04% French Canadian11 0.04% Lebanese11 0.04% Swiss10 0.03% Armenian8 0.03% Canadian8 0.03% Ukrainian7 0.02% Turkish6 0.02% Pennsylvania German2 0.01% Brazilian2 0.01% Greek
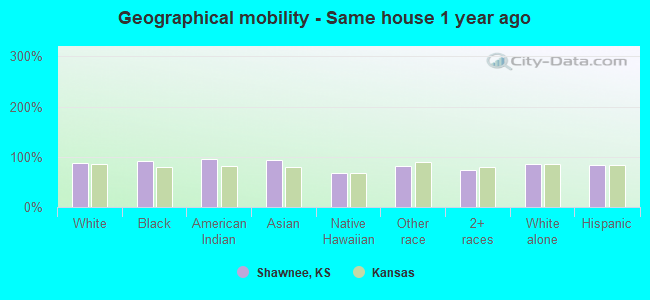
Geographical mobility in Shawnee Same house 1 year ago 46,136 86.8% White (Caucasian)4,117 91.8% Black or African American184 95.9% American Indian / Alaska Native2,118 94.0% Asian4 67.4% Native Hawaiian / Pacific Islander1,959 82.1% Other race3,497 72.9% Two or more races44,851 86.6% White alone, not Hispanic / Latino4,652 84.0% Hispanic or LatinoMoved within same county 4,969 9.4% White / Caucasian210 4.7% Black or African American5 2.7% American Indian / Alaska Native12 0.5% Asian126 5.3% Other race736 15.3% Two or more races4,934 9.5% White alone, not Hispanic / Latino406 7.3% Hispanic or LatinoMoved within same state 515 1.0% White / Caucasian16 0.3% Black or African American15 0.7% Asian2 34.9% Native Hawaiian / Pacific Islander124 5.2% Other race318 6.6% Two or more races515 1.0% White alone, not Hispanic / Latino241 4.4% Hispanic or LatinoMoved from different state 1,411 2.7% White / Caucasian166 3.7% Black or African American53 2.3% Asian53 2.2% Other race141 2.9% Two or more races1,377 2.7% White alone, not Hispanic / Latino147 2.7% Hispanic or LatinoMoved from abroad 109 0.2% White46 1.0% Black or African American35 1.5% Asian26 1.1% Other race109 0.2% White alone, not Hispanic / Latino39 0.7% Hispanic or Latino
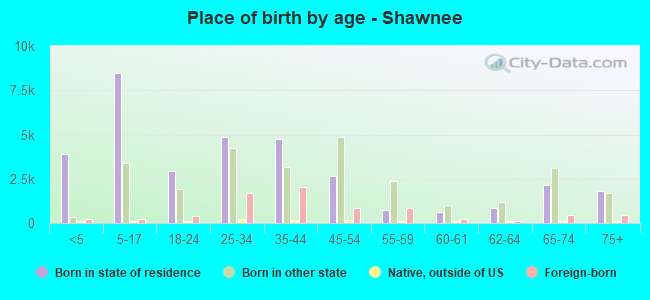
Children Nativity (place of birth) in Shawnee
Children under 6 years - Living with two parents Both parents native 3,242 99.7% Native10 0.3% Foreign-bornBoth parents foreign-born 603 87.8% Native84 12.2% Foreign-bornOne native, one foreign-born parent 108 100.0% NativeChildren under 6 years - Living with one parent Native parent 565 100.0% NativeForeign-born parent 146 100.0% NativeChildren 6 to 17 years - Living with two parents Both parents native 7,691 99.5% Native40 0.5% Foreign-bornBoth parents foreign-born 392 74.9% Native131 25.1% Foreign-bornOne native, one foreign-born parent 732 97.6% Native18 2.4% Foreign-bornChildren 6 to 17 years - Living with one parent Native parent 1,948 100.0% NativeForeign-born parent 175 64.3% Native97 35.7% Foreign-born
Grandparents responsible for own grandchildren in Shawnee
Grandparents (30 to 59 years) White / Caucasian 74 29.1% Responsible for grandchildren180 70.9% Not responsible for grandchildrenAsian 11 32.1% Responsible for grandchildren23 67.9% Not responsible for grandchildrenOther race 54 100.0% Not responsible for grandchildrenTwo or more races 16 100.0% Not responsible for grandchildrenWhite alone, not Hispanic / Latino 56 22.9% Responsible for grandchildren189 77.1% Not responsible for grandchildrenHispanic or Latino 16 29.2% Responsible for grandchildren39 70.8% Not responsible for grandchildrenGrandparents (60 years and over) White / Caucasian 75 15.3% Responsible for grandchildren418 84.7% Not responsible for grandchildrenAsian 1 100.0% Not responsible for grandchildrenWhite alone, not Hispanic / Latino 76 20.3% Responsible for grandchildren297 79.7% Not responsible for grandchildrenHispanic or Latino 103 100.0% Not responsible for grandchildren