Races in Shelby Forest, Tennessee (TN) Detailed Stats
Ancestries, Foreign-born residents, place of birth
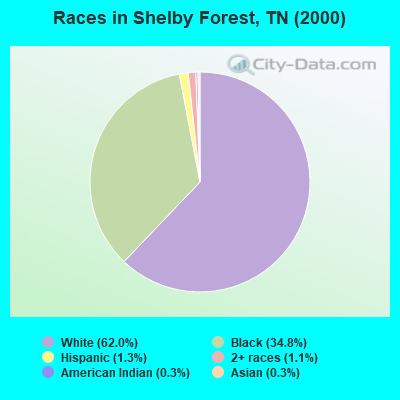
Race distribution in Shelby Forest

- 5,09662.0%White alone
- 2,85934.8%Black alone
- 1061.3%Hispanic
- 931.1%Two or more races
- 250.3%Asian alone
- 270.3%American Indian alone
- 70.09%Other race alone
2000
2022
-
- 4,505,93079.2%White alone
- 928,20416.3%Black alone
- 123,8382.2%Hispanic
- 54,8241.0%Two or more races
- 56,0771.0%Asian alone
- 13,8200.2%American Indian alone
- 4,7800.08%Other race alone
- 1,8100.03%Native Hawaiian and Other
Pacific Islander alone

-
- 5,070,02671.9%White alone
- 1,089,73815.5%Black alone
- 442,6296.3%Hispanic
- 279,3814.0%Two or more races
- 131,8171.9%Asian alone
- 26,9720.4%Other race alone
- 6,3870.09%American Indian alone
- 4,3890.06%Native Hawaiian and Other
Pacific Islander alone

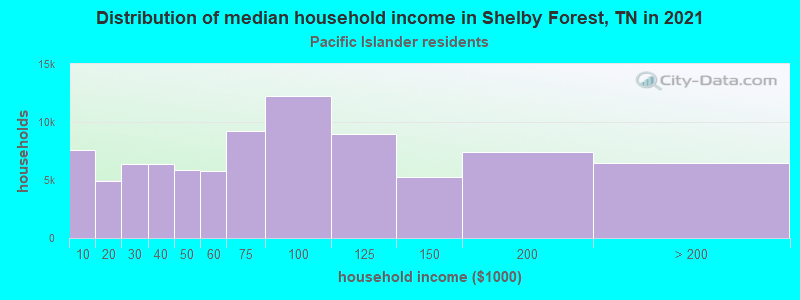
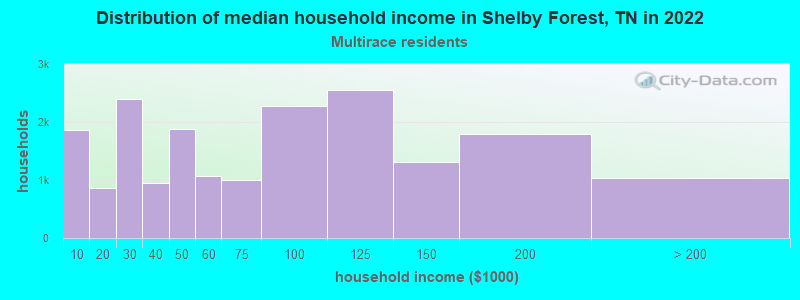
Income and house value in Shelby Forest
- Median household income in 2022
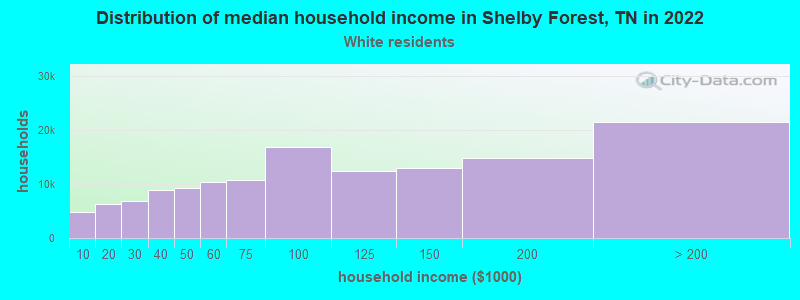
- $89,030White non-Hispanic householders
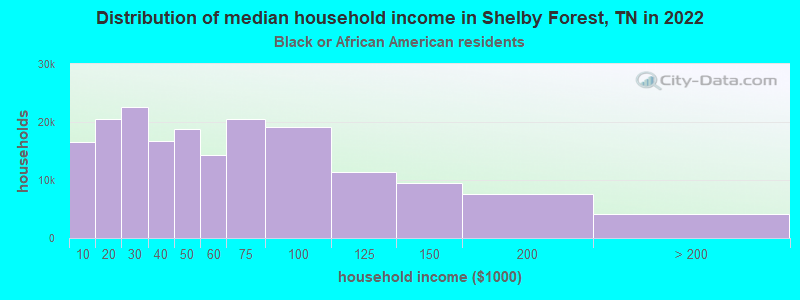
- $44,499Black householders
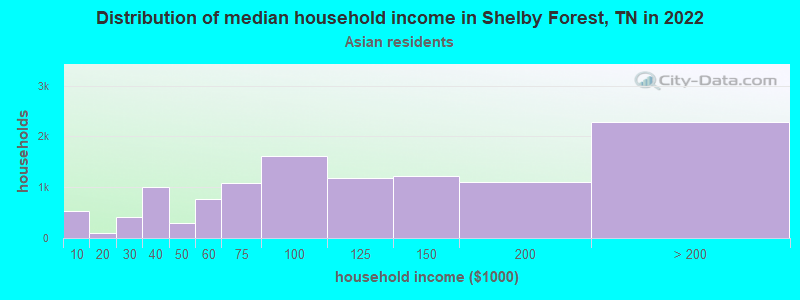
- $120,625Asian householders
- $112,153Two or more races householders
- Median 2022 house value
- $330,756White Non-Hispanic householders
- $146,450Black or African American householders
- over $1,000,000Asian householders
- $124,344Native Hawaiian and other Pacific Islander householders
- $379,942Two or more races householders
Household income for White non-Hispanic householders
Household income for Black householders
Household income for Asian householders
Household income for Native Hawaiian and other Pacific Islander householders
Household income for Two or more races householders
Zip code: 38053