Races in Shelley, Idaho (ID) Detailed Stats
Data:
Races - White alone (%)
Races - White alone (% change since 2000)
Races - Black alone (%)
Races - Black alone (% change since 2000)
Races - American Indian alone (%)
Races - American Indian alone (% change since 2000)
Races - Asian alone (%)
Races - Asian alone (% change since 2000)
Races - Hispanic (%)
Races - Hispanic (% change since 2000)
Races - Native Hawaiian and Other Pacific Islander alone (%)
Races - Native Hawaiian and Other Pacific Islander alone (% change since 2000)
Races - Two or more races(%)
Races - Two or more races(% change since 2000)
Races - Other race alone (%)
Races - Other race alone (% change since 2000)
Racial diversity
Place of birth - Born in state of residence (%)
Place of birth - Born in state of residence (%) - White
Place of birth - Born in state of residence (%) - Black or African American
Place of birth - Born in state of residence (%) - Asian
Place of birth - Born in state of residence (%) - Hispanic or Latino
Place of birth - Born in state of residence (%) - American Indian and Alaska Native
Place of birth - Born in state of residence (%) - Multirace
Place of birth - Born in state of residence (%) - Other Race
Place of birth - Born in other state (%)
Place of birth - Born in other state (%) - White
Place of birth - Born in other state (%) - Black or African American
Place of birth - Born in other state (%) - Asian
Place of birth - Born in other state (%) - Hispanic or Latino
Place of birth - Born in other state (%) - American Indian and Alaska Native
Place of birth - Born in other state (%) - Multirace
Place of birth - Born in other state (%) - Other Race
Place of birth - Native, outside of US (%)
Place of birth - Native, outside of US (%) - White
Place of birth - Native, outside of US (%) - Black or African American
Place of birth - Native, outside of US (%) - Asian
Place of birth - Native, outside of US (%) - Hispanic or Latino
Place of birth - Native, outside of US (%) - American Indian and Alaska Native
Place of birth - Native, outside of US (%) - Multirace
Place of birth - Native, outside of US (%) - Other Race
Place of birth - Foreign born (%)
Place of birth - Foreign born (%) - White
Place of birth - Foreign born (%) - Black or African American
Place of birth - Foreign born (%) - Asian
Place of birth - Foreign born (%) - Hispanic or Latino
Place of birth - Foreign born (%) - American Indian and Alaska Native
Place of birth - Foreign born (%) - Multirace
Place of birth - Foreign born (%) - Other Race
Residents speaking English at home (%)
Residents speaking English at home - Born in the United States (%)
Residents speaking English at home - Native, born elsewhere (%)
Residents speaking English at home - Foreign born (%)
Residents speaking Spanish at home (%)
Residents speaking Spanish at home - Born in the United States (%)
Residents speaking Spanish at home - Native, born elsewhere (%)
Residents speaking Spanish at home - Foreign born (%)
Residents speaking other language at home (%)
Residents speaking other language at home - Born in the United States (%)
Residents speaking other language at home - Native, born elsewhere (%)
Residents speaking other language at home - Foreign born (%)
Marital status - Never married (%)
Marital status - Now married (%)
Marital status - Separated (%)
Marital status - Widowed (%)
Marital status - Divorced (%)
Ancestries Reported - Arab (%)
Ancestries Reported - Czech (%)
Ancestries Reported - Danish (%)
Ancestries Reported - Dutch (%)
Ancestries Reported - English (%)
Ancestries Reported - French (%)
Ancestries Reported - French Canadian (%)
Ancestries Reported - German (%)
Ancestries Reported - Greek (%)
Ancestries Reported - Hungarian (%)
Ancestries Reported - Irish (%)
Ancestries Reported - Italian (%)
Ancestries Reported - Lithuanian (%)
Ancestries Reported - Norwegian (%)
Ancestries Reported - Polish (%)
Ancestries Reported - Portuguese (%)
Ancestries Reported - Russian (%)
Ancestries Reported - Scotch-Irish (%)
Ancestries Reported - Scottish (%)
Ancestries Reported - Slovak (%)
Ancestries Reported - Subsaharan African (%)
Ancestries Reported - Swedish (%)
Ancestries Reported - Swiss (%)
Ancestries Reported - Ukrainian (%)
Ancestries Reported - United States (%)
Ancestries Reported - Welsh (%)
Ancestries Reported - West Indian (%)
Ancestries Reported - Other (%)
Geographical mobility - Same house 1 year ago (%)
Geographical mobility - Same house 1 year ago (%) - White
Geographical mobility - Same house 1 year ago (%) - Black or African American
Geographical mobility - Same house 1 year ago (%) - Asian
Geographical mobility - Same house 1 year ago (%) - Hispanic or Latino
Geographical mobility - Same house 1 year ago (%) - American Indian and Alaska Native
Geographical mobility - Same house 1 year ago (%) - Multirace
Geographical mobility - Same house 1 year ago (%) - Other Race
Geographical mobility - Moved within same county (%)
Geographical mobility - Moved within same county (%) - White
Geographical mobility - Moved within same county (%) - Black or African American
Geographical mobility - Moved within same county (%) - Asian
Geographical mobility - Moved within same county (%) - Hispanic or Latino
Geographical mobility - Moved within same county (%) - American Indian and Alaska Native
Geographical mobility - Moved within same county (%) - Multirace
Geographical mobility - Moved within same county (%) - Other Race
Geographical mobility - Moved from different county within same state (%)
Geographical mobility - Moved from different county within same state (%) - White
Geographical mobility - Moved from different county within same state (%) - Black or African American
Geographical mobility - Moved from different county within same state (%) - Asian
Geographical mobility - Moved from different county within same state (%) - Hispanic or Latino
Geographical mobility - Moved from different county within same state (%) - American Indian and Alaska Native
Geographical mobility - Moved from different county within same state (%) - Multirace
Geographical mobility - Moved from different county within same state (%) - Other Race
Geographical mobility - Moved from different state (%)
Geographical mobility - Moved from different state (%) - White
Geographical mobility - Moved from different state (%) - Black or African American
Geographical mobility - Moved from different state (%) - Asian
Geographical mobility - Moved from different state (%) - Hispanic or Latino
Geographical mobility - Moved from different state (%) - American Indian and Alaska Native
Geographical mobility - Moved from different state (%) - Multirace
Geographical mobility - Moved from different state (%) - Other Race
Geographical mobility - Moved from abroad (%)
Geographical mobility - Moved from abroad (%) - White
Geographical mobility - Moved from abroad (%) - Black or African American
Geographical mobility - Moved from abroad (%) - Asian
Geographical mobility - Moved from abroad (%) - Hispanic or Latino
Geographical mobility - Moved from abroad (%) - American Indian and Alaska Native
Geographical mobility - Moved from abroad (%) - Multirace
Geographical mobility - Moved from abroad (%) - Other Race
Place of birth for the foreign-born population - Ireland (%)
Place of birth for the foreign-born population - Denmark (%)
Place of birth for the foreign-born population - Norway (%)
Place of birth for the foreign-born population - Sweden (%)
Place of birth for the foreign-born population - United Kingdom (%)
Place of birth for the foreign-born population - England (%)
Place of birth for the foreign-born population - Scotland (%)
Place of birth for the foreign-born population - Other Northern Europe (%)
Place of birth for the foreign-born population - Austria (%)
Place of birth for the foreign-born population - Belgium (%)
Place of birth for the foreign-born population - France (%)
Place of birth for the foreign-born population - Germany (%)
Place of birth for the foreign-born population - Netherlands (%)
Place of birth for the foreign-born population - Switzerland (%)
Place of birth for the foreign-born population - Other Western Europe (%)
Place of birth for the foreign-born population - Greece (%)
Place of birth for the foreign-born population - Italy (%)
Place of birth for the foreign-born population - Portugal (%)
Place of birth for the foreign-born population - Spain (%)
Place of birth for the foreign-born population - Other Southern Europe (%)
Place of birth for the foreign-born population - Albania (%)
Place of birth for the foreign-born population - Belarus (%)
Place of birth for the foreign-born population - Bosnia and Herzegovina (%)
Place of birth for the foreign-born population - Bulgaria (%)
Place of birth for the foreign-born population - Croatia (%)
Place of birth for the foreign-born population - Czechoslovakia (%)
Place of birth for the foreign-born population - Hungary (%)
Place of birth for the foreign-born population - Latvia (%)
Place of birth for the foreign-born population - Lithuania (%)
Place of birth for the foreign-born population - North Macedonia (Macedonia) (%)
Place of birth for the foreign-born population - Moldova (%)
Place of birth for the foreign-born population - Poland (%)
Place of birth for the foreign-born population - Romania (%)
Place of birth for the foreign-born population - Russia (%)
Place of birth for the foreign-born population - Serbia (%)
Place of birth for the foreign-born population - Ukraine (%)
Place of birth for the foreign-born population - Other Eastern Europe (%)
Place of birth for the foreign-born population - China (%)
Place of birth for the foreign-born population - Hong Kong (%)
Place of birth for the foreign-born population - Taiwan (%)
Place of birth for the foreign-born population - Japan (%)
Place of birth for the foreign-born population - Korea (%)
Place of birth for the foreign-born population - Other Eastern Asia (%)
Place of birth for the foreign-born population - Afghanistan (%)
Place of birth for the foreign-born population - Bangladesh (%)
Place of birth for the foreign-born population - India (%)
Place of birth for the foreign-born population - Iran (%)
Place of birth for the foreign-born population - Kazakhstan (%)
Place of birth for the foreign-born population - Nepal (%)
Place of birth for the foreign-born population - Pakistan (%)
Place of birth for the foreign-born population - Sri Lanka (%)
Place of birth for the foreign-born population - Uzbekistan (%)
Place of birth for the foreign-born population - Other South Central Asia (%)
Place of birth for the foreign-born population - Burma (%)
Place of birth for the foreign-born population - Cambodia (%)
Place of birth for the foreign-born population - Indonesia (%)
Place of birth for the foreign-born population - Laos (%)
Place of birth for the foreign-born population - Malaysia (%)
Place of birth for the foreign-born population - Philippines (%)
Place of birth for the foreign-born population - Singapore (%)
Place of birth for the foreign-born population - Thailand (%)
Place of birth for the foreign-born population - Vietnam (%)
Place of birth for the foreign-born population - Other South Eastern Asia (%)
Place of birth for the foreign-born population - Armenia (%)
Place of birth for the foreign-born population - Iraq (%)
Place of birth for the foreign-born population - Israel (%)
Place of birth for the foreign-born population - Jordan (%)
Place of birth for the foreign-born population - Kuwait (%)
Place of birth for the foreign-born population - Lebanon (%)
Place of birth for the foreign-born population - Saudi Arabia (%)
Place of birth for the foreign-born population - Syria (%)
Place of birth for the foreign-born population - Turkey (%)
Place of birth for the foreign-born population - Yemen (%)
Place of birth for the foreign-born population - Other Western Asia (%)
Place of birth for the foreign-born population - Eritrea (%)
Place of birth for the foreign-born population - Ethiopia (%)
Place of birth for the foreign-born population - Kenya (%)
Place of birth for the foreign-born population - Somalia (%)
Place of birth for the foreign-born population - Uganda (%)
Place of birth for the foreign-born population - Zimbabwe (%)
Place of birth for the foreign-born population - Other Eastern Africa (%)
Place of birth for the foreign-born population - Cameroon (%)
Place of birth for the foreign-born population - Congo (%)
Place of birth for the foreign-born population - Democratic Republic of Congo (Zaire) (%)
Place of birth for the foreign-born population - Other Middle Africa (%)
Place of birth for the foreign-born population - Egypt (%)
Place of birth for the foreign-born population - Morocco (%)
Place of birth for the foreign-born population - Sudan (%)
Place of birth for the foreign-born population - Other Northern Africa (%)
Place of birth for the foreign-born population - South Africa (%)
Place of birth for the foreign-born population - Other Southern Africa (%)
Place of birth for the foreign-born population - Cabo Verde (%)
Place of birth for the foreign-born population - Ghana (%)
Place of birth for the foreign-born population - Liberia (%)
Place of birth for the foreign-born population - Nigeria (%)
Place of birth for the foreign-born population - Senegal (%)
Place of birth for the foreign-born population - Sierra Leone (%)
Place of birth for the foreign-born population - Other Western Africa (%)
Place of birth for the foreign-born population - Australia (%)
Place of birth for the foreign-born population - New Zealand (%)
Place of birth for the foreign-born population - Fiji (%)
Place of birth for the foreign-born population - Micronesia (%)
Place of birth for the foreign-born population - Bahamas (%)
Place of birth for the foreign-born population - Barbados (%)
Place of birth for the foreign-born population - Cuba (%)
Place of birth for the foreign-born population - Dominica (%)
Place of birth for the foreign-born population - Dominican Republic (%)
Place of birth for the foreign-born population - Grenada (%)
Place of birth for the foreign-born population - Haiti (%)
Place of birth for the foreign-born population - Jamaica (%)
Place of birth for the foreign-born population - St. Vincent and the Grenadines (%)
Place of birth for the foreign-born population - Trinidad and Tobago (%)
Place of birth for the foreign-born population - West Indies (%)
Place of birth for the foreign-born population - Other Caribbean (%)
Place of birth for the foreign-born population - Belize (%)
Place of birth for the foreign-born population - Costa Rica (%)
Place of birth for the foreign-born population - El Salvador (%)
Place of birth for the foreign-born population - Guatemala (%)
Place of birth for the foreign-born population - Honduras (%)
Place of birth for the foreign-born population - Mexico (%)
Place of birth for the foreign-born population - Nicaragua (%)
Place of birth for the foreign-born population - Panama (%)
Place of birth for the foreign-born population - Other Central America (%)
Place of birth for the foreign-born population - Argentina (%)
Place of birth for the foreign-born population - Bolivia (%)
Place of birth for the foreign-born population - Brazil (%)
Place of birth for the foreign-born population - Chile (%)
Place of birth for the foreign-born population - Colombia (%)
Place of birth for the foreign-born population - Ecuador (%)
Place of birth for the foreign-born population - Guyana (%)
Place of birth for the foreign-born population - Peru (%)
Place of birth for the foreign-born population - Uruguay (%)
Place of birth for the foreign-born population - Venezuela (%)
Place of birth for the foreign-born population - Other South America (%)
Place of birth for the foreign-born population - Canada (%)
Place of birth for the foreign-born population - Other Northern America (%)
Place of birth for the foreign-born population - Other (%)
According to 2022 data, the most numerous races in Shelley, ID are White alone (4,065 residents), Hispanic (645 residents), and Two or more races (412 residents). 88.6% of Shelley residents speak English at home. 5.9% of Shelley, ID residents are foreign-born (6.0% born in Latin America), which is 15.0% greater than the foreign-born rate of 5.0% across the entire state of Idaho.
Race distribution in Shelley
2000 2022
1,139,291 88.0% White alone 101,690 7.9% Hispanic 18,261 1.4% Two or more races 15,789 1.2% American Indian alone 11,641 0.9% Asian alone 4,889 0.4% Black alone 1,192 0.09% Other race alone 1,200 0.09% Native Hawaiian and Other
1,531,219 79.0% White alone 261,921 13.5% Hispanic 81,112 4.2% Two or more races 25,174 1.3% Asian alone 15,825 0.8% American Indian alone 11,868 0.6% Black alone 8,752 0.5% Other race alone 3,162 0.2% Native Hawaiian and Other
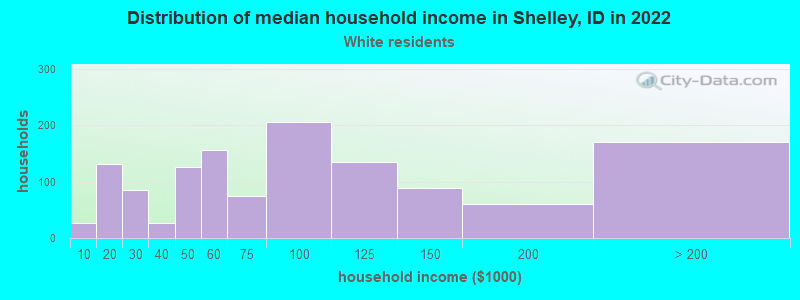
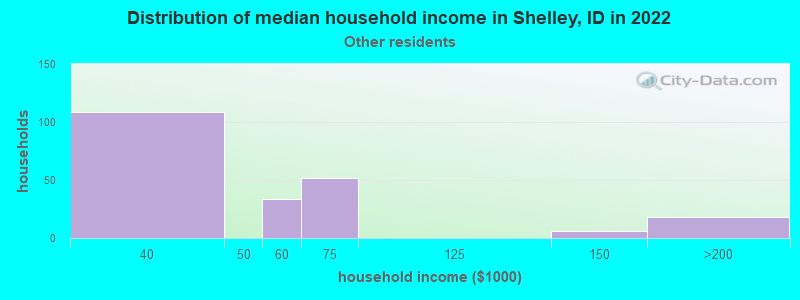
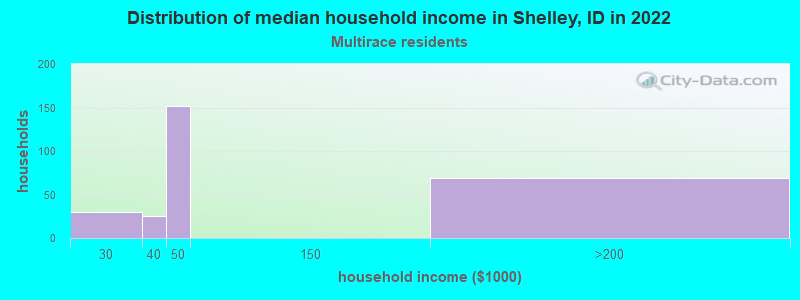
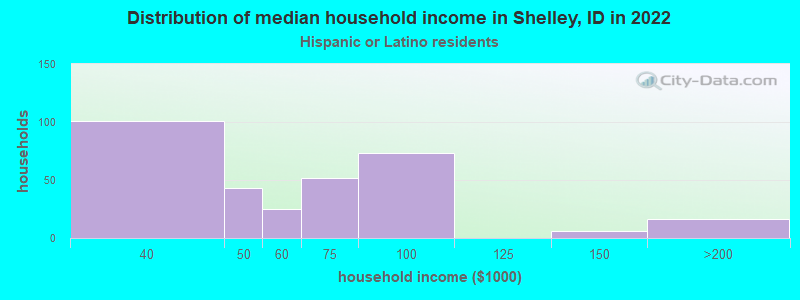
Income and house value in Shelley Median household income in 2022 $68,642 White non-Hispanic householders$56,478 Some other race householders$46,154 Two or more races householders$58,191 Hispanic or Latino race householdersMedian 2022 house value $304,782 White Non-Hispanic householders $329,599 Asian householders$265,618 Some other race householders$348,987 Two or more races householders$278,026 Hispanic or Latino householders
Median age by race in Shelley
29.8 Median age for White residents25.2 31.2 -774,193,547.6 Median age for Black or African American residents-680,851,063.1 -869,696,968.8 -660,714,285.1 Median age for American Indian / Alaska Native residents-708,860,758.8 -601,489,757.3 -687,208,215.9 Median age for Asian residents-720,720,720.0 -642,796,248.3 -393,939,393.5 Median age for Native Hawaiian / Pacific Islander residents-355,119,825.4 -679,245,282.3 50.6 Median age for Other race residents51.8 63.9 23.9 Median age for Two or more races residents17.9 23.7 29.7 Median age for White alone residents25.0 33.0 46.6 Median age for Hispanic or Latino residents46.0 52.7
Owner/renter occupied households by race in Shelley
House owners and renters - White residents 969 76.3% Owner occupied300 23.7% Renter occupiedHouse owners and renters - Other race residents 113 54.1% Owner occupied96 45.9% Renter occupiedHouse owners and renters - Two or more races residents 249 90.5% Owner occupied26 9.5% Renter occupiedHouse owners and renters - White alone residents 912 74.8% Owner occupied307 25.2% Renter occupiedHouse owners and renters - Hispanic or Latino residents 224 73.4% Owner occupied81 26.6% Renter occupied
Language usage in Shelley
English speakers - Total 88.6% of residents of Shelley speak English at home.
8.6% of residents speak Spanish at home 194 49.9% Speak English very well195 50.1% Speak English less than very well2.7% of residents speak other language at home 96 78.0% Speak English very well27 22.0% Speak English less than very well
English speakers - Born in the United States 95.8% of residents of Shelley speak English at home.
4.3% of residents speak Spanish at home 34 70.8% Speak English very well14 29.2% Speak English less than very well
English speakers - Foreign-born 6.9% of residents of Shelley speak English at home.
86.9% of residents speak Spanish at home 158 56.6% Speak English very well121 43.4% Speak English less than very well
Other race - Speak only English Native:
80.9% (94)Foreign-born:
10.8% (27)
Other race - Speak another language Native:
22.2% (26)Foreign-born:
89.3% (225)
Two or more races - Speak another language Native:
38.7% (170)Foreign-born:
97.2% (107)
Hispanic or Latino - Speak only English Native:
68.7% (227)Foreign-born:
8.5% (27)
Hispanic or Latino - Speak another language Native:
31.6% (104)Foreign-born:
91.4% (285)
Foreign-born residents in Shelley 300 residents are foreign born (6.0% Latin America ).
Marital status for residents in Shelley Marital status - White (Caucasian) population 15 years and over
Males 27.6% Never married66.2% Now married0.0% Separated3.7% Widowed2.6% DivorcedFemales 20.3% Never married63.0% Now married0.0% Separated11.0% Widowed5.7% DivorcedWomen who gave birth in the past 12 months Now married:
53.8% (21)Unmarried:
46.2% (18)
Women who did not give birth in the past 12 months Now married:
68.6% (673)Unmarried:
31.4% (309)
Marital status - Other race population 15 years and over
Males 6.2% Never married61.8% Now married16.7% Separated0.0% Widowed15.3% DivorcedFemales 0.0% Never married53.5% Now married0.0% Separated46.5% Widowed0.0% DivorcedWomen who did not give birth in the past 12 months Now married:
100.0% (60)Unmarried:
0.0% (0)
Marital status - Two or more races population 15 years and over
Males 51.9% Never married36.5% Now married0.0% Separated11.6% Widowed0.0% DivorcedFemales 0.0% Never married15.5% Now married38.0% Separated46.5% Widowed0.0% DivorcedWomen who gave birth in the past 12 months Now married:
100.0% (77)Unmarried:
0.0% (0)
Women who did not give birth in the past 12 months Now married:
100.0% (15)Unmarried:
0.0% (0)
Marital status - White alone, not Hispanic / Latino population 15 years and over
Males 27.6% Never married66.2% Now married0.0% Separated3.7% Widowed2.6% DivorcedFemales 21.5% Never married60.7% Now married0.0% Separated11.7% Widowed6.1% DivorcedWomen who gave birth in the past 12 months Now married:
53.8% (22)Unmarried:
46.2% (19)
Women who did not give birth in the past 12 months Now married:
65.3% (593)Unmarried:
34.7% (316)
Marital status - Hispanic or Latino population 15 years and over
Males 33.9% Never married36.3% Now married9.8% Separated11.0% Widowed9.0% DivorcedFemales 0.0% Never married56.8% Now married0.0% Separated43.2% Widowed0.0% DivorcedWomen who did not give birth in the past 12 months Now married:
100.0% (156)Unmarried:
0.0% (0)
Ancestries in Shelley
1,179 48.7% English477 19.7% American100 4.1% Scottish93 3.8% German51 2.1% Swiss44 1.8% Irish39 1.6% Welsh27 1.1% Danish14 0.6% European
Children Nativity (place of birth) in Shelley
Children under 6 years - Living with two parents Both parents native 539 100.0% NativeChildren under 6 years - Living with one parent Native parent 57 100.0% NativeChildren 6 to 17 years - Living with two parents Both parents native 771 100.0% NativeBoth parents foreign-born 14 100.0% NativeChildren 6 to 17 years - Living with one parent Native parent 56 100.0% NativeForeign-born parent 53 51.1% Native51 48.9% Foreign-born
Place of birth for residents in Shelley 300 Americas300 Latin America300 Central America
Grandparents responsible for own grandchildren in Shelley
Grandparents (30 to 59 years) White / Caucasian 45 52.5% Responsible for grandchildren41 47.5% Not responsible for grandchildrenOther race 89 100.0% Not responsible for grandchildrenTwo or more races 107 100.0% Responsible for grandchildrenWhite alone, not Hispanic / Latino 49 54.2% Responsible for grandchildren41 45.8% Not responsible for grandchildrenHispanic or Latino 74 100.0% Not responsible for grandchildren
Grandparents (60 years and over) White / Caucasian 29 100.0% Not responsible for grandchildrenTwo or more races 32 100.0% Responsible for grandchildrenWhite alone, not Hispanic / Latino 30 100.0% Not responsible for grandchildrenHispanic or Latino 40 100.0% Responsible for grandchildren