Races in Skidaway Island, Georgia (GA) Detailed Stats
Data:
Races - White alone (%)
Races - White alone (% change since 2000)
Races - Black alone (%)
Races - Black alone (% change since 2000)
Races - American Indian alone (%)
Races - American Indian alone (% change since 2000)
Races - Asian alone (%)
Races - Asian alone (% change since 2000)
Races - Hispanic (%)
Races - Hispanic (% change since 2000)
Races - Native Hawaiian and Other Pacific Islander alone (%)
Races - Native Hawaiian and Other Pacific Islander alone (% change since 2000)
Races - Two or more races(%)
Races - Two or more races(% change since 2000)
Races - Other race alone (%)
Races - Other race alone (% change since 2000)
Racial diversity
Place of birth - Born in state of residence (%)
Place of birth - Born in state of residence (%) - White
Place of birth - Born in state of residence (%) - Black or African American
Place of birth - Born in state of residence (%) - Asian
Place of birth - Born in state of residence (%) - Hispanic or Latino
Place of birth - Born in state of residence (%) - American Indian and Alaska Native
Place of birth - Born in state of residence (%) - Multirace
Place of birth - Born in state of residence (%) - Other Race
Place of birth - Born in other state (%)
Place of birth - Born in other state (%) - White
Place of birth - Born in other state (%) - Black or African American
Place of birth - Born in other state (%) - Asian
Place of birth - Born in other state (%) - Hispanic or Latino
Place of birth - Born in other state (%) - American Indian and Alaska Native
Place of birth - Born in other state (%) - Multirace
Place of birth - Born in other state (%) - Other Race
Place of birth - Native, outside of US (%)
Place of birth - Native, outside of US (%) - White
Place of birth - Native, outside of US (%) - Black or African American
Place of birth - Native, outside of US (%) - Asian
Place of birth - Native, outside of US (%) - Hispanic or Latino
Place of birth - Native, outside of US (%) - American Indian and Alaska Native
Place of birth - Native, outside of US (%) - Multirace
Place of birth - Native, outside of US (%) - Other Race
Place of birth - Foreign born (%)
Place of birth - Foreign born (%) - White
Place of birth - Foreign born (%) - Black or African American
Place of birth - Foreign born (%) - Asian
Place of birth - Foreign born (%) - Hispanic or Latino
Place of birth - Foreign born (%) - American Indian and Alaska Native
Place of birth - Foreign born (%) - Multirace
Place of birth - Foreign born (%) - Other Race
Residents speaking English at home (%)
Residents speaking English at home - Born in the United States (%)
Residents speaking English at home - Native, born elsewhere (%)
Residents speaking English at home - Foreign born (%)
Residents speaking Spanish at home (%)
Residents speaking Spanish at home - Born in the United States (%)
Residents speaking Spanish at home - Native, born elsewhere (%)
Residents speaking Spanish at home - Foreign born (%)
Residents speaking other language at home (%)
Residents speaking other language at home - Born in the United States (%)
Residents speaking other language at home - Native, born elsewhere (%)
Residents speaking other language at home - Foreign born (%)
Marital status - Never married (%)
Marital status - Now married (%)
Marital status - Separated (%)
Marital status - Widowed (%)
Marital status - Divorced (%)
Ancestries Reported - Arab (%)
Ancestries Reported - Czech (%)
Ancestries Reported - Danish (%)
Ancestries Reported - Dutch (%)
Ancestries Reported - English (%)
Ancestries Reported - French (%)
Ancestries Reported - French Canadian (%)
Ancestries Reported - German (%)
Ancestries Reported - Greek (%)
Ancestries Reported - Hungarian (%)
Ancestries Reported - Irish (%)
Ancestries Reported - Italian (%)
Ancestries Reported - Lithuanian (%)
Ancestries Reported - Norwegian (%)
Ancestries Reported - Polish (%)
Ancestries Reported - Portuguese (%)
Ancestries Reported - Russian (%)
Ancestries Reported - Scotch-Irish (%)
Ancestries Reported - Scottish (%)
Ancestries Reported - Slovak (%)
Ancestries Reported - Subsaharan African (%)
Ancestries Reported - Swedish (%)
Ancestries Reported - Swiss (%)
Ancestries Reported - Ukrainian (%)
Ancestries Reported - United States (%)
Ancestries Reported - Welsh (%)
Ancestries Reported - West Indian (%)
Ancestries Reported - Other (%)
Geographical mobility - Same house 1 year ago (%)
Geographical mobility - Same house 1 year ago (%) - White
Geographical mobility - Same house 1 year ago (%) - Black or African American
Geographical mobility - Same house 1 year ago (%) - Asian
Geographical mobility - Same house 1 year ago (%) - Hispanic or Latino
Geographical mobility - Same house 1 year ago (%) - American Indian and Alaska Native
Geographical mobility - Same house 1 year ago (%) - Multirace
Geographical mobility - Same house 1 year ago (%) - Other Race
Geographical mobility - Moved within same county (%)
Geographical mobility - Moved within same county (%) - White
Geographical mobility - Moved within same county (%) - Black or African American
Geographical mobility - Moved within same county (%) - Asian
Geographical mobility - Moved within same county (%) - Hispanic or Latino
Geographical mobility - Moved within same county (%) - American Indian and Alaska Native
Geographical mobility - Moved within same county (%) - Multirace
Geographical mobility - Moved within same county (%) - Other Race
Geographical mobility - Moved from different county within same state (%)
Geographical mobility - Moved from different county within same state (%) - White
Geographical mobility - Moved from different county within same state (%) - Black or African American
Geographical mobility - Moved from different county within same state (%) - Asian
Geographical mobility - Moved from different county within same state (%) - Hispanic or Latino
Geographical mobility - Moved from different county within same state (%) - American Indian and Alaska Native
Geographical mobility - Moved from different county within same state (%) - Multirace
Geographical mobility - Moved from different county within same state (%) - Other Race
Geographical mobility - Moved from different state (%)
Geographical mobility - Moved from different state (%) - White
Geographical mobility - Moved from different state (%) - Black or African American
Geographical mobility - Moved from different state (%) - Asian
Geographical mobility - Moved from different state (%) - Hispanic or Latino
Geographical mobility - Moved from different state (%) - American Indian and Alaska Native
Geographical mobility - Moved from different state (%) - Multirace
Geographical mobility - Moved from different state (%) - Other Race
Geographical mobility - Moved from abroad (%)
Geographical mobility - Moved from abroad (%) - White
Geographical mobility - Moved from abroad (%) - Black or African American
Geographical mobility - Moved from abroad (%) - Asian
Geographical mobility - Moved from abroad (%) - Hispanic or Latino
Geographical mobility - Moved from abroad (%) - American Indian and Alaska Native
Geographical mobility - Moved from abroad (%) - Multirace
Geographical mobility - Moved from abroad (%) - Other Race
Place of birth for the foreign-born population - Ireland (%)
Place of birth for the foreign-born population - Denmark (%)
Place of birth for the foreign-born population - Norway (%)
Place of birth for the foreign-born population - Sweden (%)
Place of birth for the foreign-born population - United Kingdom (%)
Place of birth for the foreign-born population - England (%)
Place of birth for the foreign-born population - Scotland (%)
Place of birth for the foreign-born population - Other Northern Europe (%)
Place of birth for the foreign-born population - Austria (%)
Place of birth for the foreign-born population - Belgium (%)
Place of birth for the foreign-born population - France (%)
Place of birth for the foreign-born population - Germany (%)
Place of birth for the foreign-born population - Netherlands (%)
Place of birth for the foreign-born population - Switzerland (%)
Place of birth for the foreign-born population - Other Western Europe (%)
Place of birth for the foreign-born population - Greece (%)
Place of birth for the foreign-born population - Italy (%)
Place of birth for the foreign-born population - Portugal (%)
Place of birth for the foreign-born population - Spain (%)
Place of birth for the foreign-born population - Other Southern Europe (%)
Place of birth for the foreign-born population - Albania (%)
Place of birth for the foreign-born population - Belarus (%)
Place of birth for the foreign-born population - Bosnia and Herzegovina (%)
Place of birth for the foreign-born population - Bulgaria (%)
Place of birth for the foreign-born population - Croatia (%)
Place of birth for the foreign-born population - Czechoslovakia (%)
Place of birth for the foreign-born population - Hungary (%)
Place of birth for the foreign-born population - Latvia (%)
Place of birth for the foreign-born population - Lithuania (%)
Place of birth for the foreign-born population - North Macedonia (Macedonia) (%)
Place of birth for the foreign-born population - Moldova (%)
Place of birth for the foreign-born population - Poland (%)
Place of birth for the foreign-born population - Romania (%)
Place of birth for the foreign-born population - Russia (%)
Place of birth for the foreign-born population - Serbia (%)
Place of birth for the foreign-born population - Ukraine (%)
Place of birth for the foreign-born population - Other Eastern Europe (%)
Place of birth for the foreign-born population - China (%)
Place of birth for the foreign-born population - Hong Kong (%)
Place of birth for the foreign-born population - Taiwan (%)
Place of birth for the foreign-born population - Japan (%)
Place of birth for the foreign-born population - Korea (%)
Place of birth for the foreign-born population - Other Eastern Asia (%)
Place of birth for the foreign-born population - Afghanistan (%)
Place of birth for the foreign-born population - Bangladesh (%)
Place of birth for the foreign-born population - India (%)
Place of birth for the foreign-born population - Iran (%)
Place of birth for the foreign-born population - Kazakhstan (%)
Place of birth for the foreign-born population - Nepal (%)
Place of birth for the foreign-born population - Pakistan (%)
Place of birth for the foreign-born population - Sri Lanka (%)
Place of birth for the foreign-born population - Uzbekistan (%)
Place of birth for the foreign-born population - Other South Central Asia (%)
Place of birth for the foreign-born population - Burma (%)
Place of birth for the foreign-born population - Cambodia (%)
Place of birth for the foreign-born population - Indonesia (%)
Place of birth for the foreign-born population - Laos (%)
Place of birth for the foreign-born population - Malaysia (%)
Place of birth for the foreign-born population - Philippines (%)
Place of birth for the foreign-born population - Singapore (%)
Place of birth for the foreign-born population - Thailand (%)
Place of birth for the foreign-born population - Vietnam (%)
Place of birth for the foreign-born population - Other South Eastern Asia (%)
Place of birth for the foreign-born population - Armenia (%)
Place of birth for the foreign-born population - Iraq (%)
Place of birth for the foreign-born population - Israel (%)
Place of birth for the foreign-born population - Jordan (%)
Place of birth for the foreign-born population - Kuwait (%)
Place of birth for the foreign-born population - Lebanon (%)
Place of birth for the foreign-born population - Saudi Arabia (%)
Place of birth for the foreign-born population - Syria (%)
Place of birth for the foreign-born population - Turkey (%)
Place of birth for the foreign-born population - Yemen (%)
Place of birth for the foreign-born population - Other Western Asia (%)
Place of birth for the foreign-born population - Eritrea (%)
Place of birth for the foreign-born population - Ethiopia (%)
Place of birth for the foreign-born population - Kenya (%)
Place of birth for the foreign-born population - Somalia (%)
Place of birth for the foreign-born population - Uganda (%)
Place of birth for the foreign-born population - Zimbabwe (%)
Place of birth for the foreign-born population - Other Eastern Africa (%)
Place of birth for the foreign-born population - Cameroon (%)
Place of birth for the foreign-born population - Congo (%)
Place of birth for the foreign-born population - Democratic Republic of Congo (Zaire) (%)
Place of birth for the foreign-born population - Other Middle Africa (%)
Place of birth for the foreign-born population - Egypt (%)
Place of birth for the foreign-born population - Morocco (%)
Place of birth for the foreign-born population - Sudan (%)
Place of birth for the foreign-born population - Other Northern Africa (%)
Place of birth for the foreign-born population - South Africa (%)
Place of birth for the foreign-born population - Other Southern Africa (%)
Place of birth for the foreign-born population - Cabo Verde (%)
Place of birth for the foreign-born population - Ghana (%)
Place of birth for the foreign-born population - Liberia (%)
Place of birth for the foreign-born population - Nigeria (%)
Place of birth for the foreign-born population - Senegal (%)
Place of birth for the foreign-born population - Sierra Leone (%)
Place of birth for the foreign-born population - Other Western Africa (%)
Place of birth for the foreign-born population - Australia (%)
Place of birth for the foreign-born population - New Zealand (%)
Place of birth for the foreign-born population - Fiji (%)
Place of birth for the foreign-born population - Micronesia (%)
Place of birth for the foreign-born population - Bahamas (%)
Place of birth for the foreign-born population - Barbados (%)
Place of birth for the foreign-born population - Cuba (%)
Place of birth for the foreign-born population - Dominica (%)
Place of birth for the foreign-born population - Dominican Republic (%)
Place of birth for the foreign-born population - Grenada (%)
Place of birth for the foreign-born population - Haiti (%)
Place of birth for the foreign-born population - Jamaica (%)
Place of birth for the foreign-born population - St. Vincent and the Grenadines (%)
Place of birth for the foreign-born population - Trinidad and Tobago (%)
Place of birth for the foreign-born population - West Indies (%)
Place of birth for the foreign-born population - Other Caribbean (%)
Place of birth for the foreign-born population - Belize (%)
Place of birth for the foreign-born population - Costa Rica (%)
Place of birth for the foreign-born population - El Salvador (%)
Place of birth for the foreign-born population - Guatemala (%)
Place of birth for the foreign-born population - Honduras (%)
Place of birth for the foreign-born population - Mexico (%)
Place of birth for the foreign-born population - Nicaragua (%)
Place of birth for the foreign-born population - Panama (%)
Place of birth for the foreign-born population - Other Central America (%)
Place of birth for the foreign-born population - Argentina (%)
Place of birth for the foreign-born population - Bolivia (%)
Place of birth for the foreign-born population - Brazil (%)
Place of birth for the foreign-born population - Chile (%)
Place of birth for the foreign-born population - Colombia (%)
Place of birth for the foreign-born population - Ecuador (%)
Place of birth for the foreign-born population - Guyana (%)
Place of birth for the foreign-born population - Peru (%)
Place of birth for the foreign-born population - Uruguay (%)
Place of birth for the foreign-born population - Venezuela (%)
Place of birth for the foreign-born population - Other South America (%)
Place of birth for the foreign-born population - Canada (%)
Place of birth for the foreign-born population - Other Northern America (%)
Place of birth for the foreign-born population - Other (%)
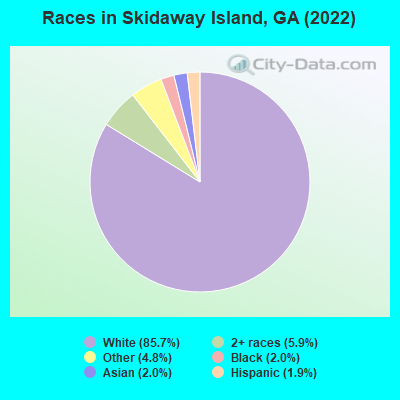
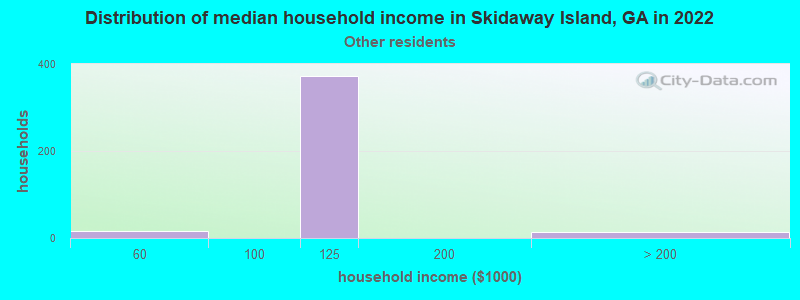
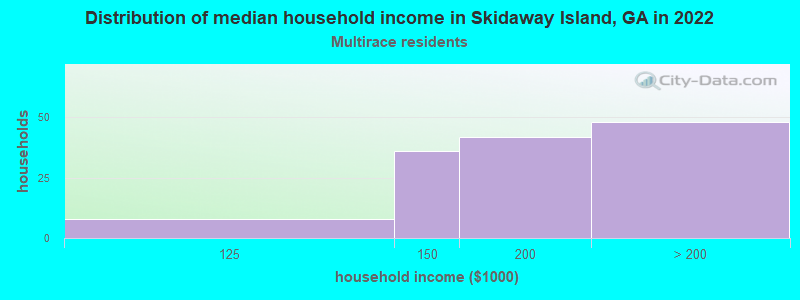
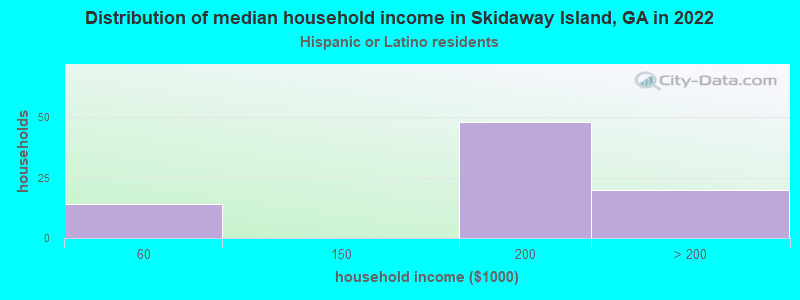
According to 2022 data, the most numerous races in Skidaway Island, GA are White alone (8,097 residents), Black alone (192 residents), and Hispanic (176 residents). 98.3% of Skidaway Island residents speak English at home. 5.8% of Skidaway Island, GA residents are foreign-born (2.8% born in Europe, 1.9% born in Asia), which is 73.0% less than the foreign-born rate of 10.0% across the entire state of Georgia.
Race distribution in Skidaway Island
2000 2022
5,128,661 62.6% White alone 2,331,465 28.5% Black alone 435,227 5.3% Hispanic 171,513 2.1% Asian alone 87,364 1.1% Two or more races 17,670 0.2% American Indian alone 11,275 0.1% Other race alone 3,278 0.04% Native Hawaiian and Other
5,415,657 49.6% White alone 3,349,240 30.7% Black alone 1,132,604 10.4% Hispanic 479,156 4.4% Asian alone 462,923 4.2% Two or more races 54,416 0.5% Other race alone 11,923 0.1% American Indian alone 6,957 0.06% Native Hawaiian and Other
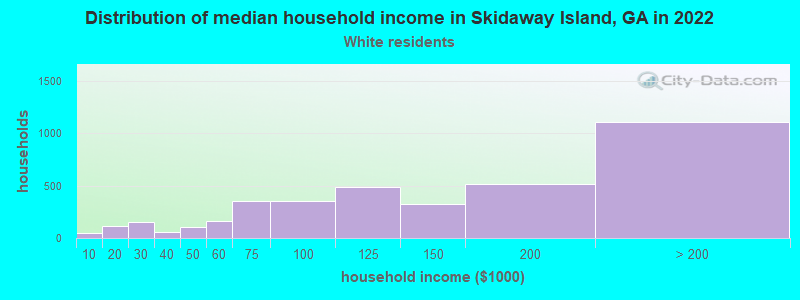
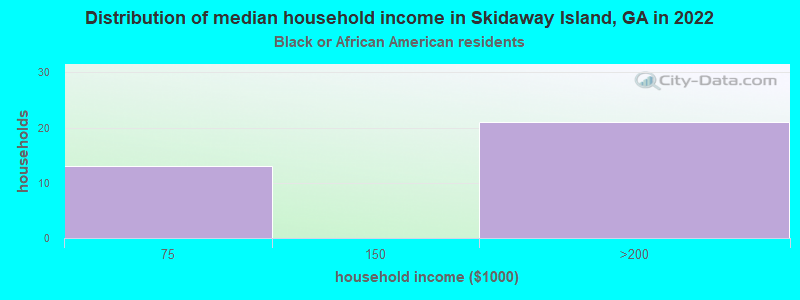
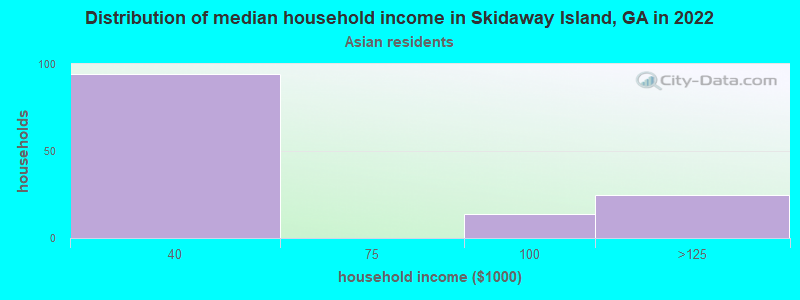
Income and house value in Skidaway Island Median household income in 2022 $131,024 White non-Hispanic householders$79,275 Some other race householders$188,052 Two or more races householders$182,543 Hispanic or Latino race householdersMedian 2022 house value $785,940 White Non-Hispanic householders$472,168 American Indian or Alaska Native householders $577,934 Asian householders$346,257 Some other race householders$503,646 Two or more races householders$346,257 Hispanic or Latino householders
Median age by race in Skidaway Island
68.4 Median age for White residents66.8 68.8 50.2 Median age for Black or African American residents28.8 62.1 -588,353,413.1 Median age for American Indian / Alaska Native residents-487,455,196.6 -663,013,698.0 56.9 Median age for Asian residents39.2 80.9 -657,243,815.6 Median age for Native Hawaiian / Pacific Islander residents-693,227,090.9 -776,776,776.0 65.9 Median age for Other race residents59.2 51.6 49.2 Median age for Two or more races residents72.4 34.8 68.1 Median age for White alone residents65.8 68.1 57.2 Median age for Hispanic or Latino residents76.9 52.9
Owner/renter occupied households by race in Skidaway Island
House owners and renters - White residents 3,543 91.7% Owner occupied320 8.3% Renter occupiedHouse owners and renters - Black or African American residents 28 67.0% Owner occupied14 33.0% Renter occupiedHouse owners and renters - Asian residents 125 100.0% Owner occupiedHouse owners and renters - Other race residents 290 100.0% Owner occupiedHouse owners and renters - Two or more races residents 192 95.7% Owner occupied9 4.3% Renter occupiedHouse owners and renters - White alone residents 3,540 91.3% Owner occupied339 8.7% Renter occupiedHouse owners and renters - Hispanic or Latino residents 80 100.0% Owner occupied
Language usage in Skidaway Island
English speakers - Total 98.3% of residents of Skidaway Island speak English at home.
0.4% of residents speak Spanish at home 39 100.0% Speak English very well2.5% of residents speak other language at home 185 81.5% Speak English very well42 18.5% Speak English less than very well
English speakers - Born in the United States 98.1% of residents of Skidaway Island speak English at home.
0.8% of residents speak Spanish at home 49 100.0% Speak English very well1.2% of residents speak other language at home 44 61.1% Speak English very well28 38.9% Speak English less than very well
English speakers - Native, born elsewhere 90.7% of residents of Skidaway Island speak English at home.
10.7% of residents speak other language at home 15 100.0% Speak English very well
English speakers - Foreign-born 95.4% of residents of Skidaway Island speak English at home.
29.7% of residents speak other language at home 134 85.9% Speak English very well22 14.1% Speak English less than very well
White (Caucasian) - Speak only English Native:
99.1% (7,548)Foreign-born:
87.5% (172)
White (Caucasian) - Speak another language Native:
1.3% (102)Foreign-born:
43.7% (86)
Asian - Speak only English Native:
100.0% (13)Foreign-born:
100.0% (160)
Other race - Speak only English Native:
100.0% (525)Foreign-born:
100.0% (21)
White alone - Speak only English Native:
98.0% (7,532)Foreign-born:
74.8% (181)
White alone - Speak another language Native:
1.9% (146)Foreign-born:
31.3% (76)
Hispanic or Latino - Speak only English Native:
96.2% (154)Foreign-born:
100.0% (11)
Foreign-born residents in Skidaway Island 546 residents are foreign born (2.8% Europe , 1.9% Asia ).
This city:
5.8%Georgia:
10.4%
Marital status for residents in Skidaway Island Marital status - White (Caucasian) population 15 years and over
Males 10.4% Never married80.9% Now married0.0% Separated4.3% Widowed4.5% DivorcedFemales 6.8% Never married69.4% Now married0.4% Separated13.7% Widowed9.7% DivorcedWomen who gave birth in the past 12 months Now married:
100.0% (19)Unmarried:
0.0% (0)
Women who did not give birth in the past 12 months Now married:
64.3% (470)Unmarried:
35.7% (261)
Marital status - Black or African American population 15 years and over
Males 57.1% Never married42.9% Now married0.0% Separated0.0% Widowed0.0% DivorcedFemales 8.0% Never married50.7% Now married0.0% Separated0.0% Widowed41.3% DivorcedWomen who did not give birth in the past 12 months Now married:
89.3% (25)Unmarried:
10.7% (3)
Marital status - Asian population 15 years and over
Males 70.5% Never married29.5% Now married0.0% Separated0.0% Widowed0.0% DivorcedFemales 10.9% Never married75.0% Now married0.0% Separated14.1% Widowed0.0% DivorcedWomen who did not give birth in the past 12 months Now married:
0.0% (0)Unmarried:
100.0% (7)
Marital status - Other race population 15 years and over
Males 91.4% Never married8.6% Now married0.0% Separated0.0% Widowed0.0% DivorcedFemales 13.5% Never married28.8% Now married0.0% Separated0.0% Widowed57.7% DivorcedWomen who did not give birth in the past 12 months Now married:
0.0% (0)Unmarried:
100.0% (35)
Marital status - Two or more races population 15 years and over
Males 10.5% Never married62.9% Now married0.0% Separated5.7% Widowed21.0% DivorcedFemales 17.6% Never married80.7% Now married0.0% Separated1.6% Widowed0.0% DivorcedWomen who did not give birth in the past 12 months Now married:
100.0% (60)Unmarried:
0.0% (0)
Marital status - White alone, not Hispanic / Latino population 15 years and over
Males 10.4% Never married80.9% Now married0.0% Separated4.3% Widowed4.5% DivorcedFemales 6.9% Never married69.0% Now married0.4% Separated13.9% Widowed9.8% DivorcedWomen who gave birth in the past 12 months Now married:
100.0% (20)Unmarried:
0.0% (0)
Women who did not give birth in the past 12 months Now married:
62.1% (446)Unmarried:
37.9% (272)
Marital status - Hispanic or Latino population 15 years and over
Males 0.0% Never married100.0% Now married0.0% Separated0.0% Widowed0.0% DivorcedFemales 31.7% Never married67.3% Now married0.0% Separated1.0% Widowed0.0% DivorcedWomen who did not give birth in the past 12 months Now married:
100.0% (59)Unmarried:
0.0% (0)
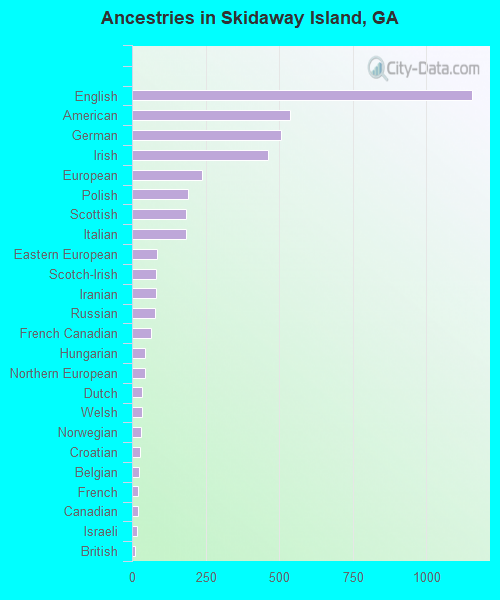
Ancestries in Skidaway Island
1,156 24.9% English536 11.5% American508 10.9% German461 9.9% Irish238 5.1% European190 4.1% Polish183 3.9% Scottish182 3.9% Italian86 1.9% Eastern European81 1.7% Scotch-Irish80 1.7% Iranian79 1.7% Russian66 1.4% French Canadian45 1.0% Hungarian44 0.9% Northern European35 0.8% Dutch35 0.8% Welsh30 0.6% Norwegian28 0.6% Croatian23 0.5% Belgian22 0.5% French21 0.5% Canadian16 0.3% Israeli11 0.2% British10 0.2% Swedish9 0.2% Scandinavian8 0.2% Greek5 0.1% Czechoslovakian1 0.02% Haitian
Children Nativity (place of birth) in Skidaway Island
Children under 6 years - Living with two parents Both parents native 208 100.0% NativeOne native, one foreign-born parent 21 100.0% Native
Children 6 to 17 years - Living with two parents Both parents native 578 96.5% Native21 3.5% Foreign-bornOne native, one foreign-born parent 64 100.0% NativeChildren 6 to 17 years - Living with one parent Native parent 187 100.0% Native