Races in Snoqualmie Valley, Washington (WA) Detailed Stats
Ancestries, Foreign-born residents, place of birth
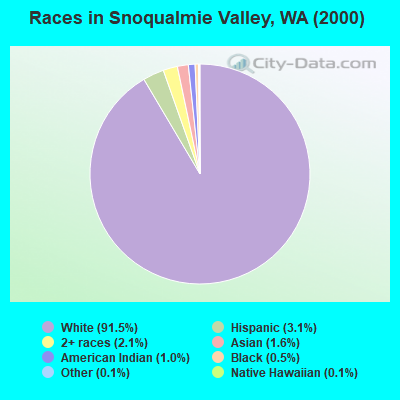
Race distribution in Snoqualmie Valley

- 33,76091.5%White alone
- 1,1413.1%Hispanic
- 7772.1%Two or more races
- 5911.6%Asian alone
- 3511.0%American Indian alone
- 1790.5%Black alone
- 400.1%Native Hawaiian and Other
Pacific Islander alone - 540.1%Other race alone
2000
2022
-
- 4,652,49078.9%White alone
- 441,5097.5%Hispanic
- 319,4015.4%Asian alone
- 184,6313.1%Black alone
- 175,9263.0%Two or more races
- 85,3961.4%American Indian alone
- 22,7790.4%Native Hawaiian and Other
Pacific Islander alone - 11,9890.2%Other race alone

-
- 4,941,45663.5%White alone
- 1,093,31314.0%Hispanic
- 755,8329.7%Asian alone
- 523,4486.7%Two or more races
- 299,5373.8%Black alone
- 69,0240.9%American Indian alone
- 52,2310.7%Native Hawaiian and Other
Pacific Islander alone - 50,9450.7%Other race alone

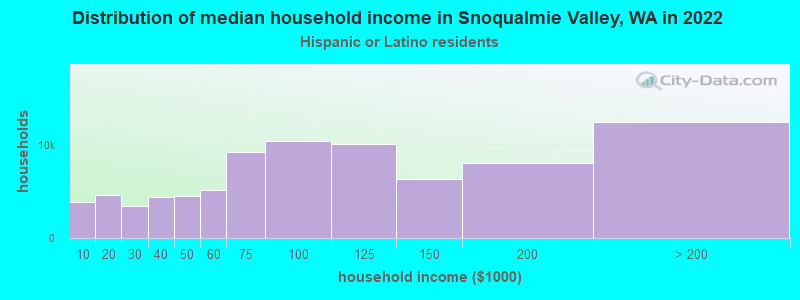
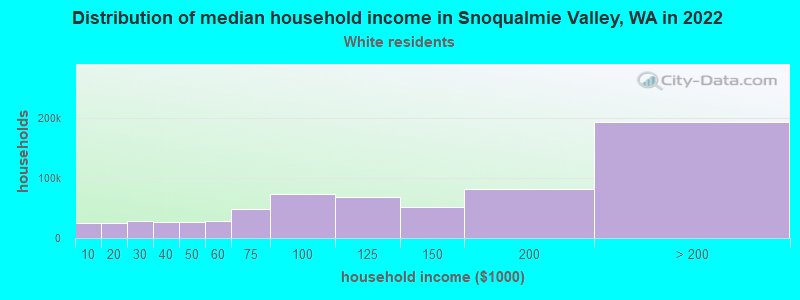
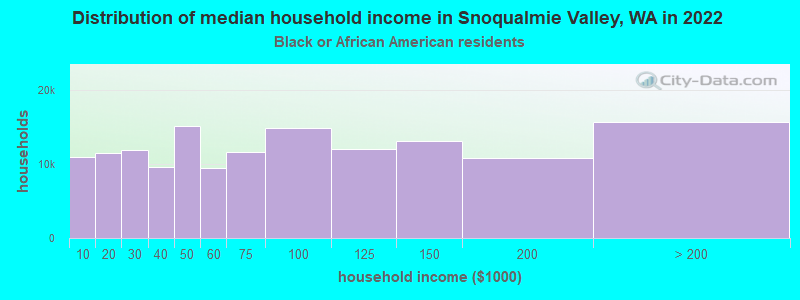
Income and house value in Snoqualmie Valley
- Median household income in 2022
- $141,094White non-Hispanic householders
- $173,505Black householders
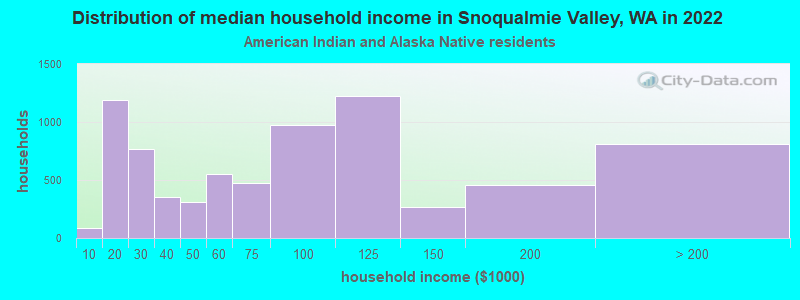
- $115,828American Indian and Alaska Native householders
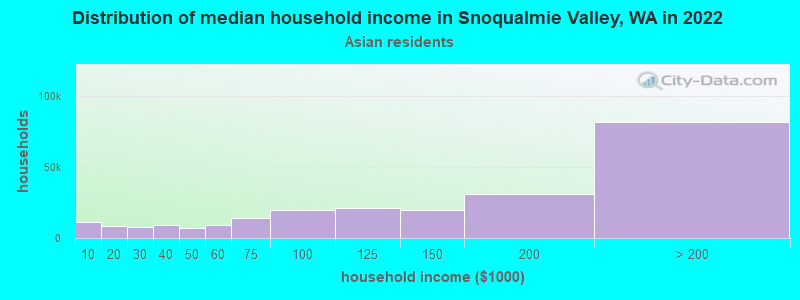
- $180,787Asian householders
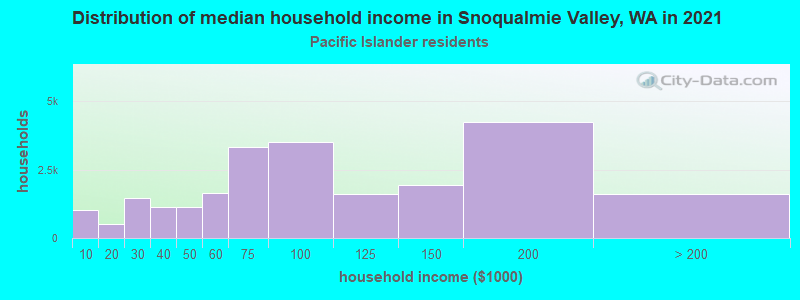
- $123,918Native Hawaiian and other Pacific Islander householders
- $76,976Some other race householders
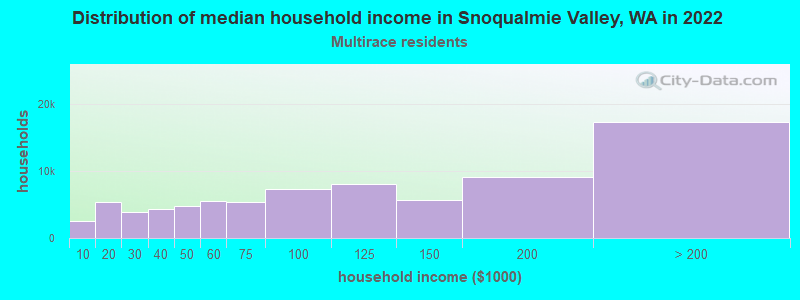
- $102,972Two or more races householders
- $100,046Hispanic or Latino race householders
- Median 2022 house value
- $911,327White Non-Hispanic householders
- over $1,000,000Black or African American householders
- over $1,000,000American Indian or Alaska Native householders
- over $1,000,000Asian householders
- $656,932Native Hawaiian and other Pacific Islander householders
- $654,647Some other race householders
- over $1,000,000Two or more races householders
- over $1,000,000Hispanic or Latino householders
Household income for White non-Hispanic householders
Household income for Black householders
Household income for American Indian and Alaska Native householders
Household income for Asian householders
Household income for Native Hawaiian and other Pacific Islander householders
Household income for Two or more races householders
Household income for Hispanic or Latino race householders