Races in South Apopka, Florida (FL) Detailed Stats
Data:
Races - White alone (%)
Races - White alone (% change since 2000)
Races - Black alone (%)
Races - Black alone (% change since 2000)
Races - American Indian alone (%)
Races - American Indian alone (% change since 2000)
Races - Asian alone (%)
Races - Asian alone (% change since 2000)
Races - Hispanic (%)
Races - Hispanic (% change since 2000)
Races - Native Hawaiian and Other Pacific Islander alone (%)
Races - Native Hawaiian and Other Pacific Islander alone (% change since 2000)
Races - Two or more races(%)
Races - Two or more races(% change since 2000)
Races - Other race alone (%)
Races - Other race alone (% change since 2000)
Racial diversity
Place of birth - Born in state of residence (%)
Place of birth - Born in state of residence (%) - White
Place of birth - Born in state of residence (%) - Black or African American
Place of birth - Born in state of residence (%) - Asian
Place of birth - Born in state of residence (%) - Hispanic or Latino
Place of birth - Born in state of residence (%) - American Indian and Alaska Native
Place of birth - Born in state of residence (%) - Multirace
Place of birth - Born in state of residence (%) - Other Race
Place of birth - Born in other state (%)
Place of birth - Born in other state (%) - White
Place of birth - Born in other state (%) - Black or African American
Place of birth - Born in other state (%) - Asian
Place of birth - Born in other state (%) - Hispanic or Latino
Place of birth - Born in other state (%) - American Indian and Alaska Native
Place of birth - Born in other state (%) - Multirace
Place of birth - Born in other state (%) - Other Race
Place of birth - Native, outside of US (%)
Place of birth - Native, outside of US (%) - White
Place of birth - Native, outside of US (%) - Black or African American
Place of birth - Native, outside of US (%) - Asian
Place of birth - Native, outside of US (%) - Hispanic or Latino
Place of birth - Native, outside of US (%) - American Indian and Alaska Native
Place of birth - Native, outside of US (%) - Multirace
Place of birth - Native, outside of US (%) - Other Race
Place of birth - Foreign born (%)
Place of birth - Foreign born (%) - White
Place of birth - Foreign born (%) - Black or African American
Place of birth - Foreign born (%) - Asian
Place of birth - Foreign born (%) - Hispanic or Latino
Place of birth - Foreign born (%) - American Indian and Alaska Native
Place of birth - Foreign born (%) - Multirace
Place of birth - Foreign born (%) - Other Race
Residents speaking English at home (%)
Residents speaking English at home - Born in the United States (%)
Residents speaking English at home - Native, born elsewhere (%)
Residents speaking English at home - Foreign born (%)
Residents speaking Spanish at home (%)
Residents speaking Spanish at home - Born in the United States (%)
Residents speaking Spanish at home - Native, born elsewhere (%)
Residents speaking Spanish at home - Foreign born (%)
Residents speaking other language at home (%)
Residents speaking other language at home - Born in the United States (%)
Residents speaking other language at home - Native, born elsewhere (%)
Residents speaking other language at home - Foreign born (%)
Marital status - Never married (%)
Marital status - Now married (%)
Marital status - Separated (%)
Marital status - Widowed (%)
Marital status - Divorced (%)
Ancestries Reported - Arab (%)
Ancestries Reported - Czech (%)
Ancestries Reported - Danish (%)
Ancestries Reported - Dutch (%)
Ancestries Reported - English (%)
Ancestries Reported - French (%)
Ancestries Reported - French Canadian (%)
Ancestries Reported - German (%)
Ancestries Reported - Greek (%)
Ancestries Reported - Hungarian (%)
Ancestries Reported - Irish (%)
Ancestries Reported - Italian (%)
Ancestries Reported - Lithuanian (%)
Ancestries Reported - Norwegian (%)
Ancestries Reported - Polish (%)
Ancestries Reported - Portuguese (%)
Ancestries Reported - Russian (%)
Ancestries Reported - Scotch-Irish (%)
Ancestries Reported - Scottish (%)
Ancestries Reported - Slovak (%)
Ancestries Reported - Subsaharan African (%)
Ancestries Reported - Swedish (%)
Ancestries Reported - Swiss (%)
Ancestries Reported - Ukrainian (%)
Ancestries Reported - United States (%)
Ancestries Reported - Welsh (%)
Ancestries Reported - West Indian (%)
Ancestries Reported - Other (%)
Geographical mobility - Same house 1 year ago (%)
Geographical mobility - Same house 1 year ago (%) - White
Geographical mobility - Same house 1 year ago (%) - Black or African American
Geographical mobility - Same house 1 year ago (%) - Asian
Geographical mobility - Same house 1 year ago (%) - Hispanic or Latino
Geographical mobility - Same house 1 year ago (%) - American Indian and Alaska Native
Geographical mobility - Same house 1 year ago (%) - Multirace
Geographical mobility - Same house 1 year ago (%) - Other Race
Geographical mobility - Moved within same county (%)
Geographical mobility - Moved within same county (%) - White
Geographical mobility - Moved within same county (%) - Black or African American
Geographical mobility - Moved within same county (%) - Asian
Geographical mobility - Moved within same county (%) - Hispanic or Latino
Geographical mobility - Moved within same county (%) - American Indian and Alaska Native
Geographical mobility - Moved within same county (%) - Multirace
Geographical mobility - Moved within same county (%) - Other Race
Geographical mobility - Moved from different county within same state (%)
Geographical mobility - Moved from different county within same state (%) - White
Geographical mobility - Moved from different county within same state (%) - Black or African American
Geographical mobility - Moved from different county within same state (%) - Asian
Geographical mobility - Moved from different county within same state (%) - Hispanic or Latino
Geographical mobility - Moved from different county within same state (%) - American Indian and Alaska Native
Geographical mobility - Moved from different county within same state (%) - Multirace
Geographical mobility - Moved from different county within same state (%) - Other Race
Geographical mobility - Moved from different state (%)
Geographical mobility - Moved from different state (%) - White
Geographical mobility - Moved from different state (%) - Black or African American
Geographical mobility - Moved from different state (%) - Asian
Geographical mobility - Moved from different state (%) - Hispanic or Latino
Geographical mobility - Moved from different state (%) - American Indian and Alaska Native
Geographical mobility - Moved from different state (%) - Multirace
Geographical mobility - Moved from different state (%) - Other Race
Geographical mobility - Moved from abroad (%)
Geographical mobility - Moved from abroad (%) - White
Geographical mobility - Moved from abroad (%) - Black or African American
Geographical mobility - Moved from abroad (%) - Asian
Geographical mobility - Moved from abroad (%) - Hispanic or Latino
Geographical mobility - Moved from abroad (%) - American Indian and Alaska Native
Geographical mobility - Moved from abroad (%) - Multirace
Geographical mobility - Moved from abroad (%) - Other Race
Place of birth for the foreign-born population - Ireland (%)
Place of birth for the foreign-born population - Denmark (%)
Place of birth for the foreign-born population - Norway (%)
Place of birth for the foreign-born population - Sweden (%)
Place of birth for the foreign-born population - United Kingdom (%)
Place of birth for the foreign-born population - England (%)
Place of birth for the foreign-born population - Scotland (%)
Place of birth for the foreign-born population - Other Northern Europe (%)
Place of birth for the foreign-born population - Austria (%)
Place of birth for the foreign-born population - Belgium (%)
Place of birth for the foreign-born population - France (%)
Place of birth for the foreign-born population - Germany (%)
Place of birth for the foreign-born population - Netherlands (%)
Place of birth for the foreign-born population - Switzerland (%)
Place of birth for the foreign-born population - Other Western Europe (%)
Place of birth for the foreign-born population - Greece (%)
Place of birth for the foreign-born population - Italy (%)
Place of birth for the foreign-born population - Portugal (%)
Place of birth for the foreign-born population - Spain (%)
Place of birth for the foreign-born population - Other Southern Europe (%)
Place of birth for the foreign-born population - Albania (%)
Place of birth for the foreign-born population - Belarus (%)
Place of birth for the foreign-born population - Bosnia and Herzegovina (%)
Place of birth for the foreign-born population - Bulgaria (%)
Place of birth for the foreign-born population - Croatia (%)
Place of birth for the foreign-born population - Czechoslovakia (%)
Place of birth for the foreign-born population - Hungary (%)
Place of birth for the foreign-born population - Latvia (%)
Place of birth for the foreign-born population - Lithuania (%)
Place of birth for the foreign-born population - North Macedonia (Macedonia) (%)
Place of birth for the foreign-born population - Moldova (%)
Place of birth for the foreign-born population - Poland (%)
Place of birth for the foreign-born population - Romania (%)
Place of birth for the foreign-born population - Russia (%)
Place of birth for the foreign-born population - Serbia (%)
Place of birth for the foreign-born population - Ukraine (%)
Place of birth for the foreign-born population - Other Eastern Europe (%)
Place of birth for the foreign-born population - China (%)
Place of birth for the foreign-born population - Hong Kong (%)
Place of birth for the foreign-born population - Taiwan (%)
Place of birth for the foreign-born population - Japan (%)
Place of birth for the foreign-born population - Korea (%)
Place of birth for the foreign-born population - Other Eastern Asia (%)
Place of birth for the foreign-born population - Afghanistan (%)
Place of birth for the foreign-born population - Bangladesh (%)
Place of birth for the foreign-born population - India (%)
Place of birth for the foreign-born population - Iran (%)
Place of birth for the foreign-born population - Kazakhstan (%)
Place of birth for the foreign-born population - Nepal (%)
Place of birth for the foreign-born population - Pakistan (%)
Place of birth for the foreign-born population - Sri Lanka (%)
Place of birth for the foreign-born population - Uzbekistan (%)
Place of birth for the foreign-born population - Other South Central Asia (%)
Place of birth for the foreign-born population - Burma (%)
Place of birth for the foreign-born population - Cambodia (%)
Place of birth for the foreign-born population - Indonesia (%)
Place of birth for the foreign-born population - Laos (%)
Place of birth for the foreign-born population - Malaysia (%)
Place of birth for the foreign-born population - Philippines (%)
Place of birth for the foreign-born population - Singapore (%)
Place of birth for the foreign-born population - Thailand (%)
Place of birth for the foreign-born population - Vietnam (%)
Place of birth for the foreign-born population - Other South Eastern Asia (%)
Place of birth for the foreign-born population - Armenia (%)
Place of birth for the foreign-born population - Iraq (%)
Place of birth for the foreign-born population - Israel (%)
Place of birth for the foreign-born population - Jordan (%)
Place of birth for the foreign-born population - Kuwait (%)
Place of birth for the foreign-born population - Lebanon (%)
Place of birth for the foreign-born population - Saudi Arabia (%)
Place of birth for the foreign-born population - Syria (%)
Place of birth for the foreign-born population - Turkey (%)
Place of birth for the foreign-born population - Yemen (%)
Place of birth for the foreign-born population - Other Western Asia (%)
Place of birth for the foreign-born population - Eritrea (%)
Place of birth for the foreign-born population - Ethiopia (%)
Place of birth for the foreign-born population - Kenya (%)
Place of birth for the foreign-born population - Somalia (%)
Place of birth for the foreign-born population - Uganda (%)
Place of birth for the foreign-born population - Zimbabwe (%)
Place of birth for the foreign-born population - Other Eastern Africa (%)
Place of birth for the foreign-born population - Cameroon (%)
Place of birth for the foreign-born population - Congo (%)
Place of birth for the foreign-born population - Democratic Republic of Congo (Zaire) (%)
Place of birth for the foreign-born population - Other Middle Africa (%)
Place of birth for the foreign-born population - Egypt (%)
Place of birth for the foreign-born population - Morocco (%)
Place of birth for the foreign-born population - Sudan (%)
Place of birth for the foreign-born population - Other Northern Africa (%)
Place of birth for the foreign-born population - South Africa (%)
Place of birth for the foreign-born population - Other Southern Africa (%)
Place of birth for the foreign-born population - Cabo Verde (%)
Place of birth for the foreign-born population - Ghana (%)
Place of birth for the foreign-born population - Liberia (%)
Place of birth for the foreign-born population - Nigeria (%)
Place of birth for the foreign-born population - Senegal (%)
Place of birth for the foreign-born population - Sierra Leone (%)
Place of birth for the foreign-born population - Other Western Africa (%)
Place of birth for the foreign-born population - Australia (%)
Place of birth for the foreign-born population - New Zealand (%)
Place of birth for the foreign-born population - Fiji (%)
Place of birth for the foreign-born population - Micronesia (%)
Place of birth for the foreign-born population - Bahamas (%)
Place of birth for the foreign-born population - Barbados (%)
Place of birth for the foreign-born population - Cuba (%)
Place of birth for the foreign-born population - Dominica (%)
Place of birth for the foreign-born population - Dominican Republic (%)
Place of birth for the foreign-born population - Grenada (%)
Place of birth for the foreign-born population - Haiti (%)
Place of birth for the foreign-born population - Jamaica (%)
Place of birth for the foreign-born population - St. Vincent and the Grenadines (%)
Place of birth for the foreign-born population - Trinidad and Tobago (%)
Place of birth for the foreign-born population - West Indies (%)
Place of birth for the foreign-born population - Other Caribbean (%)
Place of birth for the foreign-born population - Belize (%)
Place of birth for the foreign-born population - Costa Rica (%)
Place of birth for the foreign-born population - El Salvador (%)
Place of birth for the foreign-born population - Guatemala (%)
Place of birth for the foreign-born population - Honduras (%)
Place of birth for the foreign-born population - Mexico (%)
Place of birth for the foreign-born population - Nicaragua (%)
Place of birth for the foreign-born population - Panama (%)
Place of birth for the foreign-born population - Other Central America (%)
Place of birth for the foreign-born population - Argentina (%)
Place of birth for the foreign-born population - Bolivia (%)
Place of birth for the foreign-born population - Brazil (%)
Place of birth for the foreign-born population - Chile (%)
Place of birth for the foreign-born population - Colombia (%)
Place of birth for the foreign-born population - Ecuador (%)
Place of birth for the foreign-born population - Guyana (%)
Place of birth for the foreign-born population - Peru (%)
Place of birth for the foreign-born population - Uruguay (%)
Place of birth for the foreign-born population - Venezuela (%)
Place of birth for the foreign-born population - Other South America (%)
Place of birth for the foreign-born population - Canada (%)
Place of birth for the foreign-born population - Other Northern America (%)
Place of birth for the foreign-born population - Other (%)
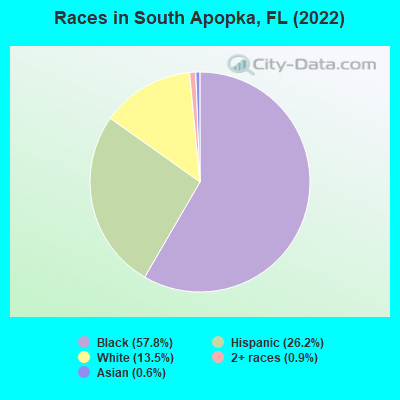
According to 2022 data, the most numerous races in South Apopka, FL are White alone (1,053 residents), Hispanic (2,044 residents), and Black alone (4,499 residents). 77.5% of South Apopka residents speak English at home. 18.3% of South Apopka, FL residents are foreign-born (15.7% born in Latin America), which is 14.5% less than the foreign-born rate of 21.0% across the entire state of Florida.
Race distribution in South Apopka
2000 2022
10,458,509 65.4% White alone 2,682,715 16.8% Hispanic 2,264,268 14.2% Black alone 261,693 1.6% Asian alone 236,954 1.5% Two or more races 42,358 0.3% American Indian alone 28,994 0.2% Other race alone 6,887 0.04% Native Hawaiian and Other
11,309,403 50.8% White alone 6,025,039 27.1% Hispanic 3,241,015 14.6% Black alone 861,630 3.9% Two or more races 623,692 2.8% Asian alone 152,054 0.7% Other race alone 22,504 0.1% American Indian alone 9,486 0.04% Native Hawaiian and Other
Income and house value in South Apopka Median household income in 2022 $63,029 White non-Hispanic householders$45,399 Black householders$26,901 Two or more races householders$33,848 Hispanic or Latino race householdersMedian 2022 house value $284,419 White Non-Hispanic householders$258,788 Black or African American householders$232,744 Some other race householders$241,012 Hispanic or Latino householders
Median age by race in South Apopka
51.7 Median age for White residents46.8 58.6 32.6 Median age for Black or African American residents30.9 34.6 -614,300,100.1 Median age for American Indian / Alaska Native residents-735,632,183.2 -529,680,364.8 -690,415,605.8 Median age for Asian residents-661,458,332.7 -704,904,404.9 -679,790,025.6 Median age for Native Hawaiian / Pacific Islander residents-1,327,635,326.3 -611,111,110.5 29.7 Median age for Other race residents29.8 44.4 34.2 Median age for Two or more races residents33.0 35.5 73.1 Median age for White alone residents67.4 74.7 31.5 Median age for Hispanic or Latino residents30.1 34.6
Owner/renter occupied households by race in South Apopka
House owners and renters - White residents 575 92.4% Owner occupied47 7.6% Renter occupiedHouse owners and renters - Black or African American residents 945 62.3% Owner occupied572 37.7% Renter occupiedHouse owners and renters - Asian residents 18 100.0% Owner occupiedHouse owners and renters - Other race residents 72 38.8% Owner occupied113 61.2% Renter occupiedHouse owners and renters - Two or more races residents 180 41.0% Owner occupied259 59.0% Renter occupiedHouse owners and renters - White alone residents 480 93.3% Owner occupied35 6.7% Renter occupiedHouse owners and renters - Hispanic or Latino residents 355 58.2% Owner occupied255 41.8% Renter occupied
Language usage in South Apopka
English speakers - Total 77.5% of residents of South Apopka speak English at home.
21.3% of residents speak Spanish at home 796 53.4% Speak English very well695 46.6% Speak English less than very well0.5% of residents speak other language at home 17 50.0% Speak English very well17 50.0% Speak English less than very well
English speakers - Born in the United States 95.7% of residents of South Apopka speak English at home.
4.4% of residents speak Spanish at home 47 65.3% Speak English very well25 34.7% Speak English less than very well
English speakers - Native, born elsewhere 11.3% of residents of South Apopka speak English at home.
81.2% of residents speak Spanish at home 41 38.0% Speak English very well67 62.0% Speak English less than very well
English speakers - Foreign-born 34.8% of residents of South Apopka speak English at home.
62.6% of residents speak Spanish at home 335 36.9% Speak English very well573 63.1% Speak English less than very well2.3% of residents speak other language at home 16 48.5% Speak English very well17 51.5% Speak English less than very well
White (Caucasian) - Speak only English Native:
85.2% (1,049)Foreign-born:
9.4% (25)
White (Caucasian) - Speak another language Native:
12.4% (153)Foreign-born:
88.6% (233)
Black or African American - Speak only English Native:
98.0% (3,559)Foreign-born:
100.0% (349)
Black or African American - Speak another language Native:
0.6% (23)Foreign-born:
4.5% (16)
Other race - Speak only English Native:
12.3% (24)Foreign-born:
27.6% (66)
Other race - Speak another language Native:
85.1% (169)Foreign-born:
64.3% (153)
Two or more races - Speak only English Native:
28.8% (105)Foreign-born:
7.3% (42)
Two or more races - Speak another language Native:
72.4% (263)Foreign-born:
92.8% (528)
White alone - Speak only English Native:
97.0% (971)Foreign-born:
42.9% (11)
White alone - Speak another language Native:
3.1% (31)Foreign-born:
51.5% (13)
Hispanic or Latino - Speak only English Native:
27.5% (226)Foreign-born:
11.8% (120)
Hispanic or Latino - Speak another language Native:
70.9% (582)Foreign-born:
87.3% (893)
Foreign-born residents in South Apopka 1,428 residents are foreign born (15.7% Latin America ).
This city:
18.3%Florida:
21.1%
Marital status for residents in South Apopka Marital status - White (Caucasian) population 15 years and over
Males 20.9% Never married65.5% Now married8.2% Separated0.0% Widowed5.4% DivorcedFemales 28.1% Never married41.9% Now married5.3% Separated19.7% Widowed5.1% DivorcedWomen who gave birth in the past 12 months Now married:
27.3% (10)Unmarried:
72.7% (26)
Women who did not give birth in the past 12 months Now married:
10.6% (26)Unmarried:
89.4% (219)
Marital status - Black or African American population 15 years and over
Males 59.7% Never married23.1% Now married1.9% Separated7.0% Widowed8.2% DivorcedFemales 56.0% Never married19.3% Now married6.6% Separated9.2% Widowed8.9% DivorcedWomen who gave birth in the past 12 months Now married:
100.0% (17)Unmarried:
0.0% (0)
Women who did not give birth in the past 12 months Now married:
13.8% (116)Unmarried:
86.2% (727)
Marital status - Other race population 15 years and over
Males 48.7% Never married48.7% Now married2.7% Separated0.0% Widowed0.0% DivorcedFemales 0.0% Never married100.0% Now married0.0% Separated0.0% Widowed0.0% DivorcedWomen who did not give birth in the past 12 months Now married:
100.0% (44)Unmarried:
0.0% (0)
Marital status - Two or more races population 15 years and over
Males 31.0% Never married56.2% Now married0.0% Separated0.0% Widowed12.8% DivorcedFemales 0.0% Never married47.9% Now married0.0% Separated25.7% Widowed26.4% DivorcedWomen who did not give birth in the past 12 months Now married:
51.7% (107)Unmarried:
48.3% (100)
Marital status - White alone, not Hispanic / Latino population 15 years and over
Males 16.4% Never married64.8% Now married11.4% Separated0.0% Widowed7.4% DivorcedFemales 6.6% Never married58.4% Now married5.9% Separated22.9% Widowed6.2% DivorcedWomen who gave birth in the past 12 months Now married:
0.0% (0)Unmarried:
100.0% (13)
Women who did not give birth in the past 12 months Now married:
36.7% (17)Unmarried:
63.3% (30)
Marital status - Hispanic or Latino population 15 years and over
Males 39.4% Never married55.2% Now married0.9% Separated0.0% Widowed4.5% DivorcedFemales 35.7% Never married35.2% Now married2.7% Separated14.9% Widowed11.5% DivorcedWomen who gave birth in the past 12 months Now married:
40.0% (12)Unmarried:
60.0% (18)
Women who did not give birth in the past 12 months Now married:
21.0% (95)Unmarried:
79.0% (358)
Ancestries in South Apopka
2,127 32.7% American1,028 15.8% African165 2.5% British West Indian72 1.1% West Indian60 0.9% European40 0.6% Jamaican29 0.4% Irish23 0.4% English19 0.3% German17 0.3% Italian12 0.2% Portuguese9 0.1% Brazilian
Children Nativity (place of birth) in South Apopka
Children under 6 years - Living with two parents Both parents native 112 100.0% NativeBoth parents foreign-born 87 100.0% NativeOne native, one foreign-born parent 63 100.0% NativeChildren under 6 years - Living with one parent Native parent 531 100.0% NativeChildren 6 to 17 years - Living with two parents Both parents native 100 100.0% NativeBoth parents foreign-born 121 100.0% NativeOne native, one foreign-born parent 149 100.0% NativeChildren 6 to 17 years - Living with one parent Native parent 701 100.0% NativeForeign-born parent 142 49.1% Native147 50.9% Foreign-born
Grandparents responsible for own grandchildren in South Apopka
Grandparents (30 to 59 years) White / Caucasian 13 34.6% Responsible for grandchildren24 65.4% Not responsible for grandchildrenBlack or African American 63 100.0% Not responsible for grandchildrenHispanic or Latino 24 21.9% Responsible for grandchildren85 78.1% Not responsible for grandchildrenGrandparents (60 years and over) White / Caucasian 18 35.4% Responsible for grandchildren33 64.6% Not responsible for grandchildrenBlack or African American 40 44.3% Responsible for grandchildren51 55.7% Not responsible for grandchildrenHispanic or Latino 54 100.0% Not responsible for grandchildren