Races in South Siuslaw, Oregon (OR) Detailed Stats
Ancestries, Foreign-born residents, place of birth
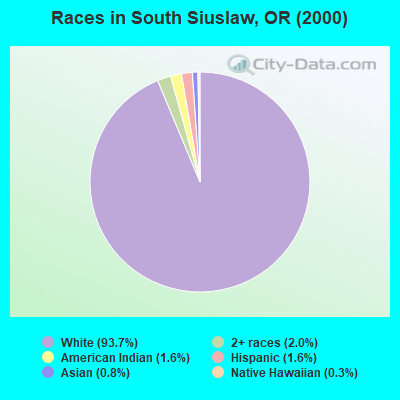
Race distribution in South Siuslaw

- 2,24393.7%White alone
- 482.0%Two or more races
- 381.6%Hispanic
- 381.6%American Indian alone
- 180.8%Asian alone
- 80.3%Native Hawaiian and Other
Pacific Islander alone - 20.08%Black alone
2000
2022
-
- 2,857,61683.5%White alone
- 275,3148.0%Hispanic
- 100,3332.9%Asian alone
- 82,7332.4%Two or more races
- 53,3251.6%Black alone
- 40,1301.2%American Indian alone
- 7,3980.2%Native Hawaiian and Other
Pacific Islander alone - 4,5500.1%Other race alone

-
- 3,037,57171.6%White alone
- 609,53814.4%Hispanic
- 252,7446.0%Two or more races
- 191,2834.5%Asian alone
- 78,2281.8%Black alone
- 29,3990.7%American Indian alone
- 25,7310.6%Other race alone
- 15,6430.4%Native Hawaiian and Other
Pacific Islander alone

Income and house value in South Siuslaw
- Median household income in 2022
- $59,685White non-Hispanic householders
- $102,245American Indian and Alaska Native householders
- $84,099Asian householders
- $57,450Two or more races householders
- $57,590Hispanic or Latino race householders
- Median 2022 house value
- $523,310White Non-Hispanic householders
- $448,369American Indian or Alaska Native householders
- over $1,000,000Asian householders
- $464,951Two or more races householders
- $677,656Hispanic or Latino householders
Household income for White non-Hispanic householders

Household income for American Indian and Alaska Native householders

Household income for Asian householders

Household income for Two or more races householders

Household income for Hispanic or Latino race householders

Zip code: 97439