Races in South Toole, Montana (MT) Detailed Stats
Ancestries, Foreign-born residents, place of birth
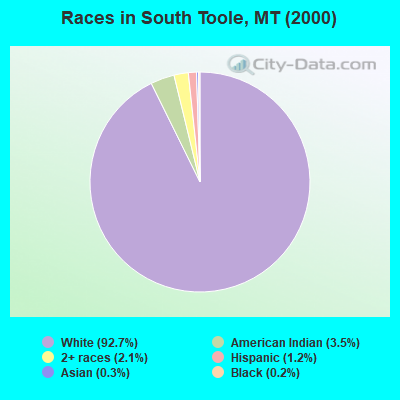
Race distribution in South Toole

- 3,59292.7%White alone
- 1343.5%American Indian alone
- 812.1%Two or more races
- 461.2%Hispanic
- 130.3%Asian alone
- 80.2%Black alone
2000
2022
-
- 807,82389.5%White alone
- 54,4266.0%American Indian alone
- 18,0812.0%Hispanic
- 13,7681.5%Two or more races
- 4,5690.5%Asian alone
- 2,5340.3%Black alone
- 5690.06%Other race alone
- 4250.05%Native Hawaiian and Other
Pacific Islander alone

-
- 937,36583.5%White alone
- 58,7485.2%American Indian alone
- 55,1724.9%Two or more races
- 49,8304.4%Hispanic
- 9,0120.8%Other race alone
- 7,7000.7%Asian alone
- 3,4280.3%Black alone
- 1,6120.1%Native Hawaiian and Other
Pacific Islander alone

Income and house value in South Toole
- Median household income in 2022
- $63,029White non-Hispanic householders
- $93,673American Indian and Alaska Native householders
- $14,597Asian householders
- $45,204Two or more races householders
- $10,348Hispanic or Latino race householders
- Median 2022 house value
- $219,322White Non-Hispanic householders
- $167,677American Indian or Alaska Native householders
- $33,532Two or more races householders
- $461,112Hispanic or Latino householders
Household income for White non-Hispanic householders

Household income for American Indian and Alaska Native householders

Household income for Asian householders

Household income for Two or more races householders

Household income for Hispanic or Latino race householders

Zip code: 59474