Races in Southbridge Town, Massachusetts (MA) Detailed Stats
Data:
Races - White alone (%)
Races - White alone (% change since 2000)
Races - Black alone (%)
Races - Black alone (% change since 2000)
Races - American Indian alone (%)
Races - American Indian alone (% change since 2000)
Races - Asian alone (%)
Races - Asian alone (% change since 2000)
Races - Hispanic (%)
Races - Hispanic (% change since 2000)
Races - Native Hawaiian and Other Pacific Islander alone (%)
Races - Native Hawaiian and Other Pacific Islander alone (% change since 2000)
Races - Two or more races(%)
Races - Two or more races(% change since 2000)
Races - Other race alone (%)
Races - Other race alone (% change since 2000)
Racial diversity
Place of birth - Born in state of residence (%)
Place of birth - Born in state of residence (%) - White
Place of birth - Born in state of residence (%) - Black or African American
Place of birth - Born in state of residence (%) - Asian
Place of birth - Born in state of residence (%) - Hispanic or Latino
Place of birth - Born in state of residence (%) - American Indian and Alaska Native
Place of birth - Born in state of residence (%) - Multirace
Place of birth - Born in state of residence (%) - Other Race
Place of birth - Born in other state (%)
Place of birth - Born in other state (%) - White
Place of birth - Born in other state (%) - Black or African American
Place of birth - Born in other state (%) - Asian
Place of birth - Born in other state (%) - Hispanic or Latino
Place of birth - Born in other state (%) - American Indian and Alaska Native
Place of birth - Born in other state (%) - Multirace
Place of birth - Born in other state (%) - Other Race
Place of birth - Native, outside of US (%)
Place of birth - Native, outside of US (%) - White
Place of birth - Native, outside of US (%) - Black or African American
Place of birth - Native, outside of US (%) - Asian
Place of birth - Native, outside of US (%) - Hispanic or Latino
Place of birth - Native, outside of US (%) - American Indian and Alaska Native
Place of birth - Native, outside of US (%) - Multirace
Place of birth - Native, outside of US (%) - Other Race
Place of birth - Foreign born (%)
Place of birth - Foreign born (%) - White
Place of birth - Foreign born (%) - Black or African American
Place of birth - Foreign born (%) - Asian
Place of birth - Foreign born (%) - Hispanic or Latino
Place of birth - Foreign born (%) - American Indian and Alaska Native
Place of birth - Foreign born (%) - Multirace
Place of birth - Foreign born (%) - Other Race
Residents speaking English at home (%)
Residents speaking English at home - Born in the United States (%)
Residents speaking English at home - Native, born elsewhere (%)
Residents speaking English at home - Foreign born (%)
Residents speaking Spanish at home (%)
Residents speaking Spanish at home - Born in the United States (%)
Residents speaking Spanish at home - Native, born elsewhere (%)
Residents speaking Spanish at home - Foreign born (%)
Residents speaking other language at home (%)
Residents speaking other language at home - Born in the United States (%)
Residents speaking other language at home - Native, born elsewhere (%)
Residents speaking other language at home - Foreign born (%)
Marital status - Never married (%)
Marital status - Now married (%)
Marital status - Separated (%)
Marital status - Widowed (%)
Marital status - Divorced (%)
Ancestries Reported - Arab (%)
Ancestries Reported - Czech (%)
Ancestries Reported - Danish (%)
Ancestries Reported - Dutch (%)
Ancestries Reported - English (%)
Ancestries Reported - French (%)
Ancestries Reported - French Canadian (%)
Ancestries Reported - German (%)
Ancestries Reported - Greek (%)
Ancestries Reported - Hungarian (%)
Ancestries Reported - Irish (%)
Ancestries Reported - Italian (%)
Ancestries Reported - Lithuanian (%)
Ancestries Reported - Norwegian (%)
Ancestries Reported - Polish (%)
Ancestries Reported - Portuguese (%)
Ancestries Reported - Russian (%)
Ancestries Reported - Scotch-Irish (%)
Ancestries Reported - Scottish (%)
Ancestries Reported - Slovak (%)
Ancestries Reported - Subsaharan African (%)
Ancestries Reported - Swedish (%)
Ancestries Reported - Swiss (%)
Ancestries Reported - Ukrainian (%)
Ancestries Reported - United States (%)
Ancestries Reported - Welsh (%)
Ancestries Reported - West Indian (%)
Ancestries Reported - Other (%)
Geographical mobility - Same house 1 year ago (%)
Geographical mobility - Same house 1 year ago (%) - White
Geographical mobility - Same house 1 year ago (%) - Black or African American
Geographical mobility - Same house 1 year ago (%) - Asian
Geographical mobility - Same house 1 year ago (%) - Hispanic or Latino
Geographical mobility - Same house 1 year ago (%) - American Indian and Alaska Native
Geographical mobility - Same house 1 year ago (%) - Multirace
Geographical mobility - Same house 1 year ago (%) - Other Race
Geographical mobility - Moved within same county (%)
Geographical mobility - Moved within same county (%) - White
Geographical mobility - Moved within same county (%) - Black or African American
Geographical mobility - Moved within same county (%) - Asian
Geographical mobility - Moved within same county (%) - Hispanic or Latino
Geographical mobility - Moved within same county (%) - American Indian and Alaska Native
Geographical mobility - Moved within same county (%) - Multirace
Geographical mobility - Moved within same county (%) - Other Race
Geographical mobility - Moved from different county within same state (%)
Geographical mobility - Moved from different county within same state (%) - White
Geographical mobility - Moved from different county within same state (%) - Black or African American
Geographical mobility - Moved from different county within same state (%) - Asian
Geographical mobility - Moved from different county within same state (%) - Hispanic or Latino
Geographical mobility - Moved from different county within same state (%) - American Indian and Alaska Native
Geographical mobility - Moved from different county within same state (%) - Multirace
Geographical mobility - Moved from different county within same state (%) - Other Race
Geographical mobility - Moved from different state (%)
Geographical mobility - Moved from different state (%) - White
Geographical mobility - Moved from different state (%) - Black or African American
Geographical mobility - Moved from different state (%) - Asian
Geographical mobility - Moved from different state (%) - Hispanic or Latino
Geographical mobility - Moved from different state (%) - American Indian and Alaska Native
Geographical mobility - Moved from different state (%) - Multirace
Geographical mobility - Moved from different state (%) - Other Race
Geographical mobility - Moved from abroad (%)
Geographical mobility - Moved from abroad (%) - White
Geographical mobility - Moved from abroad (%) - Black or African American
Geographical mobility - Moved from abroad (%) - Asian
Geographical mobility - Moved from abroad (%) - Hispanic or Latino
Geographical mobility - Moved from abroad (%) - American Indian and Alaska Native
Geographical mobility - Moved from abroad (%) - Multirace
Geographical mobility - Moved from abroad (%) - Other Race
Place of birth for the foreign-born population - Ireland (%)
Place of birth for the foreign-born population - Denmark (%)
Place of birth for the foreign-born population - Norway (%)
Place of birth for the foreign-born population - Sweden (%)
Place of birth for the foreign-born population - United Kingdom (%)
Place of birth for the foreign-born population - England (%)
Place of birth for the foreign-born population - Scotland (%)
Place of birth for the foreign-born population - Other Northern Europe (%)
Place of birth for the foreign-born population - Austria (%)
Place of birth for the foreign-born population - Belgium (%)
Place of birth for the foreign-born population - France (%)
Place of birth for the foreign-born population - Germany (%)
Place of birth for the foreign-born population - Netherlands (%)
Place of birth for the foreign-born population - Switzerland (%)
Place of birth for the foreign-born population - Other Western Europe (%)
Place of birth for the foreign-born population - Greece (%)
Place of birth for the foreign-born population - Italy (%)
Place of birth for the foreign-born population - Portugal (%)
Place of birth for the foreign-born population - Spain (%)
Place of birth for the foreign-born population - Other Southern Europe (%)
Place of birth for the foreign-born population - Albania (%)
Place of birth for the foreign-born population - Belarus (%)
Place of birth for the foreign-born population - Bosnia and Herzegovina (%)
Place of birth for the foreign-born population - Bulgaria (%)
Place of birth for the foreign-born population - Croatia (%)
Place of birth for the foreign-born population - Czechoslovakia (%)
Place of birth for the foreign-born population - Hungary (%)
Place of birth for the foreign-born population - Latvia (%)
Place of birth for the foreign-born population - Lithuania (%)
Place of birth for the foreign-born population - North Macedonia (Macedonia) (%)
Place of birth for the foreign-born population - Moldova (%)
Place of birth for the foreign-born population - Poland (%)
Place of birth for the foreign-born population - Romania (%)
Place of birth for the foreign-born population - Russia (%)
Place of birth for the foreign-born population - Serbia (%)
Place of birth for the foreign-born population - Ukraine (%)
Place of birth for the foreign-born population - Other Eastern Europe (%)
Place of birth for the foreign-born population - China (%)
Place of birth for the foreign-born population - Hong Kong (%)
Place of birth for the foreign-born population - Taiwan (%)
Place of birth for the foreign-born population - Japan (%)
Place of birth for the foreign-born population - Korea (%)
Place of birth for the foreign-born population - Other Eastern Asia (%)
Place of birth for the foreign-born population - Afghanistan (%)
Place of birth for the foreign-born population - Bangladesh (%)
Place of birth for the foreign-born population - India (%)
Place of birth for the foreign-born population - Iran (%)
Place of birth for the foreign-born population - Kazakhstan (%)
Place of birth for the foreign-born population - Nepal (%)
Place of birth for the foreign-born population - Pakistan (%)
Place of birth for the foreign-born population - Sri Lanka (%)
Place of birth for the foreign-born population - Uzbekistan (%)
Place of birth for the foreign-born population - Other South Central Asia (%)
Place of birth for the foreign-born population - Burma (%)
Place of birth for the foreign-born population - Cambodia (%)
Place of birth for the foreign-born population - Indonesia (%)
Place of birth for the foreign-born population - Laos (%)
Place of birth for the foreign-born population - Malaysia (%)
Place of birth for the foreign-born population - Philippines (%)
Place of birth for the foreign-born population - Singapore (%)
Place of birth for the foreign-born population - Thailand (%)
Place of birth for the foreign-born population - Vietnam (%)
Place of birth for the foreign-born population - Other South Eastern Asia (%)
Place of birth for the foreign-born population - Armenia (%)
Place of birth for the foreign-born population - Iraq (%)
Place of birth for the foreign-born population - Israel (%)
Place of birth for the foreign-born population - Jordan (%)
Place of birth for the foreign-born population - Kuwait (%)
Place of birth for the foreign-born population - Lebanon (%)
Place of birth for the foreign-born population - Saudi Arabia (%)
Place of birth for the foreign-born population - Syria (%)
Place of birth for the foreign-born population - Turkey (%)
Place of birth for the foreign-born population - Yemen (%)
Place of birth for the foreign-born population - Other Western Asia (%)
Place of birth for the foreign-born population - Eritrea (%)
Place of birth for the foreign-born population - Ethiopia (%)
Place of birth for the foreign-born population - Kenya (%)
Place of birth for the foreign-born population - Somalia (%)
Place of birth for the foreign-born population - Uganda (%)
Place of birth for the foreign-born population - Zimbabwe (%)
Place of birth for the foreign-born population - Other Eastern Africa (%)
Place of birth for the foreign-born population - Cameroon (%)
Place of birth for the foreign-born population - Congo (%)
Place of birth for the foreign-born population - Democratic Republic of Congo (Zaire) (%)
Place of birth for the foreign-born population - Other Middle Africa (%)
Place of birth for the foreign-born population - Egypt (%)
Place of birth for the foreign-born population - Morocco (%)
Place of birth for the foreign-born population - Sudan (%)
Place of birth for the foreign-born population - Other Northern Africa (%)
Place of birth for the foreign-born population - South Africa (%)
Place of birth for the foreign-born population - Other Southern Africa (%)
Place of birth for the foreign-born population - Cabo Verde (%)
Place of birth for the foreign-born population - Ghana (%)
Place of birth for the foreign-born population - Liberia (%)
Place of birth for the foreign-born population - Nigeria (%)
Place of birth for the foreign-born population - Senegal (%)
Place of birth for the foreign-born population - Sierra Leone (%)
Place of birth for the foreign-born population - Other Western Africa (%)
Place of birth for the foreign-born population - Australia (%)
Place of birth for the foreign-born population - New Zealand (%)
Place of birth for the foreign-born population - Fiji (%)
Place of birth for the foreign-born population - Micronesia (%)
Place of birth for the foreign-born population - Bahamas (%)
Place of birth for the foreign-born population - Barbados (%)
Place of birth for the foreign-born population - Cuba (%)
Place of birth for the foreign-born population - Dominica (%)
Place of birth for the foreign-born population - Dominican Republic (%)
Place of birth for the foreign-born population - Grenada (%)
Place of birth for the foreign-born population - Haiti (%)
Place of birth for the foreign-born population - Jamaica (%)
Place of birth for the foreign-born population - St. Vincent and the Grenadines (%)
Place of birth for the foreign-born population - Trinidad and Tobago (%)
Place of birth for the foreign-born population - West Indies (%)
Place of birth for the foreign-born population - Other Caribbean (%)
Place of birth for the foreign-born population - Belize (%)
Place of birth for the foreign-born population - Costa Rica (%)
Place of birth for the foreign-born population - El Salvador (%)
Place of birth for the foreign-born population - Guatemala (%)
Place of birth for the foreign-born population - Honduras (%)
Place of birth for the foreign-born population - Mexico (%)
Place of birth for the foreign-born population - Nicaragua (%)
Place of birth for the foreign-born population - Panama (%)
Place of birth for the foreign-born population - Other Central America (%)
Place of birth for the foreign-born population - Argentina (%)
Place of birth for the foreign-born population - Bolivia (%)
Place of birth for the foreign-born population - Brazil (%)
Place of birth for the foreign-born population - Chile (%)
Place of birth for the foreign-born population - Colombia (%)
Place of birth for the foreign-born population - Ecuador (%)
Place of birth for the foreign-born population - Guyana (%)
Place of birth for the foreign-born population - Peru (%)
Place of birth for the foreign-born population - Uruguay (%)
Place of birth for the foreign-born population - Venezuela (%)
Place of birth for the foreign-born population - Other South America (%)
Place of birth for the foreign-born population - Canada (%)
Place of birth for the foreign-born population - Other Northern America (%)
Place of birth for the foreign-born population - Other (%)
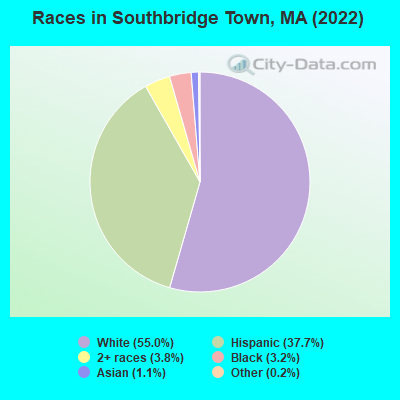
According to 2022 data, the most numerous races in Southbridge Town, MA are White alone (9,764 residents), Hispanic (6,698 residents), and Asian alone (198 residents). 65.5% of Southbridge Town residents speak English at home.
Race distribution in Southbridge Town 9,764 55.0% White alone 6,698 37.7% Hispanic 676 3.8% Two or more races 569 3.2% Black alone 198 1.1% Asian alone 41 0.2% Other race alone 13 0.07% American Indian alone
2000 2022
5,198,359 81.9% White alone 428,729 6.8% Hispanic 318,329 5.0% Black alone 236,786 3.7% Asian alone 110,338 1.7% Two or more races 43,586 0.7% Other race alone 11,264 0.2% American Indian alone 1,706 0.03% Native Hawaiian and Other
4,676,627 67.0% White alone 911,038 13.0% Hispanic 501,463 7.2% Asian alone 459,740 6.6% Black alone 341,889 4.9% Two or more races 84,403 1.2% Other race alone 5,838 0.08% American Indian alone 976 0.01% Native Hawaiian and Other
Income and house value in Southbridge Town Median household income in 2022 $60,007 White non-Hispanic householders$37,758 Black householders$80,001 Asian householders$64,219 Some other race householders$35,732 Two or more races householders$41,211 Hispanic or Latino race householders
Median age by race in Southbridge Town
46.3 Median age for White residents48.3 45.2 29.0 Median age for Black or African American residents30.5 29.3 31.4 Median age for American Indian / Alaska Native residents-649,474,688.9 27.1 41.8 Median age for Asian residents49.9 36.4 -601,918,464.6 Median age for Native Hawaiian / Pacific Islander residents-513,131,312.6 -508,717,948.2 30.3 Median age for Other race residents21.6 35.5 26.8 Median age for Two or more races residents25.9 29.1 49.0 Median age for White alone residents50.5 48.2 28.1 Median age for Hispanic or Latino residents23.8 32.3
Owner/renter occupied households by race in Southbridge Town
House owners and renters - White residents 2,642 49.0% Owner occupied2,755 51.0% Renter occupiedHouse owners and renters - Black or African American residents 12 3.5% Owner occupied319 96.5% Renter occupiedHouse owners and renters - American Indian / Alaska Native residents 68 100.0% Renter occupiedHouse owners and renters - Asian residents 43 60.9% Owner occupied28 39.1% Renter occupiedHouse owners and renters - Other race residents 176 31.7% Owner occupied381 68.3% Renter occupiedHouse owners and renters - Two or more races residents 190 17.9% Owner occupied872 82.1% Renter occupiedHouse owners and renters - White alone residents 2,461 51.9% Owner occupied2,278 48.1% Renter occupiedHouse owners and renters - Hispanic or Latino residents 469 21.5% Owner occupied1,715 78.5% Renter occupied
Language usage in Southbridge Town
English speakers - Total 65.5% of residents of Southbridge Town speak English at home.
30.4% of residents speak Spanish at home 2,491 49.2% Speak English very well2,572 50.8% Speak English less than very well4.7% of residents speak other language at home 588 74.8% Speak English very well198 25.2% Speak English less than very well
English speakers - Born in the United States 72.5% of residents of Southbridge Town speak English at home.
26.4% of residents speak Spanish at home 309 49.5% Speak English very well315 50.5% Speak English less than very well2.5% of residents speak other language at home 59 100.0% Speak English very well
English speakers - Native, born elsewhere 4.4% of residents of Southbridge Town speak English at home.
98.0% of residents speak Spanish at home 823 30.7% Speak English very well1,854 69.3% Speak English less than very well
English speakers - Foreign-born 7.9% of residents of Southbridge Town speak English at home.
31.3% of residents speak Spanish at home 161 65.4% Speak English very well85 34.6% Speak English less than very well61.7% of residents speak other language at home 293 60.5% Speak English very well191 39.5% Speak English less than very well
White (Caucasian) - Speak only English Native:
85.4% (9,283)Foreign-born:
11.4% (31)
White (Caucasian) - Speak another language Native:
11.7% (1,276)Foreign-born:
89.6% (240)
Black or African American - Speak another language Native:
25.3% (169)Foreign-born:
100.0% (161)
Asian - Speak only English Native:
16.2% (12)Foreign-born:
8.6% (12)
Asian - Speak another language Native:
85.8% (64)Foreign-born:
91.7% (123)
Other race - Speak another language Native:
91.3% (1,443)Foreign-born:
95.7% (47)
Two or more races - Speak only English Native:
31.5% (985)Foreign-born:
13.8% (20)
Two or more races - Speak another language Native:
72.0% (2,249)Foreign-born:
83.6% (119)
White alone - Speak only English Native:
95.9% (8,839)Foreign-born:
16.9% (31)
White alone - Speak another language Native:
4.0% (373)Foreign-born:
84.3% (155)
Hispanic or Latino - Speak only English Native:
20.6% (1,136)Foreign-born:
7.0% (21)
Hispanic or Latino - Speak another language Native:
79.7% (4,404)Foreign-born:
92.8% (277)
Foreign-born residents in Southbridge Town
Marital status for residents in Southbridge Town Marital status - White (Caucasian) population 15 years and over
Males 39.8% Never married36.2% Now married2.3% Separated4.1% Widowed17.6% DivorcedFemales 35.9% Never married36.1% Now married1.8% Separated8.4% Widowed17.9% DivorcedWomen who gave birth in the past 12 months Now married:
36.3% (80)Unmarried:
63.7% (140)
Women who did not give birth in the past 12 months Now married:
29.1% (692)Unmarried:
70.9% (1,682)
Marital status - Black or African American population 15 years and over
Males 55.8% Never married39.9% Now married2.2% Separated0.0% Widowed2.2% DivorcedFemales 68.1% Never married16.9% Now married1.7% Separated8.9% Widowed4.4% DivorcedWomen who gave birth in the past 12 months Now married:
0.0% (0)Unmarried:
100.0% (19)
Women who did not give birth in the past 12 months Now married:
7.1% (17)Unmarried:
92.9% (228)
Marital status - American Indian / Alaska Native population 15 years and over
Males 28.8% Never married71.2% Now married0.0% Separated0.0% Widowed0.0% DivorcedFemales 49.0% Never married51.0% Now married0.0% Separated0.0% Widowed0.0% DivorcedWomen who gave birth in the past 12 months Now married:
0.0% (0)Unmarried:
100.0% (29)
Women who did not give birth in the past 12 months Now married:
100.0% (31)Unmarried:
0.0% (0)
Marital status - Asian population 15 years and over
Males 0.0% Never married100.0% Now married0.0% Separated0.0% Widowed0.0% DivorcedFemales 30.0% Never married50.0% Now married10.9% Separated9.1% Widowed0.0% DivorcedWomen who did not give birth in the past 12 months Now married:
41.1% (31)Unmarried:
58.9% (45)
Marital status - Other race population 15 years and over
Males 58.5% Never married38.6% Now married1.1% Separated1.3% Widowed0.6% DivorcedFemales 55.2% Never married26.3% Now married0.0% Separated8.0% Widowed10.4% DivorcedWomen who gave birth in the past 12 months Now married:
59.3% (20)Unmarried:
40.7% (14)
Women who did not give birth in the past 12 months Now married:
13.4% (65)Unmarried:
86.6% (420)
Marital status - Two or more races population 15 years and over
Males 46.4% Never married40.2% Now married10.6% Separated0.0% Widowed2.8% DivorcedFemales 49.6% Never married37.2% Now married0.0% Separated5.7% Widowed7.5% DivorcedWomen who gave birth in the past 12 months Now married:
19.4% (8)Unmarried:
80.6% (33)
Women who did not give birth in the past 12 months Now married:
33.6% (244)Unmarried:
66.4% (483)
Marital status - White alone, not Hispanic / Latino population 15 years and over
Males 36.9% Never married37.9% Now married1.2% Separated4.7% Widowed19.4% DivorcedFemales 35.1% Never married36.8% Now married1.8% Separated9.8% Widowed16.6% DivorcedWomen who gave birth in the past 12 months Now married:
30.2% (55)Unmarried:
69.8% (127)
Women who did not give birth in the past 12 months Now married:
29.3% (582)Unmarried:
70.7% (1,406)
Marital status - Hispanic or Latino population 15 years and over
Males 50.1% Never married38.0% Now married7.8% Separated0.6% Widowed3.4% DivorcedFemales 48.9% Never married31.4% Now married1.4% Separated4.4% Widowed13.9% DivorcedWomen who gave birth in the past 12 months Now married:
34.2% (53)Unmarried:
65.8% (101)
Women who did not give birth in the past 12 months Now married:
28.7% (430)Unmarried:
71.3% (1,070)
Ancestries in Southbridge Town
945 10.6% French Canadian753 8.5% Irish530 5.9% French445 5.0% American313 3.5% Italian303 3.4% Polish174 2.0% English128 1.4% German111 1.2% Greek100 1.1% Dutch84 0.9% Kenyan81 0.9% Ghanaian51 0.6% Canadian44 0.5% Russian38 0.4% Swedish37 0.4% Portuguese35 0.4% Turkish25 0.3% Scottish23 0.3% Norwegian23 0.3% West Indian16 0.2% African15 0.2% Egyptian13 0.1% Romanian11 0.1% Scotch-Irish10 0.1% Finnish9 0.1% Albanian8 0.09% Brazilian7 0.08% British
Children Nativity (place of birth) in Southbridge Town
Children under 6 years - Living with two parents Both parents native 467 100.0% NativeOne native, one foreign-born parent 26 100.0% NativeChildren under 6 years - Living with one parent Native parent 664 100.0% NativeForeign-born parent 8 100.0% NativeChildren 6 to 17 years - Living with two parents Both parents native 870 99.8% Native2 0.2% Foreign-bornBoth parents foreign-born 89 100.0% NativeOne native, one foreign-born parent 95 78.5% Native26 21.5% Foreign-bornChildren 6 to 17 years - Living with one parent Native parent 1,267 100.0% NativeForeign-born parent 10 51.0% Native10 49.0% Foreign-born
Grandparents responsible for own grandchildren in Southbridge Town
Grandparents (30 to 59 years) White / Caucasian 133 53.3% Responsible for grandchildren117 46.7% Not responsible for grandchildrenBlack or African American 8 70.8% Responsible for grandchildren3 29.2% Not responsible for grandchildrenOther race 71 100.0% Not responsible for grandchildrenWhite alone, not Hispanic / Latino 33 22.1% Responsible for grandchildren117 77.9% Not responsible for grandchildrenHispanic or Latino 92 60.8% Responsible for grandchildren59 39.2% Not responsible for grandchildrenGrandparents (60 years and over) White / Caucasian 63 88.3% Responsible for grandchildren8 11.7% Not responsible for grandchildrenBlack or African American 11 100.0% Not responsible for grandchildrenWhite alone, not Hispanic / Latino 27 76.0% Responsible for grandchildren9 24.0% Not responsible for grandchildrenHispanic or Latino 59 79.3% Responsible for grandchildren15 20.7% Not responsible for grandchildren