Races in Southeast Comanche, Oklahoma (OK) Detailed Stats
Ancestries, Foreign-born residents, place of birth
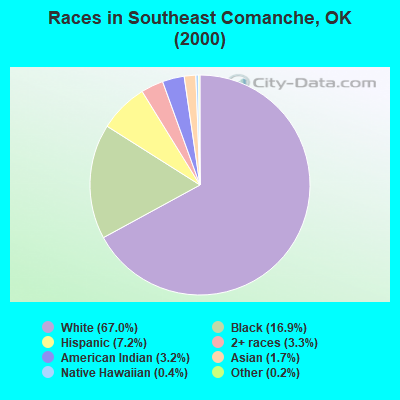
Race distribution in Southeast Comanche

- 9,54267.0%White alone
- 2,40516.9%Black alone
- 1,0297.2%Hispanic
- 4723.3%Two or more races
- 4613.2%American Indian alone
- 2431.7%Asian alone
- 640.4%Native Hawaiian and Other
Pacific Islander alone - 260.2%Other race alone
2000
2022
-
- 2,556,36874.1%White alone
- 266,1587.7%American Indian alone
- 257,9817.5%Black alone
- 179,3045.2%Hispanic
- 140,2494.1%Two or more races
- 46,1721.3%Asian alone
- 2,3220.07%Other race alone
- 2,1000.06%Native Hawaiian and Other
Pacific Islander alone

-
- 2,517,40362.6%White alone
- 486,69212.1%Hispanic
- 364,4539.1%Two or more races
- 273,6506.8%American Indian alone
- 268,5436.7%Black alone
- 92,6722.3%Asian alone
- 10,7860.3%Other race alone
- 5,6010.1%Native Hawaiian and Other
Pacific Islander alone

Income and house value in Southeast Comanche
- Median household income in 2022
- $80,248White non-Hispanic householders
- $61,164Black householders
- $60,942American Indian and Alaska Native householders
- $52,416Asian householders
- $62,084Some other race householders
- $64,754Two or more races householders
- $74,772Hispanic or Latino race householders
- Median 2022 house value
- $175,560White Non-Hispanic householders
- $175,972Black or African American householders
- $170,621American Indian or Alaska Native householders
- $161,359Asian householders
- $195,524Native Hawaiian and other Pacific Islander householders
- $173,502Some other race householders
- $167,122Two or more races householders
- $172,061Hispanic or Latino householders
Household income for White non-Hispanic householders

Household income for Black householders

Household income for American Indian and Alaska Native householders

Household income for Asian householders

Household income for Native Hawaiian and other Pacific Islander householders

Household income for Two or more races householders

Household income for Hispanic or Latino race householders

Zip code: 73501