Races in Southern Shops, South Carolina (SC) Detailed Stats
Data:
Races - White alone (%)
Races - White alone (% change since 2000)
Races - Black alone (%)
Races - Black alone (% change since 2000)
Races - American Indian alone (%)
Races - American Indian alone (% change since 2000)
Races - Asian alone (%)
Races - Asian alone (% change since 2000)
Races - Hispanic (%)
Races - Hispanic (% change since 2000)
Races - Native Hawaiian and Other Pacific Islander alone (%)
Races - Native Hawaiian and Other Pacific Islander alone (% change since 2000)
Races - Two or more races(%)
Races - Two or more races(% change since 2000)
Races - Other race alone (%)
Races - Other race alone (% change since 2000)
Racial diversity
Place of birth - Born in state of residence (%)
Place of birth - Born in state of residence (%) - White
Place of birth - Born in state of residence (%) - Black or African American
Place of birth - Born in state of residence (%) - Asian
Place of birth - Born in state of residence (%) - Hispanic or Latino
Place of birth - Born in state of residence (%) - American Indian and Alaska Native
Place of birth - Born in state of residence (%) - Multirace
Place of birth - Born in state of residence (%) - Other Race
Place of birth - Born in other state (%)
Place of birth - Born in other state (%) - White
Place of birth - Born in other state (%) - Black or African American
Place of birth - Born in other state (%) - Asian
Place of birth - Born in other state (%) - Hispanic or Latino
Place of birth - Born in other state (%) - American Indian and Alaska Native
Place of birth - Born in other state (%) - Multirace
Place of birth - Born in other state (%) - Other Race
Place of birth - Native, outside of US (%)
Place of birth - Native, outside of US (%) - White
Place of birth - Native, outside of US (%) - Black or African American
Place of birth - Native, outside of US (%) - Asian
Place of birth - Native, outside of US (%) - Hispanic or Latino
Place of birth - Native, outside of US (%) - American Indian and Alaska Native
Place of birth - Native, outside of US (%) - Multirace
Place of birth - Native, outside of US (%) - Other Race
Place of birth - Foreign born (%)
Place of birth - Foreign born (%) - White
Place of birth - Foreign born (%) - Black or African American
Place of birth - Foreign born (%) - Asian
Place of birth - Foreign born (%) - Hispanic or Latino
Place of birth - Foreign born (%) - American Indian and Alaska Native
Place of birth - Foreign born (%) - Multirace
Place of birth - Foreign born (%) - Other Race
Residents speaking English at home (%)
Residents speaking English at home - Born in the United States (%)
Residents speaking English at home - Native, born elsewhere (%)
Residents speaking English at home - Foreign born (%)
Residents speaking Spanish at home (%)
Residents speaking Spanish at home - Born in the United States (%)
Residents speaking Spanish at home - Native, born elsewhere (%)
Residents speaking Spanish at home - Foreign born (%)
Residents speaking other language at home (%)
Residents speaking other language at home - Born in the United States (%)
Residents speaking other language at home - Native, born elsewhere (%)
Residents speaking other language at home - Foreign born (%)
Marital status - Never married (%)
Marital status - Now married (%)
Marital status - Separated (%)
Marital status - Widowed (%)
Marital status - Divorced (%)
Ancestries Reported - Arab (%)
Ancestries Reported - Czech (%)
Ancestries Reported - Danish (%)
Ancestries Reported - Dutch (%)
Ancestries Reported - English (%)
Ancestries Reported - French (%)
Ancestries Reported - French Canadian (%)
Ancestries Reported - German (%)
Ancestries Reported - Greek (%)
Ancestries Reported - Hungarian (%)
Ancestries Reported - Irish (%)
Ancestries Reported - Italian (%)
Ancestries Reported - Lithuanian (%)
Ancestries Reported - Norwegian (%)
Ancestries Reported - Polish (%)
Ancestries Reported - Portuguese (%)
Ancestries Reported - Russian (%)
Ancestries Reported - Scotch-Irish (%)
Ancestries Reported - Scottish (%)
Ancestries Reported - Slovak (%)
Ancestries Reported - Subsaharan African (%)
Ancestries Reported - Swedish (%)
Ancestries Reported - Swiss (%)
Ancestries Reported - Ukrainian (%)
Ancestries Reported - United States (%)
Ancestries Reported - Welsh (%)
Ancestries Reported - West Indian (%)
Ancestries Reported - Other (%)
Geographical mobility - Same house 1 year ago (%)
Geographical mobility - Same house 1 year ago (%) - White
Geographical mobility - Same house 1 year ago (%) - Black or African American
Geographical mobility - Same house 1 year ago (%) - Asian
Geographical mobility - Same house 1 year ago (%) - Hispanic or Latino
Geographical mobility - Same house 1 year ago (%) - American Indian and Alaska Native
Geographical mobility - Same house 1 year ago (%) - Multirace
Geographical mobility - Same house 1 year ago (%) - Other Race
Geographical mobility - Moved within same county (%)
Geographical mobility - Moved within same county (%) - White
Geographical mobility - Moved within same county (%) - Black or African American
Geographical mobility - Moved within same county (%) - Asian
Geographical mobility - Moved within same county (%) - Hispanic or Latino
Geographical mobility - Moved within same county (%) - American Indian and Alaska Native
Geographical mobility - Moved within same county (%) - Multirace
Geographical mobility - Moved within same county (%) - Other Race
Geographical mobility - Moved from different county within same state (%)
Geographical mobility - Moved from different county within same state (%) - White
Geographical mobility - Moved from different county within same state (%) - Black or African American
Geographical mobility - Moved from different county within same state (%) - Asian
Geographical mobility - Moved from different county within same state (%) - Hispanic or Latino
Geographical mobility - Moved from different county within same state (%) - American Indian and Alaska Native
Geographical mobility - Moved from different county within same state (%) - Multirace
Geographical mobility - Moved from different county within same state (%) - Other Race
Geographical mobility - Moved from different state (%)
Geographical mobility - Moved from different state (%) - White
Geographical mobility - Moved from different state (%) - Black or African American
Geographical mobility - Moved from different state (%) - Asian
Geographical mobility - Moved from different state (%) - Hispanic or Latino
Geographical mobility - Moved from different state (%) - American Indian and Alaska Native
Geographical mobility - Moved from different state (%) - Multirace
Geographical mobility - Moved from different state (%) - Other Race
Geographical mobility - Moved from abroad (%)
Geographical mobility - Moved from abroad (%) - White
Geographical mobility - Moved from abroad (%) - Black or African American
Geographical mobility - Moved from abroad (%) - Asian
Geographical mobility - Moved from abroad (%) - Hispanic or Latino
Geographical mobility - Moved from abroad (%) - American Indian and Alaska Native
Geographical mobility - Moved from abroad (%) - Multirace
Geographical mobility - Moved from abroad (%) - Other Race
Place of birth for the foreign-born population - Ireland (%)
Place of birth for the foreign-born population - Denmark (%)
Place of birth for the foreign-born population - Norway (%)
Place of birth for the foreign-born population - Sweden (%)
Place of birth for the foreign-born population - United Kingdom (%)
Place of birth for the foreign-born population - England (%)
Place of birth for the foreign-born population - Scotland (%)
Place of birth for the foreign-born population - Other Northern Europe (%)
Place of birth for the foreign-born population - Austria (%)
Place of birth for the foreign-born population - Belgium (%)
Place of birth for the foreign-born population - France (%)
Place of birth for the foreign-born population - Germany (%)
Place of birth for the foreign-born population - Netherlands (%)
Place of birth for the foreign-born population - Switzerland (%)
Place of birth for the foreign-born population - Other Western Europe (%)
Place of birth for the foreign-born population - Greece (%)
Place of birth for the foreign-born population - Italy (%)
Place of birth for the foreign-born population - Portugal (%)
Place of birth for the foreign-born population - Spain (%)
Place of birth for the foreign-born population - Other Southern Europe (%)
Place of birth for the foreign-born population - Albania (%)
Place of birth for the foreign-born population - Belarus (%)
Place of birth for the foreign-born population - Bosnia and Herzegovina (%)
Place of birth for the foreign-born population - Bulgaria (%)
Place of birth for the foreign-born population - Croatia (%)
Place of birth for the foreign-born population - Czechoslovakia (%)
Place of birth for the foreign-born population - Hungary (%)
Place of birth for the foreign-born population - Latvia (%)
Place of birth for the foreign-born population - Lithuania (%)
Place of birth for the foreign-born population - North Macedonia (Macedonia) (%)
Place of birth for the foreign-born population - Moldova (%)
Place of birth for the foreign-born population - Poland (%)
Place of birth for the foreign-born population - Romania (%)
Place of birth for the foreign-born population - Russia (%)
Place of birth for the foreign-born population - Serbia (%)
Place of birth for the foreign-born population - Ukraine (%)
Place of birth for the foreign-born population - Other Eastern Europe (%)
Place of birth for the foreign-born population - China (%)
Place of birth for the foreign-born population - Hong Kong (%)
Place of birth for the foreign-born population - Taiwan (%)
Place of birth for the foreign-born population - Japan (%)
Place of birth for the foreign-born population - Korea (%)
Place of birth for the foreign-born population - Other Eastern Asia (%)
Place of birth for the foreign-born population - Afghanistan (%)
Place of birth for the foreign-born population - Bangladesh (%)
Place of birth for the foreign-born population - India (%)
Place of birth for the foreign-born population - Iran (%)
Place of birth for the foreign-born population - Kazakhstan (%)
Place of birth for the foreign-born population - Nepal (%)
Place of birth for the foreign-born population - Pakistan (%)
Place of birth for the foreign-born population - Sri Lanka (%)
Place of birth for the foreign-born population - Uzbekistan (%)
Place of birth for the foreign-born population - Other South Central Asia (%)
Place of birth for the foreign-born population - Burma (%)
Place of birth for the foreign-born population - Cambodia (%)
Place of birth for the foreign-born population - Indonesia (%)
Place of birth for the foreign-born population - Laos (%)
Place of birth for the foreign-born population - Malaysia (%)
Place of birth for the foreign-born population - Philippines (%)
Place of birth for the foreign-born population - Singapore (%)
Place of birth for the foreign-born population - Thailand (%)
Place of birth for the foreign-born population - Vietnam (%)
Place of birth for the foreign-born population - Other South Eastern Asia (%)
Place of birth for the foreign-born population - Armenia (%)
Place of birth for the foreign-born population - Iraq (%)
Place of birth for the foreign-born population - Israel (%)
Place of birth for the foreign-born population - Jordan (%)
Place of birth for the foreign-born population - Kuwait (%)
Place of birth for the foreign-born population - Lebanon (%)
Place of birth for the foreign-born population - Saudi Arabia (%)
Place of birth for the foreign-born population - Syria (%)
Place of birth for the foreign-born population - Turkey (%)
Place of birth for the foreign-born population - Yemen (%)
Place of birth for the foreign-born population - Other Western Asia (%)
Place of birth for the foreign-born population - Eritrea (%)
Place of birth for the foreign-born population - Ethiopia (%)
Place of birth for the foreign-born population - Kenya (%)
Place of birth for the foreign-born population - Somalia (%)
Place of birth for the foreign-born population - Uganda (%)
Place of birth for the foreign-born population - Zimbabwe (%)
Place of birth for the foreign-born population - Other Eastern Africa (%)
Place of birth for the foreign-born population - Cameroon (%)
Place of birth for the foreign-born population - Congo (%)
Place of birth for the foreign-born population - Democratic Republic of Congo (Zaire) (%)
Place of birth for the foreign-born population - Other Middle Africa (%)
Place of birth for the foreign-born population - Egypt (%)
Place of birth for the foreign-born population - Morocco (%)
Place of birth for the foreign-born population - Sudan (%)
Place of birth for the foreign-born population - Other Northern Africa (%)
Place of birth for the foreign-born population - South Africa (%)
Place of birth for the foreign-born population - Other Southern Africa (%)
Place of birth for the foreign-born population - Cabo Verde (%)
Place of birth for the foreign-born population - Ghana (%)
Place of birth for the foreign-born population - Liberia (%)
Place of birth for the foreign-born population - Nigeria (%)
Place of birth for the foreign-born population - Senegal (%)
Place of birth for the foreign-born population - Sierra Leone (%)
Place of birth for the foreign-born population - Other Western Africa (%)
Place of birth for the foreign-born population - Australia (%)
Place of birth for the foreign-born population - New Zealand (%)
Place of birth for the foreign-born population - Fiji (%)
Place of birth for the foreign-born population - Micronesia (%)
Place of birth for the foreign-born population - Bahamas (%)
Place of birth for the foreign-born population - Barbados (%)
Place of birth for the foreign-born population - Cuba (%)
Place of birth for the foreign-born population - Dominica (%)
Place of birth for the foreign-born population - Dominican Republic (%)
Place of birth for the foreign-born population - Grenada (%)
Place of birth for the foreign-born population - Haiti (%)
Place of birth for the foreign-born population - Jamaica (%)
Place of birth for the foreign-born population - St. Vincent and the Grenadines (%)
Place of birth for the foreign-born population - Trinidad and Tobago (%)
Place of birth for the foreign-born population - West Indies (%)
Place of birth for the foreign-born population - Other Caribbean (%)
Place of birth for the foreign-born population - Belize (%)
Place of birth for the foreign-born population - Costa Rica (%)
Place of birth for the foreign-born population - El Salvador (%)
Place of birth for the foreign-born population - Guatemala (%)
Place of birth for the foreign-born population - Honduras (%)
Place of birth for the foreign-born population - Mexico (%)
Place of birth for the foreign-born population - Nicaragua (%)
Place of birth for the foreign-born population - Panama (%)
Place of birth for the foreign-born population - Other Central America (%)
Place of birth for the foreign-born population - Argentina (%)
Place of birth for the foreign-born population - Bolivia (%)
Place of birth for the foreign-born population - Brazil (%)
Place of birth for the foreign-born population - Chile (%)
Place of birth for the foreign-born population - Colombia (%)
Place of birth for the foreign-born population - Ecuador (%)
Place of birth for the foreign-born population - Guyana (%)
Place of birth for the foreign-born population - Peru (%)
Place of birth for the foreign-born population - Uruguay (%)
Place of birth for the foreign-born population - Venezuela (%)
Place of birth for the foreign-born population - Other South America (%)
Place of birth for the foreign-born population - Canada (%)
Place of birth for the foreign-born population - Other Northern America (%)
Place of birth for the foreign-born population - Other (%)
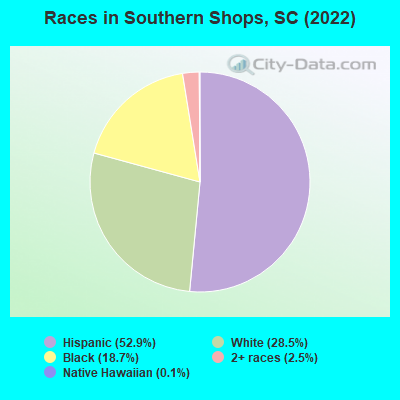
According to 2022 data, the most numerous races in Southern Shops, SC are White alone (1,152 residents), Black alone (755 residents), and Hispanic (2,135 residents). 50.1% of Southern Shops residents speak English at home. 26.4% of Southern Shops, SC residents are foreign-born (27.4% born in Latin America), which is 81.1% greater than the foreign-born rate of 5.0% across the entire state of South Carolina.
Race distribution in Southern Shops
2000 2022
2,652,291 66.1% White alone 1,178,486 29.4% Black alone 95,076 2.4% Hispanic 35,568 0.9% Asian alone 33,290 0.8% Two or more races 12,765 0.3% American Indian alone 3,266 0.08% Other race alone 1,270 0.03% Native Hawaiian and Other
3,301,739 62.5% White alone 1,313,290 24.9% Black alone 343,783 6.5% Hispanic 190,508 3.6% Two or more races 89,888 1.7% Asian alone 29,390 0.6% Other race alone 12,112 0.2% American Indian alone 1,924 0.04% Native Hawaiian and Other
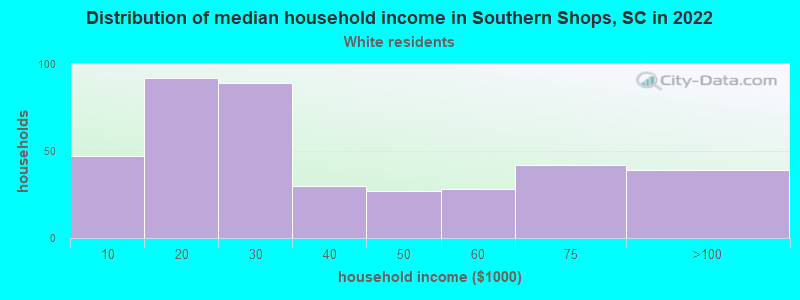
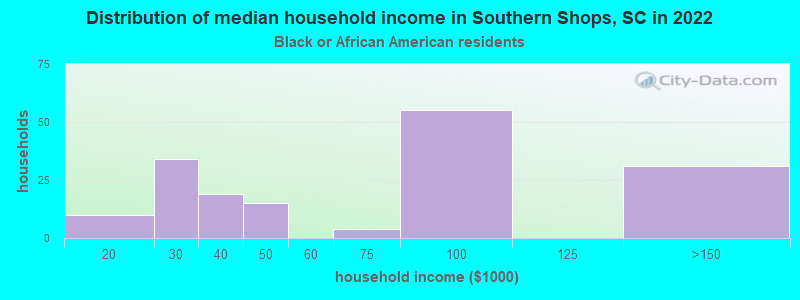
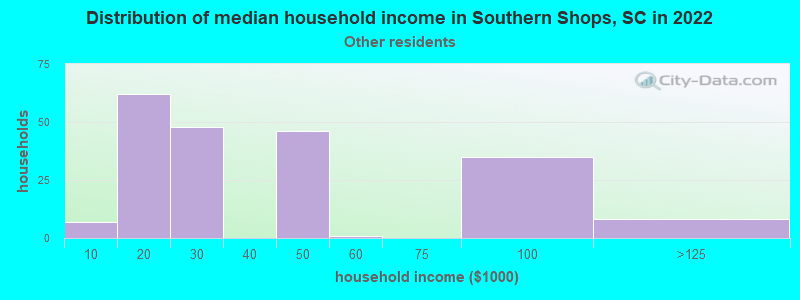
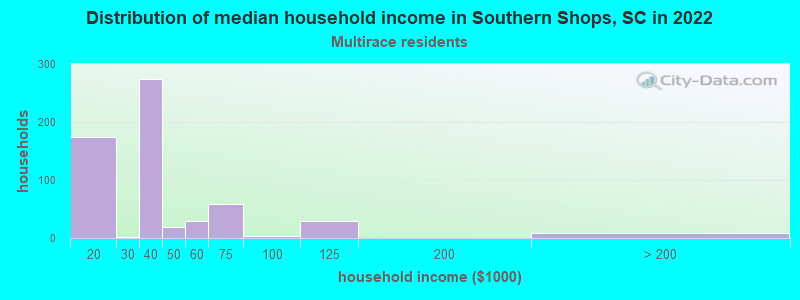
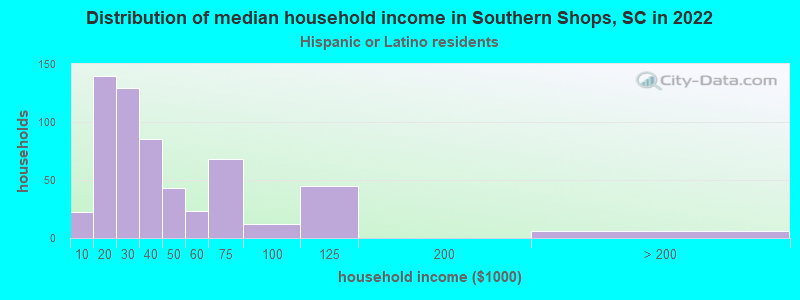
Income and house value in Southern Shops Median household income in 2022 $21,782 White non-Hispanic householders$79,268 Black householders$30,738 Some other race householders$33,012 Two or more races householders$27,847 Hispanic or Latino race householdersMedian 2022 house value $149,081 White Non-Hispanic householders$168,454 Black or African American householders$147,663 Some other race householders$497,802 Two or more races householders$150,734 Hispanic or Latino householders
Median age by race in Southern Shops
32.2 Median age for White residents33.1 32.2 47.3 Median age for Black or African American residents43.2 60.6 -295,634,920.3 Median age for American Indian / Alaska Native residents-583,333,332.8 -803,131,990.2 -689,964,157.0 Median age for Asian residents-753,195,672.8 -656,488,549.0 -698,412,697.7 Median age for Native Hawaiian / Pacific Islander residents-551,574,375.1 -1,016,109,044.8 30.6 Median age for Other race residents27.3 39.1 36.2 Median age for Two or more races residents33.4 31.8 33.3 Median age for White alone residents34.0 32.3 30.1 Median age for Hispanic or Latino residents27.2 34.6
Owner/renter occupied households by race in Southern Shops
House owners and renters - White residents 136 34.0% Owner occupied265 66.0% Renter occupiedHouse owners and renters - Black or African American residents 78 39.9% Owner occupied118 60.1% Renter occupiedHouse owners and renters - Native Hawaiian / Pacific Islander residents 6 100.0% Renter occupiedHouse owners and renters - Other race residents 175 67.7% Owner occupied84 32.3% Renter occupiedHouse owners and renters - Two or more races residents 240 32.7% Owner occupied495 67.3% Renter occupiedHouse owners and renters - White alone residents 131 39.6% Owner occupied200 60.4% Renter occupiedHouse owners and renters - Hispanic or Latino residents 317 43.5% Owner occupied412 56.5% Renter occupied
Language usage in Southern Shops
English speakers - Total 50.1% of residents of Southern Shops speak English at home.
52.2% of residents speak Spanish at home 814 41.2% Speak English very well1,162 58.8% Speak English less than very well
English speakers - Born in the United States 62.0% of residents of Southern Shops speak English at home.
25.5% of residents speak Spanish at home 203 100.0% Speak English very well
All residents speak only English at home
English speakers - Foreign-born 0.0% of residents of Southern Shops speak English at home.
104.2% of residents speak Spanish at home 196 15.2% Speak English very well1,092 84.8% Speak English less than very well
White (Caucasian) - Speak another language Native:
7.8% (84)Foreign-born:
96.8% (121)
Other race - Speak another language Native:
76.0% (168)Foreign-born:
95.9% (318)
Two or more races - Speak another language Native:
81.6% (612)Foreign-born:
99.0% (1,313)
White alone - Speak another language Native:
1.2% (12)Foreign-born:
100.0% (26)
Hispanic or Latino - Speak another language Native:
94.3% (710)Foreign-born:
100.0% (1,331)
Foreign-born residents in Southern Shops 1,067 residents are foreign born (27.4% Latin America ).
This city:
26.4%South Carolina:
5.3%
Marital status for residents in Southern Shops Marital status - White (Caucasian) population 15 years and over
Males 37.4% Never married36.6% Now married8.9% Separated0.8% Widowed16.2% DivorcedFemales 17.3% Never married57.9% Now married9.7% Separated5.5% Widowed9.7% DivorcedWomen who did not give birth in the past 12 months Now married:
55.1% (129)Unmarried:
44.9% (105)
Marital status - Black or African American population 15 years and over
Males 60.2% Never married21.5% Now married15.1% Separated0.0% Widowed3.2% DivorcedFemales 18.7% Never married39.9% Now married20.2% Separated0.0% Widowed21.2% DivorcedWomen who did not give birth in the past 12 months Now married:
25.0% (17)Unmarried:
75.0% (50)
Marital status - Other race population 15 years and over
Males 35.9% Never married58.9% Now married0.0% Separated0.0% Widowed5.2% DivorcedFemales 37.3% Never married62.2% Now married0.0% Separated0.0% Widowed0.5% DivorcedWomen who gave birth in the past 12 months Now married:
100.0% (27)Unmarried:
0.0% (0)
Women who did not give birth in the past 12 months Now married:
51.5% (116)Unmarried:
48.5% (110)
Marital status - Two or more races population 15 years and over
Males 71.0% Never married17.8% Now married10.3% Separated0.0% Widowed0.9% DivorcedFemales 45.5% Never married52.8% Now married0.0% Separated0.6% Widowed1.1% DivorcedWomen who did not give birth in the past 12 months Now married:
68.8% (127)Unmarried:
31.2% (58)
Marital status - White alone, not Hispanic / Latino population 15 years and over
Males 39.8% Never married30.4% Now married10.2% Separated0.9% Widowed18.6% DivorcedFemales 20.8% Never married49.2% Now married11.7% Separated6.6% Widowed11.7% DivorcedWomen who did not give birth in the past 12 months Now married:
41.3% (76)Unmarried:
58.7% (108)
Marital status - Hispanic or Latino population 15 years and over
Males 58.7% Never married32.3% Now married7.8% Separated0.0% Widowed1.2% DivorcedFemales 35.4% Never married64.4% Now married0.0% Separated0.0% Widowed0.2% DivorcedWomen who gave birth in the past 12 months Now married:
100.0% (23)Unmarried:
0.0% (0)
Women who did not give birth in the past 12 months Now married:
65.1% (239)Unmarried:
34.9% (128)
Ancestries in Southern Shops
225 7.9% English115 4.0% Irish37 1.3% German32 1.1% American21 0.7% African20 0.7% Italian19 0.7% Ethiopian10 0.4% Scotch-Irish5 0.2% European4 0.1% British2 0.07% Scandinavian
Children Nativity (place of birth) in Southern Shops
Children under 6 years - Living with two parents Both parents native 10 100.0% NativeBoth parents foreign-born 24 100.0% NativeOne native, one foreign-born parent 7 100.0% NativeChildren under 6 years - Living with one parent Native parent 113 100.0% NativeForeign-born parent 105 100.0% NativeChildren 6 to 17 years - Living with two parents Both parents native 21 100.0% NativeBoth parents foreign-born 61 58.1% Native44 41.9% Foreign-bornOne native, one foreign-born parent 2 100.0% NativeChildren 6 to 17 years - Living with one parent Foreign-born parent 402 54.7% Native333 45.3% Foreign-born
Grandparents responsible for own grandchildren in Southern Shops
Grandparents (30 to 59 years) White / Caucasian 28 80.3% Responsible for grandchildren7 19.7% Not responsible for grandchildrenOther race 1 100.0% Responsible for grandchildrenWhite alone, not Hispanic / Latino 28 80.3% Responsible for grandchildren7 19.7% Not responsible for grandchildrenHispanic or Latino 1 72.5% Responsible for grandchildren
Grandparents (60 years and over) White / Caucasian 7 100.0% Not responsible for grandchildrenWhite alone, not Hispanic / Latino 7 100.0% Not responsible for grandchildren