Races in Spanaway, Washington (WA) Detailed Stats
Data:
Races - White alone (%)
Races - White alone (% change since 2000)
Races - Black alone (%)
Races - Black alone (% change since 2000)
Races - American Indian alone (%)
Races - American Indian alone (% change since 2000)
Races - Asian alone (%)
Races - Asian alone (% change since 2000)
Races - Hispanic (%)
Races - Hispanic (% change since 2000)
Races - Native Hawaiian and Other Pacific Islander alone (%)
Races - Native Hawaiian and Other Pacific Islander alone (% change since 2000)
Races - Two or more races(%)
Races - Two or more races(% change since 2000)
Races - Other race alone (%)
Races - Other race alone (% change since 2000)
Racial diversity
Place of birth - Born in state of residence (%)
Place of birth - Born in state of residence (%) - White
Place of birth - Born in state of residence (%) - Black or African American
Place of birth - Born in state of residence (%) - Asian
Place of birth - Born in state of residence (%) - Hispanic or Latino
Place of birth - Born in state of residence (%) - American Indian and Alaska Native
Place of birth - Born in state of residence (%) - Multirace
Place of birth - Born in state of residence (%) - Other Race
Place of birth - Born in other state (%)
Place of birth - Born in other state (%) - White
Place of birth - Born in other state (%) - Black or African American
Place of birth - Born in other state (%) - Asian
Place of birth - Born in other state (%) - Hispanic or Latino
Place of birth - Born in other state (%) - American Indian and Alaska Native
Place of birth - Born in other state (%) - Multirace
Place of birth - Born in other state (%) - Other Race
Place of birth - Native, outside of US (%)
Place of birth - Native, outside of US (%) - White
Place of birth - Native, outside of US (%) - Black or African American
Place of birth - Native, outside of US (%) - Asian
Place of birth - Native, outside of US (%) - Hispanic or Latino
Place of birth - Native, outside of US (%) - American Indian and Alaska Native
Place of birth - Native, outside of US (%) - Multirace
Place of birth - Native, outside of US (%) - Other Race
Place of birth - Foreign born (%)
Place of birth - Foreign born (%) - White
Place of birth - Foreign born (%) - Black or African American
Place of birth - Foreign born (%) - Asian
Place of birth - Foreign born (%) - Hispanic or Latino
Place of birth - Foreign born (%) - American Indian and Alaska Native
Place of birth - Foreign born (%) - Multirace
Place of birth - Foreign born (%) - Other Race
Residents speaking English at home (%)
Residents speaking English at home - Born in the United States (%)
Residents speaking English at home - Native, born elsewhere (%)
Residents speaking English at home - Foreign born (%)
Residents speaking Spanish at home (%)
Residents speaking Spanish at home - Born in the United States (%)
Residents speaking Spanish at home - Native, born elsewhere (%)
Residents speaking Spanish at home - Foreign born (%)
Residents speaking other language at home (%)
Residents speaking other language at home - Born in the United States (%)
Residents speaking other language at home - Native, born elsewhere (%)
Residents speaking other language at home - Foreign born (%)
Marital status - Never married (%)
Marital status - Now married (%)
Marital status - Separated (%)
Marital status - Widowed (%)
Marital status - Divorced (%)
Ancestries Reported - Arab (%)
Ancestries Reported - Czech (%)
Ancestries Reported - Danish (%)
Ancestries Reported - Dutch (%)
Ancestries Reported - English (%)
Ancestries Reported - French (%)
Ancestries Reported - French Canadian (%)
Ancestries Reported - German (%)
Ancestries Reported - Greek (%)
Ancestries Reported - Hungarian (%)
Ancestries Reported - Irish (%)
Ancestries Reported - Italian (%)
Ancestries Reported - Lithuanian (%)
Ancestries Reported - Norwegian (%)
Ancestries Reported - Polish (%)
Ancestries Reported - Portuguese (%)
Ancestries Reported - Russian (%)
Ancestries Reported - Scotch-Irish (%)
Ancestries Reported - Scottish (%)
Ancestries Reported - Slovak (%)
Ancestries Reported - Subsaharan African (%)
Ancestries Reported - Swedish (%)
Ancestries Reported - Swiss (%)
Ancestries Reported - Ukrainian (%)
Ancestries Reported - United States (%)
Ancestries Reported - Welsh (%)
Ancestries Reported - West Indian (%)
Ancestries Reported - Other (%)
Geographical mobility - Same house 1 year ago (%)
Geographical mobility - Same house 1 year ago (%) - White
Geographical mobility - Same house 1 year ago (%) - Black or African American
Geographical mobility - Same house 1 year ago (%) - Asian
Geographical mobility - Same house 1 year ago (%) - Hispanic or Latino
Geographical mobility - Same house 1 year ago (%) - American Indian and Alaska Native
Geographical mobility - Same house 1 year ago (%) - Multirace
Geographical mobility - Same house 1 year ago (%) - Other Race
Geographical mobility - Moved within same county (%)
Geographical mobility - Moved within same county (%) - White
Geographical mobility - Moved within same county (%) - Black or African American
Geographical mobility - Moved within same county (%) - Asian
Geographical mobility - Moved within same county (%) - Hispanic or Latino
Geographical mobility - Moved within same county (%) - American Indian and Alaska Native
Geographical mobility - Moved within same county (%) - Multirace
Geographical mobility - Moved within same county (%) - Other Race
Geographical mobility - Moved from different county within same state (%)
Geographical mobility - Moved from different county within same state (%) - White
Geographical mobility - Moved from different county within same state (%) - Black or African American
Geographical mobility - Moved from different county within same state (%) - Asian
Geographical mobility - Moved from different county within same state (%) - Hispanic or Latino
Geographical mobility - Moved from different county within same state (%) - American Indian and Alaska Native
Geographical mobility - Moved from different county within same state (%) - Multirace
Geographical mobility - Moved from different county within same state (%) - Other Race
Geographical mobility - Moved from different state (%)
Geographical mobility - Moved from different state (%) - White
Geographical mobility - Moved from different state (%) - Black or African American
Geographical mobility - Moved from different state (%) - Asian
Geographical mobility - Moved from different state (%) - Hispanic or Latino
Geographical mobility - Moved from different state (%) - American Indian and Alaska Native
Geographical mobility - Moved from different state (%) - Multirace
Geographical mobility - Moved from different state (%) - Other Race
Geographical mobility - Moved from abroad (%)
Geographical mobility - Moved from abroad (%) - White
Geographical mobility - Moved from abroad (%) - Black or African American
Geographical mobility - Moved from abroad (%) - Asian
Geographical mobility - Moved from abroad (%) - Hispanic or Latino
Geographical mobility - Moved from abroad (%) - American Indian and Alaska Native
Geographical mobility - Moved from abroad (%) - Multirace
Geographical mobility - Moved from abroad (%) - Other Race
Place of birth for the foreign-born population - Ireland (%)
Place of birth for the foreign-born population - Denmark (%)
Place of birth for the foreign-born population - Norway (%)
Place of birth for the foreign-born population - Sweden (%)
Place of birth for the foreign-born population - United Kingdom (%)
Place of birth for the foreign-born population - England (%)
Place of birth for the foreign-born population - Scotland (%)
Place of birth for the foreign-born population - Other Northern Europe (%)
Place of birth for the foreign-born population - Austria (%)
Place of birth for the foreign-born population - Belgium (%)
Place of birth for the foreign-born population - France (%)
Place of birth for the foreign-born population - Germany (%)
Place of birth for the foreign-born population - Netherlands (%)
Place of birth for the foreign-born population - Switzerland (%)
Place of birth for the foreign-born population - Other Western Europe (%)
Place of birth for the foreign-born population - Greece (%)
Place of birth for the foreign-born population - Italy (%)
Place of birth for the foreign-born population - Portugal (%)
Place of birth for the foreign-born population - Spain (%)
Place of birth for the foreign-born population - Other Southern Europe (%)
Place of birth for the foreign-born population - Albania (%)
Place of birth for the foreign-born population - Belarus (%)
Place of birth for the foreign-born population - Bosnia and Herzegovina (%)
Place of birth for the foreign-born population - Bulgaria (%)
Place of birth for the foreign-born population - Croatia (%)
Place of birth for the foreign-born population - Czechoslovakia (%)
Place of birth for the foreign-born population - Hungary (%)
Place of birth for the foreign-born population - Latvia (%)
Place of birth for the foreign-born population - Lithuania (%)
Place of birth for the foreign-born population - North Macedonia (Macedonia) (%)
Place of birth for the foreign-born population - Moldova (%)
Place of birth for the foreign-born population - Poland (%)
Place of birth for the foreign-born population - Romania (%)
Place of birth for the foreign-born population - Russia (%)
Place of birth for the foreign-born population - Serbia (%)
Place of birth for the foreign-born population - Ukraine (%)
Place of birth for the foreign-born population - Other Eastern Europe (%)
Place of birth for the foreign-born population - China (%)
Place of birth for the foreign-born population - Hong Kong (%)
Place of birth for the foreign-born population - Taiwan (%)
Place of birth for the foreign-born population - Japan (%)
Place of birth for the foreign-born population - Korea (%)
Place of birth for the foreign-born population - Other Eastern Asia (%)
Place of birth for the foreign-born population - Afghanistan (%)
Place of birth for the foreign-born population - Bangladesh (%)
Place of birth for the foreign-born population - India (%)
Place of birth for the foreign-born population - Iran (%)
Place of birth for the foreign-born population - Kazakhstan (%)
Place of birth for the foreign-born population - Nepal (%)
Place of birth for the foreign-born population - Pakistan (%)
Place of birth for the foreign-born population - Sri Lanka (%)
Place of birth for the foreign-born population - Uzbekistan (%)
Place of birth for the foreign-born population - Other South Central Asia (%)
Place of birth for the foreign-born population - Burma (%)
Place of birth for the foreign-born population - Cambodia (%)
Place of birth for the foreign-born population - Indonesia (%)
Place of birth for the foreign-born population - Laos (%)
Place of birth for the foreign-born population - Malaysia (%)
Place of birth for the foreign-born population - Philippines (%)
Place of birth for the foreign-born population - Singapore (%)
Place of birth for the foreign-born population - Thailand (%)
Place of birth for the foreign-born population - Vietnam (%)
Place of birth for the foreign-born population - Other South Eastern Asia (%)
Place of birth for the foreign-born population - Armenia (%)
Place of birth for the foreign-born population - Iraq (%)
Place of birth for the foreign-born population - Israel (%)
Place of birth for the foreign-born population - Jordan (%)
Place of birth for the foreign-born population - Kuwait (%)
Place of birth for the foreign-born population - Lebanon (%)
Place of birth for the foreign-born population - Saudi Arabia (%)
Place of birth for the foreign-born population - Syria (%)
Place of birth for the foreign-born population - Turkey (%)
Place of birth for the foreign-born population - Yemen (%)
Place of birth for the foreign-born population - Other Western Asia (%)
Place of birth for the foreign-born population - Eritrea (%)
Place of birth for the foreign-born population - Ethiopia (%)
Place of birth for the foreign-born population - Kenya (%)
Place of birth for the foreign-born population - Somalia (%)
Place of birth for the foreign-born population - Uganda (%)
Place of birth for the foreign-born population - Zimbabwe (%)
Place of birth for the foreign-born population - Other Eastern Africa (%)
Place of birth for the foreign-born population - Cameroon (%)
Place of birth for the foreign-born population - Congo (%)
Place of birth for the foreign-born population - Democratic Republic of Congo (Zaire) (%)
Place of birth for the foreign-born population - Other Middle Africa (%)
Place of birth for the foreign-born population - Egypt (%)
Place of birth for the foreign-born population - Morocco (%)
Place of birth for the foreign-born population - Sudan (%)
Place of birth for the foreign-born population - Other Northern Africa (%)
Place of birth for the foreign-born population - South Africa (%)
Place of birth for the foreign-born population - Other Southern Africa (%)
Place of birth for the foreign-born population - Cabo Verde (%)
Place of birth for the foreign-born population - Ghana (%)
Place of birth for the foreign-born population - Liberia (%)
Place of birth for the foreign-born population - Nigeria (%)
Place of birth for the foreign-born population - Senegal (%)
Place of birth for the foreign-born population - Sierra Leone (%)
Place of birth for the foreign-born population - Other Western Africa (%)
Place of birth for the foreign-born population - Australia (%)
Place of birth for the foreign-born population - New Zealand (%)
Place of birth for the foreign-born population - Fiji (%)
Place of birth for the foreign-born population - Micronesia (%)
Place of birth for the foreign-born population - Bahamas (%)
Place of birth for the foreign-born population - Barbados (%)
Place of birth for the foreign-born population - Cuba (%)
Place of birth for the foreign-born population - Dominica (%)
Place of birth for the foreign-born population - Dominican Republic (%)
Place of birth for the foreign-born population - Grenada (%)
Place of birth for the foreign-born population - Haiti (%)
Place of birth for the foreign-born population - Jamaica (%)
Place of birth for the foreign-born population - St. Vincent and the Grenadines (%)
Place of birth for the foreign-born population - Trinidad and Tobago (%)
Place of birth for the foreign-born population - West Indies (%)
Place of birth for the foreign-born population - Other Caribbean (%)
Place of birth for the foreign-born population - Belize (%)
Place of birth for the foreign-born population - Costa Rica (%)
Place of birth for the foreign-born population - El Salvador (%)
Place of birth for the foreign-born population - Guatemala (%)
Place of birth for the foreign-born population - Honduras (%)
Place of birth for the foreign-born population - Mexico (%)
Place of birth for the foreign-born population - Nicaragua (%)
Place of birth for the foreign-born population - Panama (%)
Place of birth for the foreign-born population - Other Central America (%)
Place of birth for the foreign-born population - Argentina (%)
Place of birth for the foreign-born population - Bolivia (%)
Place of birth for the foreign-born population - Brazil (%)
Place of birth for the foreign-born population - Chile (%)
Place of birth for the foreign-born population - Colombia (%)
Place of birth for the foreign-born population - Ecuador (%)
Place of birth for the foreign-born population - Guyana (%)
Place of birth for the foreign-born population - Peru (%)
Place of birth for the foreign-born population - Uruguay (%)
Place of birth for the foreign-born population - Venezuela (%)
Place of birth for the foreign-born population - Other South America (%)
Place of birth for the foreign-born population - Canada (%)
Place of birth for the foreign-born population - Other Northern America (%)
Place of birth for the foreign-born population - Other (%)
Latest news about races in Spanaway, WA collected exclusively by city-data.com from local newspapers, TV, and radio stations
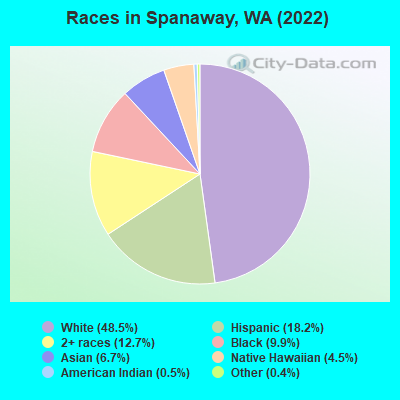
According to 2022 data, the most numerous races in Spanaway, WA are White alone (16,648 residents), Hispanic (6,233 residents), and Asian alone (2,287 residents). 74.2% of Spanaway residents speak English at home. 15.5% of Spanaway, WA residents are foreign-born (4.5% born in Europe, 4.2% born in Latin America, 3.9% born in Asia, 1.6% born in Oceania), which is 3.5% greater than the foreign-born rate of 15.0% across the entire state of Washington.
Race distribution in Spanaway
2000 2022
14,867 68.9% White alone 1,931 8.9% Black alone 1,428 6.6% Two or more races 1,345 6.2% Asian alone 1,185 5.5% Hispanic 451 2.1% Native Hawaiian and Other 317 1.5% American Indian alone 64 0.3% Other race alone
16,648 48.5% White alone 6,233 18.2% Hispanic 4,365 12.7% Two or more races 3,397 9.9% Black alone 2,287 6.7% Asian alone 1,543 4.5% Native Hawaiian and Other 172 0.5% American Indian alone 153 0.4% Other race alone
2000 2022
4,652,490 78.9% White alone 441,509 7.5% Hispanic 319,401 5.4% Asian alone 184,631 3.1% Black alone 175,926 3.0% Two or more races 85,396 1.4% American Indian alone 22,779 0.4% Native Hawaiian and Other 11,989 0.2% Other race alone
4,941,456 63.5% White alone 1,093,313 14.0% Hispanic 755,832 9.7% Asian alone 523,448 6.7% Two or more races 299,537 3.8% Black alone 69,024 0.9% American Indian alone 52,231 0.7% Native Hawaiian and Other 50,945 0.7% Other race alone
Income and house value in Spanaway Median household income in 2022 $92,858 White non-Hispanic householders$90,014 Black householders$67,880 American Indian and Alaska Native householders$105,683 Asian householders$83,896 Some other race householders$106,603 Two or more races householders$95,375 Hispanic or Latino race householdersMedian 2022 house value $450,542 White Non-Hispanic householders$476,542 Black or African American householders$425,911 American Indian or Alaska Native householders $453,279 Asian householders$518,278 Native Hawaiian and other Pacific Islander householders$505,278 Some other race householders$436,516 Two or more races householders$444,727 Hispanic or Latino householders
Median age by race in Spanaway
35.9 Median age for White residents35.5 36.2 32.7 Median age for Black or African American residents32.2 33.4 29.4 Median age for American Indian / Alaska Native residents25.3 28.5 43.3 Median age for Asian residents42.1 48.1 31.9 Median age for Native Hawaiian / Pacific Islander residents36.5 28.3 34.1 Median age for Other race residents28.1 44.2 21.7 Median age for Two or more races residents18.7 24.2 37.3 Median age for White alone residents37.4 37.0 25.5 Median age for Hispanic or Latino residents25.6 25.6
Owner/renter occupied households by race in Spanaway
House owners and renters - White residents 4,894 72.4% Owner occupied1,866 27.6% Renter occupiedHouse owners and renters - Black or African American residents 784 61.5% Owner occupied490 38.5% Renter occupiedHouse owners and renters - American Indian / Alaska Native residents 108 80.4% Owner occupied26 19.6% Renter occupiedHouse owners and renters - Asian residents 754 76.2% Owner occupied235 23.8% Renter occupiedHouse owners and renters - Native Hawaiian / Pacific Islander residents 196 51.7% Owner occupied182 48.3% Renter occupiedHouse owners and renters - Other race residents 411 79.9% Owner occupied103 20.1% Renter occupiedHouse owners and renters - Two or more races residents 1,595 81.2% Owner occupied368 18.8% Renter occupiedHouse owners and renters - White alone residents 4,653 72.8% Owner occupied1,742 27.2% Renter occupiedHouse owners and renters - Hispanic or Latino residents 1,305 78.8% Owner occupied352 21.2% Renter occupied
Language usage in Spanaway
English speakers - Total 74.2% of residents of Spanaway speak English at home.
9.9% of residents speak Spanish at home 2,447 76.5% Speak English very well753 23.5% Speak English less than very well16.1% of residents speak other language at home 3,210 61.7% Speak English very well1,991 38.3% Speak English less than very well
English speakers - Born in the United States 90.8% of residents of Spanaway speak English at home.
6.3% of residents speak Spanish at home 642 95.0% Speak English very well34 5.0% Speak English less than very well2.8% of residents speak other language at home 241 79.8% Speak English very well61 20.2% Speak English less than very well
English speakers - Native, born elsewhere 56.0% of residents of Spanaway speak English at home.
12.2% of residents speak Spanish at home 148 80.4% Speak English very well36 19.6% Speak English less than very well31.2% of residents speak other language at home 375 79.8% Speak English very well95 20.2% Speak English less than very well
English speakers - Foreign-born 16.8% of residents of Spanaway speak English at home.
21.6% of residents speak Spanish at home 524 44.5% Speak English very well654 55.5% Speak English less than very well61.8% of residents speak other language at home 1,759 52.1% Speak English very well1,614 47.9% Speak English less than very well
White (Caucasian) - Speak only English Native:
95.2% (14,539)Foreign-born:
16.3% (309)
White (Caucasian) - Speak another language Native:
4.1% (630)Foreign-born:
86.2% (1,630)
Black or African American - Speak only English Native:
98.4% (2,909)Foreign-born:
39.8% (72)
Black or African American - Speak another language Native:
1.3% (38)Foreign-born:
29.1% (53)
American Indian / Alaska Native - Speak another language Native:
12.2% (32)Foreign-born:
100.0% (46)
Asian - Speak only English Native:
37.5% (401)Foreign-born:
28.0% (367)
Asian - Speak another language Native:
58.7% (628)Foreign-born:
74.0% (968)
Native Hawaiian / Pacific Islander - Speak only English Native:
41.5% (436)Foreign-born:
15.3% (61)
Native Hawaiian / Pacific Islander - Speak another language Native:
61.3% (644)Foreign-born:
82.1% (326)
Other race - Speak only English Native:
33.8% (399)Foreign-born:
12.8% (46)
Other race - Speak another language Native:
65.5% (773)Foreign-born:
87.5% (315)
Two or more races - Speak only English Native:
77.2% (4,489)Foreign-born:
5.1% (69)
Two or more races - Speak another language Native:
23.8% (1,385)Foreign-born:
100.0% (1,362)
White alone - Speak only English Native:
96.5% (13,715)Foreign-born:
16.3% (278)
White alone - Speak another language Native:
3.2% (456)Foreign-born:
89.7% (1,532)
Hispanic or Latino - Speak only English Native:
52.7% (2,306)Foreign-born:
8.3% (121)
Hispanic or Latino - Speak another language Native:
46.0% (2,014)Foreign-born:
91.5% (1,321)
Foreign-born residents in Spanaway 5,335 residents are foreign born (4.5% Europe , 4.2% Latin America , 3.9% Asia , 1.6% Oceania ).
This city:
15.5%Washington:
14.9%
Marital status for residents in Spanaway Marital status - White (Caucasian) population 15 years and over
Males 32.3% Never married52.5% Now married0.1% Separated1.7% Widowed13.4% DivorcedFemales 24.4% Never married52.3% Now married1.1% Separated5.9% Widowed16.3% DivorcedWomen who gave birth in the past 12 months Now married:
60.4% (133)Unmarried:
39.6% (87)
Women who did not give birth in the past 12 months Now married:
50.3% (2,052)Unmarried:
49.7% (2,027)
Marital status - Black or African American population 15 years and over
Males 38.3% Never married37.4% Now married7.8% Separated0.5% Widowed16.0% DivorcedFemales 32.2% Never married39.9% Now married4.9% Separated1.4% Widowed21.6% DivorcedWomen who gave birth in the past 12 months Now married:
0.0% (0)Unmarried:
100.0% (79)
Women who did not give birth in the past 12 months Now married:
49.3% (395)Unmarried:
50.7% (405)
Marital status - American Indian / Alaska Native population 15 years and over
Males 30.1% Never married63.9% Now married0.0% Separated0.0% Widowed5.9% DivorcedFemales 89.5% Never married8.6% Now married0.0% Separated1.9% Widowed0.0% DivorcedWomen who did not give birth in the past 12 months Now married:
0.0% (0)Unmarried:
100.0% (92)
Marital status - Asian population 15 years and over
Males 26.1% Never married65.1% Now married2.3% Separated0.9% Widowed5.7% DivorcedFemales 23.2% Never married54.9% Now married0.0% Separated10.6% Widowed11.2% DivorcedWomen who gave birth in the past 12 months Now married:
48.4% (32)Unmarried:
51.6% (34)
Women who did not give birth in the past 12 months Now married:
38.4% (175)Unmarried:
61.6% (281)
Marital status - Native Hawaiian / Pacific Islander population 15 years and over
Males 28.7% Never married69.3% Now married0.0% Separated0.0% Widowed1.9% DivorcedFemales 32.2% Never married60.3% Now married1.9% Separated1.3% Widowed4.2% DivorcedWomen who did not give birth in the past 12 months Now married:
57.0% (282)Unmarried:
43.0% (213)
Marital status - Other race population 15 years and over
Males 45.1% Never married44.0% Now married3.7% Separated0.0% Widowed7.3% DivorcedFemales 13.9% Never married71.9% Now married0.0% Separated0.0% Widowed14.2% DivorcedWomen who gave birth in the past 12 months Now married:
100.0% (12)Unmarried:
0.0% (0)
Women who did not give birth in the past 12 months Now married:
72.3% (222)Unmarried:
27.7% (85)
Marital status - Two or more races population 15 years and over
Males 45.6% Never married41.5% Now married0.0% Separated0.5% Widowed12.4% DivorcedFemales 41.9% Never married40.3% Now married3.4% Separated2.6% Widowed11.8% DivorcedWomen who gave birth in the past 12 months Now married:
100.0% (32)Unmarried:
0.0% (0)
Women who did not give birth in the past 12 months Now married:
42.7% (893)Unmarried:
57.3% (1,200)
Marital status - White alone, not Hispanic / Latino population 15 years and over
Males 29.5% Never married54.5% Now married0.1% Separated1.8% Widowed14.1% DivorcedFemales 22.7% Never married52.5% Now married1.0% Separated6.5% Widowed17.3% DivorcedWomen who gave birth in the past 12 months Now married:
47.5% (81)Unmarried:
52.5% (90)
Women who did not give birth in the past 12 months Now married:
50.9% (1,884)Unmarried:
49.1% (1,818)
Marital status - Hispanic or Latino population 15 years and over
Males 47.0% Never married48.5% Now married1.4% Separated0.0% Widowed3.2% DivorcedFemales 37.7% Never married53.5% Now married1.4% Separated0.0% Widowed7.4% DivorcedWomen who gave birth in the past 12 months Now married:
100.0% (75)Unmarried:
0.0% (0)
Women who did not give birth in the past 12 months Now married:
51.2% (797)Unmarried:
48.8% (760)
Ancestries in Spanaway
1,323 8.4% English996 6.3% American931 5.9% German698 4.4% Ukrainian586 3.7% Irish462 2.9% European362 2.3% Brazilian197 1.2% Norwegian128 0.8% Hungarian126 0.8% Scottish102 0.6% French Canadian89 0.6% African74 0.5% Polish63 0.4% Welsh58 0.4% Scandinavian56 0.4% Ugandan54 0.3% Portuguese53 0.3% Italian49 0.3% Romanian40 0.3% Jamaican37 0.2% Australian36 0.2% Finnish34 0.2% Northern European34 0.2% Swedish29 0.2% Dutch27 0.2% Greek23 0.1% Danish20 0.1% Pennsylvania German17 0.1% Czech11 0.07% French11 0.07% Russian6 0.04% Slavic6 0.04% British4 0.03% Scotch-Irish4 0.03% Czechoslovakian
Geographical mobility in Spanaway Same house 1 year ago 15,383 85.7% White (Caucasian)3,017 87.9% Black or African American255 82.7% American Indian / Alaska Native2,035 85.5% Asian1,403 98.1% Native Hawaiian / Pacific Islander1,148 74.1% Other race7,061 92.6% Two or more races14,344 87.0% White alone, not Hispanic / Latino4,751 77.2% Hispanic or LatinoMoved within same county 1,766 9.8% White / Caucasian162 4.7% Black or African American35 11.2% American Indian / Alaska Native208 8.7% Asian1 0.1% Native Hawaiian / Pacific Islander367 23.7% Other race457 6.0% Two or more races1,543 9.4% White alone, not Hispanic / Latino1,025 16.6% Hispanic or LatinoMoved within same state 247 1.4% White / Caucasian214 6.2% Black or African American40 1.7% Asian13 0.9% Native Hawaiian / Pacific Islander104 6.7% Other race148 1.9% Two or more races201 1.2% White alone, not Hispanic / Latino240 3.9% Hispanic or LatinoMoved from different state 417 2.3% White / Caucasian45 1.3% Black or African American17 5.6% American Indian / Alaska Native16 0.7% Asian16 1.1% Native Hawaiian / Pacific Islander64 0.8% Two or more races277 1.7% White alone, not Hispanic / Latino153 2.5% Hispanic or LatinoMoved from abroad 134 0.7% White25 1.7% Native Hawaiian / Pacific Islander113 0.7% White alone, not Hispanic / Latino9 0.1% Hispanic or Latino
Children Nativity (place of birth) in Spanaway
Children under 6 years - Living with two parents Both parents native 935 100.0% NativeBoth parents foreign-born 326 92.6% Native26 7.4% Foreign-bornOne native, one foreign-born parent 225 94.1% Native14 5.9% Foreign-bornChildren under 6 years - Living with one parent Native parent 945 100.0% NativeForeign-born parent 112 100.0% NativeChildren 6 to 17 years - Living with two parents Both parents native 2,356 100.0% NativeBoth parents foreign-born 933 53.9% Native798 46.1% Foreign-bornOne native, one foreign-born parent 616 100.0% NativeChildren 6 to 17 years - Living with one parent Native parent 1,667 100.0% NativeForeign-born parent 554 50.8% Native536 49.2% Foreign-born
Grandparents responsible for own grandchildren in Spanaway
Grandparents (30 to 59 years) White / Caucasian 38 15.4% Responsible for grandchildren209 84.6% Not responsible for grandchildrenBlack or African American 86 57.0% Responsible for grandchildren65 43.0% Not responsible for grandchildrenAmerican Indian / Alaska Native 6 100.0% Responsible for grandchildrenNative Hawaiian / Pacific Islander 1 57.4% Not responsible for grandchildrenTwo or more races 7 100.0% Not responsible for grandchildrenWhite alone, not Hispanic / Latino 33 14.5% Responsible for grandchildren196 85.5% Not responsible for grandchildrenHispanic or Latino 22 100.0% Not responsible for grandchildrenGrandparents (60 years and over) White / Caucasian 41 16.1% Responsible for grandchildren214 83.9% Not responsible for grandchildrenBlack or African American 54 77.2% Responsible for grandchildren16 22.8% Not responsible for grandchildrenNative Hawaiian / Pacific Islander 111 100.0% Not responsible for grandchildrenTwo or more races 15 100.0% Responsible for grandchildrenWhite alone, not Hispanic / Latino 28 12.8% Responsible for grandchildren193 87.2% Not responsible for grandchildrenHispanic or Latino 21 48.8% Responsible for grandchildren22 51.2% Not responsible for grandchildren