Races in Spring Creek-Beech Bluff, Tennessee (TN) Detailed Stats
Ancestries, Foreign-born residents, place of birth
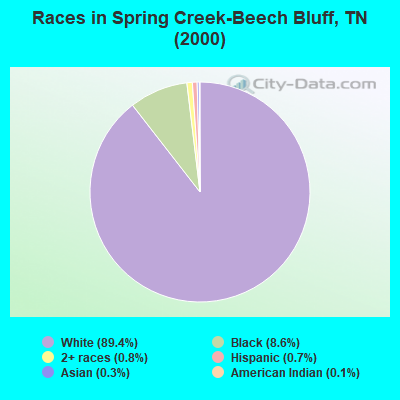
Race distribution in Spring Creek-Beech Bluff

- 7,71589.4%White alone
- 7388.6%Black alone
- 660.8%Two or more races
- 630.7%Hispanic
- 260.3%Asian alone
- 120.1%American Indian alone
- 80.09%Other race alone
2000
2022
-
- 4,505,93079.2%White alone
- 928,20416.3%Black alone
- 123,8382.2%Hispanic
- 54,8241.0%Two or more races
- 56,0771.0%Asian alone
- 13,8200.2%American Indian alone
- 4,7800.08%Other race alone
- 1,8100.03%Native Hawaiian and Other
Pacific Islander alone

-
- 5,070,02671.9%White alone
- 1,089,73815.5%Black alone
- 442,6296.3%Hispanic
- 279,3814.0%Two or more races
- 131,8171.9%Asian alone
- 26,9720.4%Other race alone
- 6,3870.09%American Indian alone
- 4,3890.06%Native Hawaiian and Other
Pacific Islander alone

Income and house value in Spring Creek-Beech Bluff
- Median household income in 2022
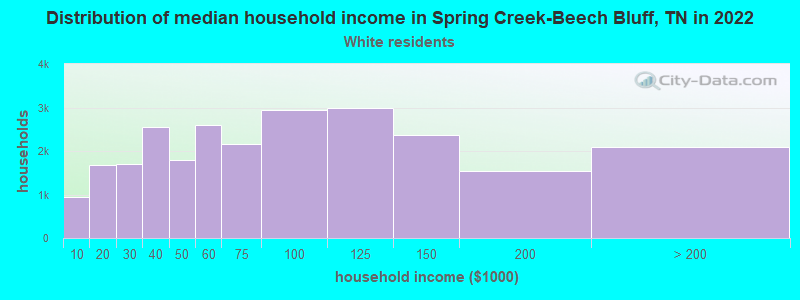
- $80,863White non-Hispanic householders
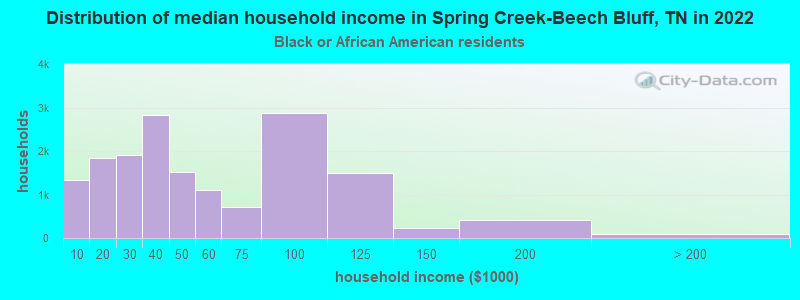
- $50,570Black householders
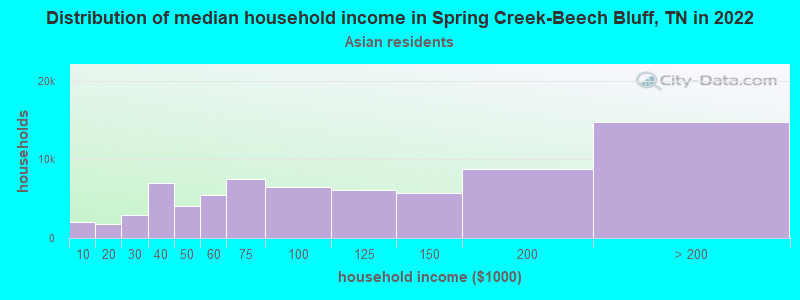
- $149,129Asian householders
- $44,359Some other race householders
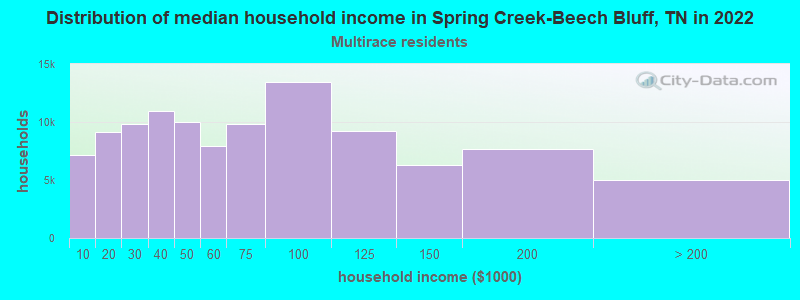
- $87,138Two or more races householders
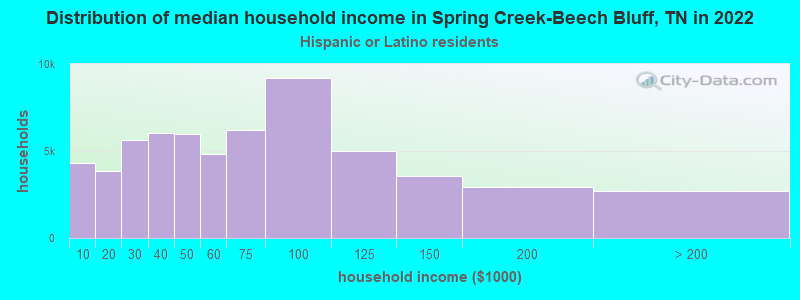
- $35,866Hispanic or Latino race householders
- Median 2022 house value
- $211,960White Non-Hispanic householders
- $161,595Black or African American householders
- $387,877Asian householders
- $234,636Two or more races householders
Household income for White non-Hispanic householders
Household income for Black householders
Household income for Asian householders
Household income for Two or more races householders
Household income for Hispanic or Latino race householders
Zip code: 38305