Races in Springdale, Ohio (OH) Detailed Stats
Ancestries, Foreign-born residents, place of birth
Settings
X


Recent posts about races in Springdale, Ohio on our local forum with over 2,400,000 registered users:
 | Refugees/migrants in Ohio (20 replies) |
| First impressions of Cincinnati (27 replies) |
| Wyoming house recommendations. Looking for quick info. (26 replies) |
| Need Info- Forest Park, Springdale, Fairfield area. (5 replies) |
| Liberty Center Mall Grand Opening (66 replies) |
| Monroe, Ohio Diverse & safe??? (8 replies) |
Latest news about races in Springdale, OH collected exclusively by city-data.com from local newspapers, TV, and radio stations
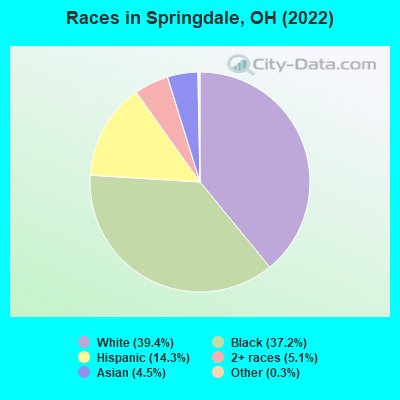
According to 2022 data, the most numerous races in Springdale, OH are White alone (4,321 residents), Black alone (4,081 residents), and Two or more races (557 residents). 80.1% of Springdale residents speak English at home. 20.1% of Springdale, OH residents are foreign-born (8.2% born in Latin America, 6.7% born in Africa, 4.0% born in Asia), which is 80.1% greater than the foreign-born rate of 4.0% across the entire state of Ohio.
Race distribution in Springdale
2000
2022

- 6,99966.3%White alone
- 2,69225.5%Black alone
- 3843.6%Hispanic
- 2672.5%Asian alone
- 1731.6%Two or more races
- 340.3%Other race alone
- 120.1%American Indian alone
- 20.02%Native Hawaiian and Other
Pacific Islander alone

-
- 4,32139.4%White alone
- 4,08137.2%Black alone
- 1,56914.3%Hispanic
- 5575.1%Two or more races
- 4984.5%Asian alone
- 370.3%Other race alone
2000
2022
-
- 9,538,11184.0%White alone
- 1,290,66211.4%Black alone
- 217,1231.9%Hispanic
- 137,7701.2%Two or more races
- 131,6701.2%Asian alone
- 21,9850.2%American Indian alone
- 13,4830.1%Other race alone
- 2,3360.02%Native Hawaiian and Other
Pacific Islander alone

-
- 8,948,79376.1%White alone
- 1,401,40311.9%Black alone
- 529,2914.5%Two or more races
- 517,2324.4%Hispanic
- 293,3872.5%Asian alone
- 52,8050.4%Other race alone
- 9,7850.08%American Indian alone
- 3,3620.03%Native Hawaiian and Other
Pacific Islander alone

Income and house value in Springdale
- Median household income in 2022
- $68,792White non-Hispanic householders
- $65,901Black householders
- $46,601Two or more races householders
- $24,286Hispanic or Latino race householders
- Median 2022 house value
- $184,213White Non-Hispanic householders
- $242,040Black or African American householders
- $397,885Asian householders
- $243,495Two or more races householders
Household income for White non-Hispanic householders

Household income for Black householders

Household income for Asian householders

Household income for Some other race householders

Household income for Two or more races householders

Household income for Hispanic or Latino race householders

Median age by race in Springdale
- 54.2Median age for White residents
- 53.8Males
- 54.7Females
- 32.1Median age for Black or African American residents
- 23.9Males
- 43.4Females
- 13.8Median age for American Indian / Alaska Native residents
- -622,116,148.9Males
- 17.8Females
- 32.8Median age for Asian residents
- 33.5Males
- 30.8Females
- -800,387,596.1Median age for Native Hawaiian / Pacific Islander residents
- -750,242,953.6Males
- -805,394,989.6Females
- 50.4Median age for Other race residents
- 51.3Males
- 0.0Females
- 24.1Median age for Two or more races residents
- 26.1Males
- 33.7Females
- 58.0Median age for White alone residents
- 57.2Males
- 61.1Females
- 25.5Median age for Hispanic or Latino residents
- 27.2Males
- 11.9Females
Owner/renter occupied households by race in Springdale
- House owners and renters - White residents
- 1,63970.1%Owner occupied
- 69829.9%Renter occupied
- House owners and renters - Black or African American residents
- 74652.4%Owner occupied
- 67947.6%Renter occupied
- House owners and renters - American Indian / Alaska Native residents
- 10100.0%Renter occupied
- House owners and renters - Asian residents
- 9451.7%Owner occupied
- 8848.3%Renter occupied
- House owners and renters - Other race residents
- 3263.1%Owner occupied
- 1936.9%Renter occupied
- House owners and renters - Two or more races residents
- 8438.6%Owner occupied
- 13461.4%Renter occupied
- House owners and renters - White alone residents
- 1,57873.1%Owner occupied
- 58226.9%Renter occupied
- House owners and renters - Hispanic or Latino residents
- 16539.2%Owner occupied
- 25760.8%Renter occupied
Language usage in Springdale
- English speakers - Total
- 80.1% of residents of Springdale speak English at home.
- 11.9% of residents speak Spanish at home
- 32927.3%Speak English very well
- 87872.7%Speak English less than very well
- 8.6% of residents speak other language at home
- 57566.4%Speak English very well
- 29133.6%Speak English less than very well
- English speakers - Born in the United States
- 98.7% of residents of Springdale speak English at home.
- 1.7% of residents speak Spanish at home
- 34100.0%Speak English very well
- English speakers - Native, born elsewhere
- 61.1% of residents of Springdale speak English at home.
- 27.6% of residents speak Spanish at home
- 51100.0%Speak English very well
- 19.5% of residents speak other language at home
- 36100.0%Speak English very well
- English speakers - Foreign-born
- 19.8% of residents of Springdale speak English at home.
- 48.1% of residents speak Spanish at home
- 878.5%Speak English very well
- 94091.5%Speak English less than very well
- 37.1% of residents speak other language at home
- 53968.1%Speak English very well
- 25331.9%Speak English less than very well
White (Caucasian) - Speak only English
| Native: | 95.7% (4,002) |
| Foreign-born: | 9.9% (61) |
White (Caucasian) - Speak another language
| Native: | 4.2% (177) |
| Foreign-born: | 85.2% (523) |
Black or African American - Speak only English
| Native: | 99.2% (3,158) |
| Foreign-born: | 63.0% (381) |
Black or African American - Speak another language
| Native: | 0.9% (28) |
| Foreign-born: | 48.5% (294) |
American Indian / Alaska Native - Speak another language
| Native: | 96.7% (16) |
| Foreign-born: | 96.6% (17) |
Other race - Speak another language
| Native: | 58.6% (72) |
| Foreign-born: | 100.0% (35) |
Two or more races - Speak another language
| Native: | 1.6% (9) |
| Foreign-born: | 96.5% (289) |
White alone - Speak only English
| Native: | 99.0% (3,890) |
| Foreign-born: | 83.2% (65) |
White alone - Speak another language
| Native: | 0.9% (35) |
| Foreign-born: | 24.9% (19) |
Hispanic or Latino - Speak another language
| Native: | 66.7% (273) |
| Foreign-born: | 100.0% (939) |
Foreign-born residents in Springdale
2,207 residents are foreign born (8.2% Latin America, 6.7% Africa, 4.0% Asia).
| This city: | 20.1% |
| Ohio: | 4.9% |


Marital status for residents in Springdale
Marital status - White (Caucasian) population 15 years and over
- Males
- 30.3%Never married
- 52.0%Now married
- 4.5%Separated
- 7.1%Widowed
- 6.1%Divorced
- Females
- 19.1%Never married
- 54.1%Now married
- 0.0%Separated
- 9.8%Widowed
- 17.0%Divorced
Women who gave birth in the past 12 months
| Now married: | 60.7% (69) |
| Unmarried: | 39.3% (45) |
Women who did not give birth in the past 12 months
| Now married: | 53.4% (308) |
| Unmarried: | 46.6% (269) |
Marital status - Black or African American population 15 years and over
- Males
- 66.1%Never married
- 27.4%Now married
- 0.0%Separated
- 1.7%Widowed
- 4.9%Divorced
- Females
- 50.8%Never married
- 20.9%Now married
- 2.7%Separated
- 10.6%Widowed
- 15.1%Divorced
Women who gave birth in the past 12 months
| Now married: | 34.5% (29) |
| Unmarried: | 65.5% (54) |
Women who did not give birth in the past 12 months
| Now married: | 14.9% (130) |
| Unmarried: | 85.1% (744) |
Marital status - American Indian / Alaska Native population 15 years and over
- Males
- 0.0%Never married
- 100.0%Now married
- 0.0%Separated
- 0.0%Widowed
- 0.0%Divorced
- Females
- 0.0%Never married
- 100.0%Now married
- 0.0%Separated
- 0.0%Widowed
- 0.0%Divorced
Women who did not give birth in the past 12 months
| Now married: | 100.0% (6) |
| Unmarried: | 0.0% (0) |
Marital status - Asian population 15 years and over
- Males
- 58.4%Never married
- 41.6%Now married
- 0.0%Separated
- 0.0%Widowed
- 0.0%Divorced
- Females
- 27.9%Never married
- 55.2%Now married
- 0.0%Separated
- 8.2%Widowed
- 8.7%Divorced
Women who did not give birth in the past 12 months
| Now married: | 66.4% (100) |
| Unmarried: | 33.6% (51) |
Marital status - Other race population 15 years and over
- Males
- 33.3%Never married
- 66.7%Now married
- 0.0%Separated
- 0.0%Widowed
- 0.0%Divorced
- Females
- 0.0%Never married
- 100.0%Now married
- 0.0%Separated
- 0.0%Widowed
- 0.0%Divorced
Marital status - Two or more races population 15 years and over
- Males
- 56.2%Never married
- 37.2%Now married
- 0.0%Separated
- 0.0%Widowed
- 6.6%Divorced
- Females
- 23.9%Never married
- 75.3%Now married
- 0.0%Separated
- 0.7%Widowed
- 0.0%Divorced
Women who did not give birth in the past 12 months
| Now married: | 73.3% (337) |
| Unmarried: | 26.7% (123) |
Marital status - White alone, not Hispanic / Latino population 15 years and over
- Males
- 20.6%Never married
- 58.4%Now married
- 5.3%Separated
- 8.4%Widowed
- 7.3%Divorced
- Females
- 13.6%Never married
- 56.9%Now married
- 0.0%Separated
- 10.8%Widowed
- 18.7%Divorced
Women who gave birth in the past 12 months
| Now married: | 100.0% (70) |
| Unmarried: | 0.0% (0) |
Women who did not give birth in the past 12 months
| Now married: | 59.8% (264) |
| Unmarried: | 40.2% (177) |
Marital status - Hispanic or Latino population 15 years and over
- Males
- 67.2%Never married
- 31.4%Now married
- 0.0%Separated
- 0.0%Widowed
- 1.4%Divorced
- Females
- 55.7%Never married
- 44.3%Now married
- 0.0%Separated
- 0.0%Widowed
- 0.0%Divorced
Women who gave birth in the past 12 months
| Now married: | 0.0% (0) |
| Unmarried: | 100.0% (51) |
Women who did not give birth in the past 12 months
| Now married: | 42.0% (96) |
| Unmarried: | 58.0% (133) |
Ancestries in Springdale

- 66810.1%German
- 5368.1%African
- 3855.8%English
- 2083.1%American
- 1973.0%Ethiopian
- 1051.6%Irish
- 440.7%Scottish
- 300.5%Jamaican
- 280.4%Italian
- 270.4%British
- 230.3%Nigerian
- 200.3%Canadian
- 200.3%Scandinavian
- 170.3%Swedish
- 100.2%Welsh

Geographical mobility in Springdale

- Same house 1 year ago
- 4,67191.0%White (Caucasian)
- 3,36383.9%Black or African American
- 34100.0%American Indian / Alaska Native
- 45390.4%Asian
- 15190.1%Other race
- 1,062100.0%Two or more races
- 3,96493.2%White alone, not Hispanic / Latino
- 1,29986.7%Hispanic or Latino

-
- Moved within same county
- 3005.8%White / Caucasian
- 3769.4%Black or African American
- 127.2%Other race
- 1603.8%White alone, not Hispanic / Latino
- 18412.3%Hispanic or Latino

-
- Moved within same state
- 941.8%White / Caucasian
- 962.3%White alone, not Hispanic / Latino

-
- Moved from different state
- 761.5%White / Caucasian
- 711.8%Black or African American
- 244.8%Asian
- 761.8%White alone, not Hispanic / Latino

-
- Moved from abroad
- 1503.8%Black or African American
- 346.8%Asian

Children Nativity (place of birth) in Springdale
Place of birth for residents in Springdale
![Place of birth for the foreign-born population - Regions]()
- 965Americas
- 918Latin America
- 752Africa
- 734Central America
- 493Western Africa
- 450Asia
- 277South Central Asia
- 200Southern Africa
- 157South Eastern Asia
- 114South America
- 69Caribbean
- 58Eastern Africa
- 47Northern America
- 38Europe
- 25Northern Europe
- 15Eastern Asia
- 15China
- 13Eastern Europe

![Place of birth for the foreign-born population - Countries]()
- 375Guatemala
- 338Mexico
- 272Senegal
- 157Philippines
- 114Colombia
- 110Nepal
- 96Nigeria
- 73Bhutan
- 71India
- 69Dominican Republic
- 58Ethiopia
- 47Canada
- 37Ghana
- 25England
- 21Pakistan
- 19Honduras
- 15Taiwan

Grandparents responsible for own grandchildren in Springdale
Zip codes: 45246.