Races in St. Augustine, Florida (FL) Detailed Stats
Data:
Races - White alone (%)
Races - White alone (% change since 2000)
Races - Black alone (%)
Races - Black alone (% change since 2000)
Races - American Indian alone (%)
Races - American Indian alone (% change since 2000)
Races - Asian alone (%)
Races - Asian alone (% change since 2000)
Races - Hispanic (%)
Races - Hispanic (% change since 2000)
Races - Native Hawaiian and Other Pacific Islander alone (%)
Races - Native Hawaiian and Other Pacific Islander alone (% change since 2000)
Races - Two or more races(%)
Races - Two or more races(% change since 2000)
Races - Other race alone (%)
Races - Other race alone (% change since 2000)
Racial diversity
Place of birth - Born in state of residence (%)
Place of birth - Born in state of residence (%) - White
Place of birth - Born in state of residence (%) - Black or African American
Place of birth - Born in state of residence (%) - Asian
Place of birth - Born in state of residence (%) - Hispanic or Latino
Place of birth - Born in state of residence (%) - American Indian and Alaska Native
Place of birth - Born in state of residence (%) - Multirace
Place of birth - Born in state of residence (%) - Other Race
Place of birth - Born in other state (%)
Place of birth - Born in other state (%) - White
Place of birth - Born in other state (%) - Black or African American
Place of birth - Born in other state (%) - Asian
Place of birth - Born in other state (%) - Hispanic or Latino
Place of birth - Born in other state (%) - American Indian and Alaska Native
Place of birth - Born in other state (%) - Multirace
Place of birth - Born in other state (%) - Other Race
Place of birth - Native, outside of US (%)
Place of birth - Native, outside of US (%) - White
Place of birth - Native, outside of US (%) - Black or African American
Place of birth - Native, outside of US (%) - Asian
Place of birth - Native, outside of US (%) - Hispanic or Latino
Place of birth - Native, outside of US (%) - American Indian and Alaska Native
Place of birth - Native, outside of US (%) - Multirace
Place of birth - Native, outside of US (%) - Other Race
Place of birth - Foreign born (%)
Place of birth - Foreign born (%) - White
Place of birth - Foreign born (%) - Black or African American
Place of birth - Foreign born (%) - Asian
Place of birth - Foreign born (%) - Hispanic or Latino
Place of birth - Foreign born (%) - American Indian and Alaska Native
Place of birth - Foreign born (%) - Multirace
Place of birth - Foreign born (%) - Other Race
Residents speaking English at home (%)
Residents speaking English at home - Born in the United States (%)
Residents speaking English at home - Native, born elsewhere (%)
Residents speaking English at home - Foreign born (%)
Residents speaking Spanish at home (%)
Residents speaking Spanish at home - Born in the United States (%)
Residents speaking Spanish at home - Native, born elsewhere (%)
Residents speaking Spanish at home - Foreign born (%)
Residents speaking other language at home (%)
Residents speaking other language at home - Born in the United States (%)
Residents speaking other language at home - Native, born elsewhere (%)
Residents speaking other language at home - Foreign born (%)
Marital status - Never married (%)
Marital status - Now married (%)
Marital status - Separated (%)
Marital status - Widowed (%)
Marital status - Divorced (%)
Ancestries Reported - Arab (%)
Ancestries Reported - Czech (%)
Ancestries Reported - Danish (%)
Ancestries Reported - Dutch (%)
Ancestries Reported - English (%)
Ancestries Reported - French (%)
Ancestries Reported - French Canadian (%)
Ancestries Reported - German (%)
Ancestries Reported - Greek (%)
Ancestries Reported - Hungarian (%)
Ancestries Reported - Irish (%)
Ancestries Reported - Italian (%)
Ancestries Reported - Lithuanian (%)
Ancestries Reported - Norwegian (%)
Ancestries Reported - Polish (%)
Ancestries Reported - Portuguese (%)
Ancestries Reported - Russian (%)
Ancestries Reported - Scotch-Irish (%)
Ancestries Reported - Scottish (%)
Ancestries Reported - Slovak (%)
Ancestries Reported - Subsaharan African (%)
Ancestries Reported - Swedish (%)
Ancestries Reported - Swiss (%)
Ancestries Reported - Ukrainian (%)
Ancestries Reported - United States (%)
Ancestries Reported - Welsh (%)
Ancestries Reported - West Indian (%)
Ancestries Reported - Other (%)
Geographical mobility - Same house 1 year ago (%)
Geographical mobility - Same house 1 year ago (%) - White
Geographical mobility - Same house 1 year ago (%) - Black or African American
Geographical mobility - Same house 1 year ago (%) - Asian
Geographical mobility - Same house 1 year ago (%) - Hispanic or Latino
Geographical mobility - Same house 1 year ago (%) - American Indian and Alaska Native
Geographical mobility - Same house 1 year ago (%) - Multirace
Geographical mobility - Same house 1 year ago (%) - Other Race
Geographical mobility - Moved within same county (%)
Geographical mobility - Moved within same county (%) - White
Geographical mobility - Moved within same county (%) - Black or African American
Geographical mobility - Moved within same county (%) - Asian
Geographical mobility - Moved within same county (%) - Hispanic or Latino
Geographical mobility - Moved within same county (%) - American Indian and Alaska Native
Geographical mobility - Moved within same county (%) - Multirace
Geographical mobility - Moved within same county (%) - Other Race
Geographical mobility - Moved from different county within same state (%)
Geographical mobility - Moved from different county within same state (%) - White
Geographical mobility - Moved from different county within same state (%) - Black or African American
Geographical mobility - Moved from different county within same state (%) - Asian
Geographical mobility - Moved from different county within same state (%) - Hispanic or Latino
Geographical mobility - Moved from different county within same state (%) - American Indian and Alaska Native
Geographical mobility - Moved from different county within same state (%) - Multirace
Geographical mobility - Moved from different county within same state (%) - Other Race
Geographical mobility - Moved from different state (%)
Geographical mobility - Moved from different state (%) - White
Geographical mobility - Moved from different state (%) - Black or African American
Geographical mobility - Moved from different state (%) - Asian
Geographical mobility - Moved from different state (%) - Hispanic or Latino
Geographical mobility - Moved from different state (%) - American Indian and Alaska Native
Geographical mobility - Moved from different state (%) - Multirace
Geographical mobility - Moved from different state (%) - Other Race
Geographical mobility - Moved from abroad (%)
Geographical mobility - Moved from abroad (%) - White
Geographical mobility - Moved from abroad (%) - Black or African American
Geographical mobility - Moved from abroad (%) - Asian
Geographical mobility - Moved from abroad (%) - Hispanic or Latino
Geographical mobility - Moved from abroad (%) - American Indian and Alaska Native
Geographical mobility - Moved from abroad (%) - Multirace
Geographical mobility - Moved from abroad (%) - Other Race
Place of birth for the foreign-born population - Ireland (%)
Place of birth for the foreign-born population - Denmark (%)
Place of birth for the foreign-born population - Norway (%)
Place of birth for the foreign-born population - Sweden (%)
Place of birth for the foreign-born population - United Kingdom (%)
Place of birth for the foreign-born population - England (%)
Place of birth for the foreign-born population - Scotland (%)
Place of birth for the foreign-born population - Other Northern Europe (%)
Place of birth for the foreign-born population - Austria (%)
Place of birth for the foreign-born population - Belgium (%)
Place of birth for the foreign-born population - France (%)
Place of birth for the foreign-born population - Germany (%)
Place of birth for the foreign-born population - Netherlands (%)
Place of birth for the foreign-born population - Switzerland (%)
Place of birth for the foreign-born population - Other Western Europe (%)
Place of birth for the foreign-born population - Greece (%)
Place of birth for the foreign-born population - Italy (%)
Place of birth for the foreign-born population - Portugal (%)
Place of birth for the foreign-born population - Spain (%)
Place of birth for the foreign-born population - Other Southern Europe (%)
Place of birth for the foreign-born population - Albania (%)
Place of birth for the foreign-born population - Belarus (%)
Place of birth for the foreign-born population - Bosnia and Herzegovina (%)
Place of birth for the foreign-born population - Bulgaria (%)
Place of birth for the foreign-born population - Croatia (%)
Place of birth for the foreign-born population - Czechoslovakia (%)
Place of birth for the foreign-born population - Hungary (%)
Place of birth for the foreign-born population - Latvia (%)
Place of birth for the foreign-born population - Lithuania (%)
Place of birth for the foreign-born population - North Macedonia (Macedonia) (%)
Place of birth for the foreign-born population - Moldova (%)
Place of birth for the foreign-born population - Poland (%)
Place of birth for the foreign-born population - Romania (%)
Place of birth for the foreign-born population - Russia (%)
Place of birth for the foreign-born population - Serbia (%)
Place of birth for the foreign-born population - Ukraine (%)
Place of birth for the foreign-born population - Other Eastern Europe (%)
Place of birth for the foreign-born population - China (%)
Place of birth for the foreign-born population - Hong Kong (%)
Place of birth for the foreign-born population - Taiwan (%)
Place of birth for the foreign-born population - Japan (%)
Place of birth for the foreign-born population - Korea (%)
Place of birth for the foreign-born population - Other Eastern Asia (%)
Place of birth for the foreign-born population - Afghanistan (%)
Place of birth for the foreign-born population - Bangladesh (%)
Place of birth for the foreign-born population - India (%)
Place of birth for the foreign-born population - Iran (%)
Place of birth for the foreign-born population - Kazakhstan (%)
Place of birth for the foreign-born population - Nepal (%)
Place of birth for the foreign-born population - Pakistan (%)
Place of birth for the foreign-born population - Sri Lanka (%)
Place of birth for the foreign-born population - Uzbekistan (%)
Place of birth for the foreign-born population - Other South Central Asia (%)
Place of birth for the foreign-born population - Burma (%)
Place of birth for the foreign-born population - Cambodia (%)
Place of birth for the foreign-born population - Indonesia (%)
Place of birth for the foreign-born population - Laos (%)
Place of birth for the foreign-born population - Malaysia (%)
Place of birth for the foreign-born population - Philippines (%)
Place of birth for the foreign-born population - Singapore (%)
Place of birth for the foreign-born population - Thailand (%)
Place of birth for the foreign-born population - Vietnam (%)
Place of birth for the foreign-born population - Other South Eastern Asia (%)
Place of birth for the foreign-born population - Armenia (%)
Place of birth for the foreign-born population - Iraq (%)
Place of birth for the foreign-born population - Israel (%)
Place of birth for the foreign-born population - Jordan (%)
Place of birth for the foreign-born population - Kuwait (%)
Place of birth for the foreign-born population - Lebanon (%)
Place of birth for the foreign-born population - Saudi Arabia (%)
Place of birth for the foreign-born population - Syria (%)
Place of birth for the foreign-born population - Turkey (%)
Place of birth for the foreign-born population - Yemen (%)
Place of birth for the foreign-born population - Other Western Asia (%)
Place of birth for the foreign-born population - Eritrea (%)
Place of birth for the foreign-born population - Ethiopia (%)
Place of birth for the foreign-born population - Kenya (%)
Place of birth for the foreign-born population - Somalia (%)
Place of birth for the foreign-born population - Uganda (%)
Place of birth for the foreign-born population - Zimbabwe (%)
Place of birth for the foreign-born population - Other Eastern Africa (%)
Place of birth for the foreign-born population - Cameroon (%)
Place of birth for the foreign-born population - Congo (%)
Place of birth for the foreign-born population - Democratic Republic of Congo (Zaire) (%)
Place of birth for the foreign-born population - Other Middle Africa (%)
Place of birth for the foreign-born population - Egypt (%)
Place of birth for the foreign-born population - Morocco (%)
Place of birth for the foreign-born population - Sudan (%)
Place of birth for the foreign-born population - Other Northern Africa (%)
Place of birth for the foreign-born population - South Africa (%)
Place of birth for the foreign-born population - Other Southern Africa (%)
Place of birth for the foreign-born population - Cabo Verde (%)
Place of birth for the foreign-born population - Ghana (%)
Place of birth for the foreign-born population - Liberia (%)
Place of birth for the foreign-born population - Nigeria (%)
Place of birth for the foreign-born population - Senegal (%)
Place of birth for the foreign-born population - Sierra Leone (%)
Place of birth for the foreign-born population - Other Western Africa (%)
Place of birth for the foreign-born population - Australia (%)
Place of birth for the foreign-born population - New Zealand (%)
Place of birth for the foreign-born population - Fiji (%)
Place of birth for the foreign-born population - Micronesia (%)
Place of birth for the foreign-born population - Bahamas (%)
Place of birth for the foreign-born population - Barbados (%)
Place of birth for the foreign-born population - Cuba (%)
Place of birth for the foreign-born population - Dominica (%)
Place of birth for the foreign-born population - Dominican Republic (%)
Place of birth for the foreign-born population - Grenada (%)
Place of birth for the foreign-born population - Haiti (%)
Place of birth for the foreign-born population - Jamaica (%)
Place of birth for the foreign-born population - St. Vincent and the Grenadines (%)
Place of birth for the foreign-born population - Trinidad and Tobago (%)
Place of birth for the foreign-born population - West Indies (%)
Place of birth for the foreign-born population - Other Caribbean (%)
Place of birth for the foreign-born population - Belize (%)
Place of birth for the foreign-born population - Costa Rica (%)
Place of birth for the foreign-born population - El Salvador (%)
Place of birth for the foreign-born population - Guatemala (%)
Place of birth for the foreign-born population - Honduras (%)
Place of birth for the foreign-born population - Mexico (%)
Place of birth for the foreign-born population - Nicaragua (%)
Place of birth for the foreign-born population - Panama (%)
Place of birth for the foreign-born population - Other Central America (%)
Place of birth for the foreign-born population - Argentina (%)
Place of birth for the foreign-born population - Bolivia (%)
Place of birth for the foreign-born population - Brazil (%)
Place of birth for the foreign-born population - Chile (%)
Place of birth for the foreign-born population - Colombia (%)
Place of birth for the foreign-born population - Ecuador (%)
Place of birth for the foreign-born population - Guyana (%)
Place of birth for the foreign-born population - Peru (%)
Place of birth for the foreign-born population - Uruguay (%)
Place of birth for the foreign-born population - Venezuela (%)
Place of birth for the foreign-born population - Other South America (%)
Place of birth for the foreign-born population - Canada (%)
Place of birth for the foreign-born population - Other Northern America (%)
Place of birth for the foreign-born population - Other (%)
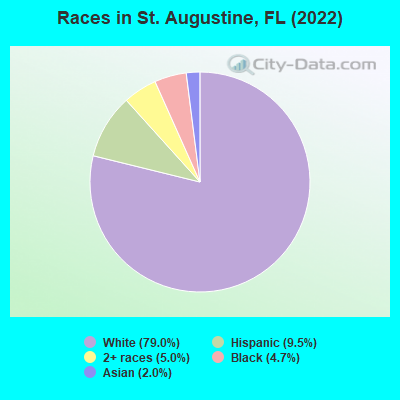
According to 2022 data, the most numerous races in St. Augustine, FL are White alone (12,728 residents), Hispanic (1,534 residents), and Black alone (765 residents). 87.9% of St. Augustine residents speak English at home. 8.1% of St. Augustine, FL residents are foreign-born (4.0% born in Latin America, 1.7% born in Europe, 1.6% born in Asia), which is 160.0% less than the foreign-born rate of 21.0% across the entire state of Florida.
Race distribution in St. Augustine
2000 2022
10,458,509 65.4% White alone 2,682,715 16.8% Hispanic 2,264,268 14.2% Black alone 261,693 1.6% Asian alone 236,954 1.5% Two or more races 42,358 0.3% American Indian alone 28,994 0.2% Other race alone 6,887 0.04% Native Hawaiian and Other
11,309,403 50.8% White alone 6,025,039 27.1% Hispanic 3,241,015 14.6% Black alone 861,630 3.9% Two or more races 623,692 2.8% Asian alone 152,054 0.7% Other race alone 22,504 0.1% American Indian alone 9,486 0.04% Native Hawaiian and Other
Income and house value in St. Augustine Median household income in 2022 $76,606 White non-Hispanic householders$76,997 Black householders$35,735 Asian householders$70,142 Two or more races householders$83,933 Hispanic or Latino race householdersMedian 2022 house value $462,134 White Non-Hispanic householders$270,984 Black or African American householders $576,450 Asian householders$609,058 Some other race householdersover $1,000,000 Two or more races householders$386,424 Hispanic or Latino householders
Median age by race in St. Augustine
49.4 Median age for White residents48.0 52.2 47.2 Median age for Black or African American residents47.7 32.6 -801,364,023.1 Median age for American Indian / Alaska Native residents-611,418,047.3 -594,925,633.7 56.8 Median age for Asian residents62.4 38.3 -679,849,340.2 Median age for Native Hawaiian / Pacific Islander residents-666,666,666.0 -443,298,968.6 38.1 Median age for Other race residents43.1 34.0 44.6 Median age for Two or more races residents49.0 42.0 49.2 Median age for White alone residents47.2 52.1 36.9 Median age for Hispanic or Latino residents46.3 29.1
Owner/renter occupied households by race in St. Augustine
House owners and renters - White residents 3,956 69.5% Owner occupied1,736 30.5% Renter occupiedHouse owners and renters - Black or African American residents 209 67.0% Owner occupied103 33.0% Renter occupiedHouse owners and renters - Asian residents 140 85.3% Owner occupied24 14.7% Renter occupiedHouse owners and renters - Other race residents 29 39.0% Owner occupied45 61.0% Renter occupiedHouse owners and renters - Two or more races residents 266 77.6% Owner occupied77 22.4% Renter occupiedHouse owners and renters - White alone residents 3,810 68.8% Owner occupied1,731 31.2% Renter occupiedHouse owners and renters - Hispanic or Latino residents 395 81.9% Owner occupied87 18.1% Renter occupied
Language usage in St. Augustine
English speakers - Total 87.9% of residents of St. Augustine speak English at home.
5.6% of residents speak Spanish at home 628 69.9% Speak English very well270 30.1% Speak English less than very well6.2% of residents speak other language at home 625 62.8% Speak English very well370 37.2% Speak English less than very well
English speakers - Born in the United States 93.9% of residents of St. Augustine speak English at home.
4.3% of residents speak Spanish at home 335 87.7% Speak English very well47 12.3% Speak English less than very well2.1% of residents speak other language at home 118 62.8% Speak English very well70 37.2% Speak English less than very well
English speakers - Native, born elsewhere 77.0% of residents of St. Augustine speak English at home.
11.0% of residents speak Spanish at home 3 9.7% Speak English very well28 90.3% Speak English less than very well9.9% of residents speak other language at home 4 14.3% Speak English very well24 85.7% Speak English less than very well
English speakers - Foreign-born 17.7% of residents of St. Augustine speak English at home.
36.0% of residents speak Spanish at home 214 41.6% Speak English very well300 58.4% Speak English less than very well49.3% of residents speak other language at home 452 64.1% Speak English very well253 35.9% Speak English less than very well
White (Caucasian) - Speak only English Native:
97.6% (12,008)Foreign-born:
25.5% (169)
White (Caucasian) - Speak another language Native:
2.3% (289)Foreign-born:
74.7% (496)
Black or African American - Speak another language Native:
8.9% (61)Foreign-born:
100.0% (32)
Asian - Speak only English Native:
56.7% (35)Foreign-born:
9.4% (29)
Asian - Speak another language Native:
30.3% (18)Foreign-born:
91.1% (279)
Other race - Speak another language Native:
78.8% (246)Foreign-born:
94.1% (102)
Two or more races - Speak only English Native:
74.1% (873)Foreign-born:
10.6% (24)
Two or more races - Speak another language Native:
25.3% (298)Foreign-born:
68.6% (157)
White alone - Speak only English Native:
98.0% (11,931)Foreign-born:
38.4% (162)
White alone - Speak another language Native:
2.0% (247)Foreign-born:
62.7% (265)
Hispanic or Latino - Speak only English Native:
56.2% (580)Foreign-born:
7.2% (34)
Hispanic or Latino - Speak another language Native:
41.5% (428)Foreign-born:
86.4% (403)
Foreign-born residents in St. Augustine 1,302 residents are foreign born (4.0% Latin America , 1.7% Europe , 1.6% Asia ).
This city:
8.1%Florida:
21.1%
Marital status for residents in St. Augustine Marital status - White (Caucasian) population 15 years and over
Males 42.5% Never married43.3% Now married1.5% Separated3.5% Widowed9.3% DivorcedFemales 40.6% Never married33.2% Now married1.3% Separated11.0% Widowed13.9% DivorcedWomen who gave birth in the past 12 months Now married:
100.0% (39)Unmarried:
0.0% (0)
Women who did not give birth in the past 12 months Now married:
20.1% (666)Unmarried:
79.9% (2,646)
Marital status - Black or African American population 15 years and over
Males 61.1% Never married35.0% Now married0.0% Separated3.9% Widowed0.0% DivorcedFemales 32.1% Never married21.9% Now married0.0% Separated25.4% Widowed20.6% DivorcedWomen who did not give birth in the past 12 months Now married:
18.5% (40)Unmarried:
81.5% (176)
Marital status - Asian population 15 years and over
Males 20.5% Never married73.3% Now married0.0% Separated0.0% Widowed6.2% DivorcedFemales 43.2% Never married50.0% Now married0.0% Separated0.0% Widowed6.8% DivorcedWomen who did not give birth in the past 12 months Now married:
20.4% (23)Unmarried:
79.6% (91)
Marital status - Other race population 15 years and over
Males 100.0% Never married0.0% Now married0.0% Separated0.0% Widowed0.0% DivorcedFemales 81.2% Never married2.7% Now married0.0% Separated0.0% Widowed16.1% DivorcedWomen who did not give birth in the past 12 months Now married:
3.3% (7)Unmarried:
96.7% (208)
Marital status - Two or more races population 15 years and over
Males 47.0% Never married47.5% Now married0.0% Separated2.2% Widowed3.3% DivorcedFemales 44.3% Never married37.3% Now married0.0% Separated15.4% Widowed3.0% DivorcedWomen who did not give birth in the past 12 months Now married:
14.6% (41)Unmarried:
85.4% (241)
Marital status - White alone, not Hispanic / Latino population 15 years and over
Males 42.0% Never married43.1% Now married1.6% Separated3.6% Widowed9.7% DivorcedFemales 38.8% Never married34.3% Now married1.4% Separated11.3% Widowed14.2% DivorcedWomen who gave birth in the past 12 months Now married:
100.0% (40)Unmarried:
0.0% (0)
Women who did not give birth in the past 12 months Now married:
20.1% (633)Unmarried:
79.9% (2,520)
Marital status - Hispanic or Latino population 15 years and over
Males 43.4% Never married54.5% Now married0.0% Separated2.1% Widowed0.0% DivorcedFemales 65.9% Never married22.4% Now married0.0% Separated2.6% Widowed9.1% DivorcedWomen who did not give birth in the past 12 months Now married:
15.4% (104)Unmarried:
84.6% (572)
Ancestries in St. Augustine
1,165 16.8% English1,112 16.1% American546 7.9% Irish437 6.3% German343 5.0% Italian218 3.1% Polish143 2.1% British130 1.9% European126 1.8% French89 1.3% Scottish88 1.3% French Canadian84 1.2% Norwegian78 1.1% Dutch69 1.0% Brazilian68 1.0% Eastern European55 0.8% Scotch-Irish47 0.7% Greek44 0.6% Northern European33 0.5% Swedish31 0.4% African28 0.4% Ukrainian27 0.4% Haitian26 0.4% Swiss25 0.4% Hungarian24 0.3% Russian22 0.3% Portuguese21 0.3% Canadian18 0.3% Romanian14 0.2% Welsh11 0.2% Slovak9 0.1% Croatian8 0.1% Scandinavian5 0.07% Syrian
Children Nativity (place of birth) in St. Augustine
Children under 6 years - Living with two parents Both parents native 170 100.0% NativeBoth parents foreign-born 7 100.0% NativeOne native, one foreign-born parent 44 100.0% NativeChildren under 6 years - Living with one parent Native parent 59 100.0% NativeChildren 6 to 17 years - Living with two parents Both parents native 391 98.8% Native5 1.2% Foreign-bornBoth parents foreign-born 40 24.0% Native127 76.0% Foreign-bornOne native, one foreign-born parent 42 100.0% NativeChildren 6 to 17 years - Living with one parent Native parent 219 100.0% NativeForeign-born parent 21 53.5% Native18 46.5% Foreign-born