Races in St. Peter, Minnesota (MN) Detailed Stats
Data:
Races - White alone (%)
Races - White alone (% change since 2000)
Races - Black alone (%)
Races - Black alone (% change since 2000)
Races - American Indian alone (%)
Races - American Indian alone (% change since 2000)
Races - Asian alone (%)
Races - Asian alone (% change since 2000)
Races - Hispanic (%)
Races - Hispanic (% change since 2000)
Races - Native Hawaiian and Other Pacific Islander alone (%)
Races - Native Hawaiian and Other Pacific Islander alone (% change since 2000)
Races - Two or more races(%)
Races - Two or more races(% change since 2000)
Races - Other race alone (%)
Races - Other race alone (% change since 2000)
Racial diversity
Place of birth - Born in state of residence (%)
Place of birth - Born in state of residence (%) - White
Place of birth - Born in state of residence (%) - Black or African American
Place of birth - Born in state of residence (%) - Asian
Place of birth - Born in state of residence (%) - Hispanic or Latino
Place of birth - Born in state of residence (%) - American Indian and Alaska Native
Place of birth - Born in state of residence (%) - Multirace
Place of birth - Born in state of residence (%) - Other Race
Place of birth - Born in other state (%)
Place of birth - Born in other state (%) - White
Place of birth - Born in other state (%) - Black or African American
Place of birth - Born in other state (%) - Asian
Place of birth - Born in other state (%) - Hispanic or Latino
Place of birth - Born in other state (%) - American Indian and Alaska Native
Place of birth - Born in other state (%) - Multirace
Place of birth - Born in other state (%) - Other Race
Place of birth - Native, outside of US (%)
Place of birth - Native, outside of US (%) - White
Place of birth - Native, outside of US (%) - Black or African American
Place of birth - Native, outside of US (%) - Asian
Place of birth - Native, outside of US (%) - Hispanic or Latino
Place of birth - Native, outside of US (%) - American Indian and Alaska Native
Place of birth - Native, outside of US (%) - Multirace
Place of birth - Native, outside of US (%) - Other Race
Place of birth - Foreign born (%)
Place of birth - Foreign born (%) - White
Place of birth - Foreign born (%) - Black or African American
Place of birth - Foreign born (%) - Asian
Place of birth - Foreign born (%) - Hispanic or Latino
Place of birth - Foreign born (%) - American Indian and Alaska Native
Place of birth - Foreign born (%) - Multirace
Place of birth - Foreign born (%) - Other Race
Residents speaking English at home (%)
Residents speaking English at home - Born in the United States (%)
Residents speaking English at home - Native, born elsewhere (%)
Residents speaking English at home - Foreign born (%)
Residents speaking Spanish at home (%)
Residents speaking Spanish at home - Born in the United States (%)
Residents speaking Spanish at home - Native, born elsewhere (%)
Residents speaking Spanish at home - Foreign born (%)
Residents speaking other language at home (%)
Residents speaking other language at home - Born in the United States (%)
Residents speaking other language at home - Native, born elsewhere (%)
Residents speaking other language at home - Foreign born (%)
Marital status - Never married (%)
Marital status - Now married (%)
Marital status - Separated (%)
Marital status - Widowed (%)
Marital status - Divorced (%)
Ancestries Reported - Arab (%)
Ancestries Reported - Czech (%)
Ancestries Reported - Danish (%)
Ancestries Reported - Dutch (%)
Ancestries Reported - English (%)
Ancestries Reported - French (%)
Ancestries Reported - French Canadian (%)
Ancestries Reported - German (%)
Ancestries Reported - Greek (%)
Ancestries Reported - Hungarian (%)
Ancestries Reported - Irish (%)
Ancestries Reported - Italian (%)
Ancestries Reported - Lithuanian (%)
Ancestries Reported - Norwegian (%)
Ancestries Reported - Polish (%)
Ancestries Reported - Portuguese (%)
Ancestries Reported - Russian (%)
Ancestries Reported - Scotch-Irish (%)
Ancestries Reported - Scottish (%)
Ancestries Reported - Slovak (%)
Ancestries Reported - Subsaharan African (%)
Ancestries Reported - Swedish (%)
Ancestries Reported - Swiss (%)
Ancestries Reported - Ukrainian (%)
Ancestries Reported - United States (%)
Ancestries Reported - Welsh (%)
Ancestries Reported - West Indian (%)
Ancestries Reported - Other (%)
Geographical mobility - Same house 1 year ago (%)
Geographical mobility - Same house 1 year ago (%) - White
Geographical mobility - Same house 1 year ago (%) - Black or African American
Geographical mobility - Same house 1 year ago (%) - Asian
Geographical mobility - Same house 1 year ago (%) - Hispanic or Latino
Geographical mobility - Same house 1 year ago (%) - American Indian and Alaska Native
Geographical mobility - Same house 1 year ago (%) - Multirace
Geographical mobility - Same house 1 year ago (%) - Other Race
Geographical mobility - Moved within same county (%)
Geographical mobility - Moved within same county (%) - White
Geographical mobility - Moved within same county (%) - Black or African American
Geographical mobility - Moved within same county (%) - Asian
Geographical mobility - Moved within same county (%) - Hispanic or Latino
Geographical mobility - Moved within same county (%) - American Indian and Alaska Native
Geographical mobility - Moved within same county (%) - Multirace
Geographical mobility - Moved within same county (%) - Other Race
Geographical mobility - Moved from different county within same state (%)
Geographical mobility - Moved from different county within same state (%) - White
Geographical mobility - Moved from different county within same state (%) - Black or African American
Geographical mobility - Moved from different county within same state (%) - Asian
Geographical mobility - Moved from different county within same state (%) - Hispanic or Latino
Geographical mobility - Moved from different county within same state (%) - American Indian and Alaska Native
Geographical mobility - Moved from different county within same state (%) - Multirace
Geographical mobility - Moved from different county within same state (%) - Other Race
Geographical mobility - Moved from different state (%)
Geographical mobility - Moved from different state (%) - White
Geographical mobility - Moved from different state (%) - Black or African American
Geographical mobility - Moved from different state (%) - Asian
Geographical mobility - Moved from different state (%) - Hispanic or Latino
Geographical mobility - Moved from different state (%) - American Indian and Alaska Native
Geographical mobility - Moved from different state (%) - Multirace
Geographical mobility - Moved from different state (%) - Other Race
Geographical mobility - Moved from abroad (%)
Geographical mobility - Moved from abroad (%) - White
Geographical mobility - Moved from abroad (%) - Black or African American
Geographical mobility - Moved from abroad (%) - Asian
Geographical mobility - Moved from abroad (%) - Hispanic or Latino
Geographical mobility - Moved from abroad (%) - American Indian and Alaska Native
Geographical mobility - Moved from abroad (%) - Multirace
Geographical mobility - Moved from abroad (%) - Other Race
Place of birth for the foreign-born population - Ireland (%)
Place of birth for the foreign-born population - Denmark (%)
Place of birth for the foreign-born population - Norway (%)
Place of birth for the foreign-born population - Sweden (%)
Place of birth for the foreign-born population - United Kingdom (%)
Place of birth for the foreign-born population - England (%)
Place of birth for the foreign-born population - Scotland (%)
Place of birth for the foreign-born population - Other Northern Europe (%)
Place of birth for the foreign-born population - Austria (%)
Place of birth for the foreign-born population - Belgium (%)
Place of birth for the foreign-born population - France (%)
Place of birth for the foreign-born population - Germany (%)
Place of birth for the foreign-born population - Netherlands (%)
Place of birth for the foreign-born population - Switzerland (%)
Place of birth for the foreign-born population - Other Western Europe (%)
Place of birth for the foreign-born population - Greece (%)
Place of birth for the foreign-born population - Italy (%)
Place of birth for the foreign-born population - Portugal (%)
Place of birth for the foreign-born population - Spain (%)
Place of birth for the foreign-born population - Other Southern Europe (%)
Place of birth for the foreign-born population - Albania (%)
Place of birth for the foreign-born population - Belarus (%)
Place of birth for the foreign-born population - Bosnia and Herzegovina (%)
Place of birth for the foreign-born population - Bulgaria (%)
Place of birth for the foreign-born population - Croatia (%)
Place of birth for the foreign-born population - Czechoslovakia (%)
Place of birth for the foreign-born population - Hungary (%)
Place of birth for the foreign-born population - Latvia (%)
Place of birth for the foreign-born population - Lithuania (%)
Place of birth for the foreign-born population - North Macedonia (Macedonia) (%)
Place of birth for the foreign-born population - Moldova (%)
Place of birth for the foreign-born population - Poland (%)
Place of birth for the foreign-born population - Romania (%)
Place of birth for the foreign-born population - Russia (%)
Place of birth for the foreign-born population - Serbia (%)
Place of birth for the foreign-born population - Ukraine (%)
Place of birth for the foreign-born population - Other Eastern Europe (%)
Place of birth for the foreign-born population - China (%)
Place of birth for the foreign-born population - Hong Kong (%)
Place of birth for the foreign-born population - Taiwan (%)
Place of birth for the foreign-born population - Japan (%)
Place of birth for the foreign-born population - Korea (%)
Place of birth for the foreign-born population - Other Eastern Asia (%)
Place of birth for the foreign-born population - Afghanistan (%)
Place of birth for the foreign-born population - Bangladesh (%)
Place of birth for the foreign-born population - India (%)
Place of birth for the foreign-born population - Iran (%)
Place of birth for the foreign-born population - Kazakhstan (%)
Place of birth for the foreign-born population - Nepal (%)
Place of birth for the foreign-born population - Pakistan (%)
Place of birth for the foreign-born population - Sri Lanka (%)
Place of birth for the foreign-born population - Uzbekistan (%)
Place of birth for the foreign-born population - Other South Central Asia (%)
Place of birth for the foreign-born population - Burma (%)
Place of birth for the foreign-born population - Cambodia (%)
Place of birth for the foreign-born population - Indonesia (%)
Place of birth for the foreign-born population - Laos (%)
Place of birth for the foreign-born population - Malaysia (%)
Place of birth for the foreign-born population - Philippines (%)
Place of birth for the foreign-born population - Singapore (%)
Place of birth for the foreign-born population - Thailand (%)
Place of birth for the foreign-born population - Vietnam (%)
Place of birth for the foreign-born population - Other South Eastern Asia (%)
Place of birth for the foreign-born population - Armenia (%)
Place of birth for the foreign-born population - Iraq (%)
Place of birth for the foreign-born population - Israel (%)
Place of birth for the foreign-born population - Jordan (%)
Place of birth for the foreign-born population - Kuwait (%)
Place of birth for the foreign-born population - Lebanon (%)
Place of birth for the foreign-born population - Saudi Arabia (%)
Place of birth for the foreign-born population - Syria (%)
Place of birth for the foreign-born population - Turkey (%)
Place of birth for the foreign-born population - Yemen (%)
Place of birth for the foreign-born population - Other Western Asia (%)
Place of birth for the foreign-born population - Eritrea (%)
Place of birth for the foreign-born population - Ethiopia (%)
Place of birth for the foreign-born population - Kenya (%)
Place of birth for the foreign-born population - Somalia (%)
Place of birth for the foreign-born population - Uganda (%)
Place of birth for the foreign-born population - Zimbabwe (%)
Place of birth for the foreign-born population - Other Eastern Africa (%)
Place of birth for the foreign-born population - Cameroon (%)
Place of birth for the foreign-born population - Congo (%)
Place of birth for the foreign-born population - Democratic Republic of Congo (Zaire) (%)
Place of birth for the foreign-born population - Other Middle Africa (%)
Place of birth for the foreign-born population - Egypt (%)
Place of birth for the foreign-born population - Morocco (%)
Place of birth for the foreign-born population - Sudan (%)
Place of birth for the foreign-born population - Other Northern Africa (%)
Place of birth for the foreign-born population - South Africa (%)
Place of birth for the foreign-born population - Other Southern Africa (%)
Place of birth for the foreign-born population - Cabo Verde (%)
Place of birth for the foreign-born population - Ghana (%)
Place of birth for the foreign-born population - Liberia (%)
Place of birth for the foreign-born population - Nigeria (%)
Place of birth for the foreign-born population - Senegal (%)
Place of birth for the foreign-born population - Sierra Leone (%)
Place of birth for the foreign-born population - Other Western Africa (%)
Place of birth for the foreign-born population - Australia (%)
Place of birth for the foreign-born population - New Zealand (%)
Place of birth for the foreign-born population - Fiji (%)
Place of birth for the foreign-born population - Micronesia (%)
Place of birth for the foreign-born population - Bahamas (%)
Place of birth for the foreign-born population - Barbados (%)
Place of birth for the foreign-born population - Cuba (%)
Place of birth for the foreign-born population - Dominica (%)
Place of birth for the foreign-born population - Dominican Republic (%)
Place of birth for the foreign-born population - Grenada (%)
Place of birth for the foreign-born population - Haiti (%)
Place of birth for the foreign-born population - Jamaica (%)
Place of birth for the foreign-born population - St. Vincent and the Grenadines (%)
Place of birth for the foreign-born population - Trinidad and Tobago (%)
Place of birth for the foreign-born population - West Indies (%)
Place of birth for the foreign-born population - Other Caribbean (%)
Place of birth for the foreign-born population - Belize (%)
Place of birth for the foreign-born population - Costa Rica (%)
Place of birth for the foreign-born population - El Salvador (%)
Place of birth for the foreign-born population - Guatemala (%)
Place of birth for the foreign-born population - Honduras (%)
Place of birth for the foreign-born population - Mexico (%)
Place of birth for the foreign-born population - Nicaragua (%)
Place of birth for the foreign-born population - Panama (%)
Place of birth for the foreign-born population - Other Central America (%)
Place of birth for the foreign-born population - Argentina (%)
Place of birth for the foreign-born population - Bolivia (%)
Place of birth for the foreign-born population - Brazil (%)
Place of birth for the foreign-born population - Chile (%)
Place of birth for the foreign-born population - Colombia (%)
Place of birth for the foreign-born population - Ecuador (%)
Place of birth for the foreign-born population - Guyana (%)
Place of birth for the foreign-born population - Peru (%)
Place of birth for the foreign-born population - Uruguay (%)
Place of birth for the foreign-born population - Venezuela (%)
Place of birth for the foreign-born population - Other South America (%)
Place of birth for the foreign-born population - Canada (%)
Place of birth for the foreign-born population - Other Northern America (%)
Place of birth for the foreign-born population - Other (%)
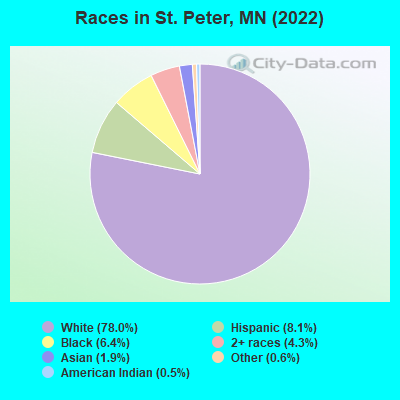
According to 2022 data, the most numerous races in St. Peter, MN are White alone (9,427 residents), Black alone (773 residents), and Hispanic (983 residents). 88.5% of St. Peter residents speak English at home. 6.6% of St. Peter, MN residents are foreign-born (2.6% born in Africa, 1.9% born in Latin America, 0.9% born in Europe, 0.9% born in Asia), which is 20.4% less than the foreign-born rate of 8.0% across the entire state of Minnesota.
Race distribution in St. Peter
2000 2022
4,337,143 88.2% White alone 168,813 3.4% Black alone 143,382 2.9% Hispanic 141,083 2.9% Asian alone 70,304 1.4% Two or more races 52,009 1.1% American Indian alone 5,031 0.1% Other race alone 1,714 0.03% Native Hawaiian and Other
4,356,347 76.2% White alone 395,179 6.9% Black alone 333,830 5.8% Hispanic 294,800 5.2% Asian alone 259,649 4.5% Two or more races 42,125 0.7% American Indian alone 32,976 0.6% Other race alone 2,278 0.04% Native Hawaiian and Other
Income and house value in St. Peter Median household income in 2022 $62,931 White non-Hispanic householders$127,158 Black householders$69,878 Asian householders$100,306 Two or more races householders$56,130 Hispanic or Latino race householdersMedian 2022 house value $253,958 White Non-Hispanic householders $46,694 Asian householders$23,821 Some other race householders$23,821 Hispanic or Latino householders
Median age by race in St. Peter
36.7 Median age for White residents36.6 37.1 35.6 Median age for Black or African American residents44.1 20.8 32.2 Median age for American Indian / Alaska Native residents31.7 -677,852,348.3 22.8 Median age for Asian residents23.8 22.4 -744,336,568.8 Median age for Native Hawaiian / Pacific Islander residents-856,799,036.4 -534,959,349.1 20.4 Median age for Other race residents8.9 20.5 26.1 Median age for Two or more races residents18.9 44.1 36.6 Median age for White alone residents36.2 37.3 23.3 Median age for Hispanic or Latino residents21.4 43.3
Owner/renter occupied households by race in St. Peter
House owners and renters - White residents 2,219 63.9% Owner occupied1,252 36.1% Renter occupiedHouse owners and renters - Black or African American residents 49 36.3% Owner occupied85 63.7% Renter occupiedHouse owners and renters - American Indian / Alaska Native residents 57 100.0% Owner occupiedHouse owners and renters - Asian residents 8 20.8% Owner occupied30 79.2% Renter occupiedHouse owners and renters - Other race residents 46 67.4% Owner occupied22 32.6% Renter occupiedHouse owners and renters - Two or more races residents 118 46.2% Owner occupied137 53.8% Renter occupiedHouse owners and renters - White alone residents 2,165 63.7% Owner occupied1,235 36.3% Renter occupiedHouse owners and renters - Hispanic or Latino residents 142 58.3% Owner occupied101 41.7% Renter occupied
Language usage in St. Peter
English speakers - Total 88.5% of residents of St. Peter speak English at home.
3.6% of residents speak Spanish at home 278 67.3% Speak English very well135 32.7% Speak English less than very well7.8% of residents speak other language at home 505 55.6% Speak English very well404 44.4% Speak English less than very well
English speakers - Born in the United States 92.3% of residents of St. Peter speak English at home.
3.7% of residents speak Spanish at home 82 80.4% Speak English very well20 19.6% Speak English less than very well3.8% of residents speak other language at home 102 98.1% Speak English very well2 1.9% Speak English less than very well
English speakers - Native, born elsewhere 67.2% of residents of St. Peter speak English at home.
20.4% of residents speak Spanish at home 38 100.0% Speak English very well10.8% of residents speak other language at home 20 100.0% Speak English less than very well
English speakers - Foreign-born 15.2% of residents of St. Peter speak English at home.
21.5% of residents speak Spanish at home 78 45.1% Speak English very well95 54.9% Speak English less than very well62.3% of residents speak other language at home 229 45.8% Speak English very well271 54.2% Speak English less than very well
White (Caucasian) - Speak only English Native:
97.2% (8,818)Foreign-born:
13.7% (28)
White (Caucasian) - Speak another language Native:
2.6% (238)Foreign-born:
77.8% (159)
Black or African American - Speak only English Native:
78.7% (301)Foreign-born:
11.8% (40)
Black or African American - Speak another language Native:
22.4% (86)Foreign-born:
89.0% (303)
Asian - Speak only English Native:
73.8% (112)Foreign-born:
45.1% (42)
Asian - Speak another language Native:
30.2% (46)Foreign-born:
53.7% (50)
Other race - Speak only English Native:
45.7% (66)Foreign-born:
13.7% (10)
Other race - Speak another language Native:
53.6% (78)Foreign-born:
86.1% (64)
Two or more races - Speak another language Native:
13.9% (130)Foreign-born:
100.0% (60)
White alone - Speak only English Native:
97.5% (8,758)Foreign-born:
23.3% (29)
White alone - Speak another language Native:
2.5% (222)Foreign-born:
74.8% (94)
Hispanic or Latino - Speak another language Native:
37.3% (237)Foreign-born:
96.9% (231)
Foreign-born residents in St. Peter 803 residents are foreign born (2.6% Africa , 1.9% Latin America , 0.9% Europe , 0.9% Asia ).
This city:
6.6%Minnesota:
8.5%
Marital status for residents in St. Peter Marital status - White (Caucasian) population 15 years and over
Males 51.0% Never married35.7% Now married0.2% Separated3.3% Widowed9.9% DivorcedFemales 39.1% Never married37.6% Now married0.0% Separated10.9% Widowed12.4% DivorcedWomen who gave birth in the past 12 months Now married:
82.6% (97)Unmarried:
17.4% (20)
Women who did not give birth in the past 12 months Now married:
25.3% (549)Unmarried:
74.7% (1,622)
Marital status - Black or African American population 15 years and over
Males 42.5% Never married26.4% Now married0.5% Separated0.0% Widowed30.6% DivorcedFemales 64.6% Never married29.2% Now married0.0% Separated0.0% Widowed6.2% DivorcedWomen who gave birth in the past 12 months Now married:
58.6% (18)Unmarried:
41.4% (12)
Women who did not give birth in the past 12 months Now married:
26.3% (45)Unmarried:
73.7% (127)
Marital status - American Indian / Alaska Native population 15 years and over
Males 99.0% Never married0.0% Now married1.0% Separated0.0% Widowed0.0% DivorcedFemales 93.8% Never married6.2% Now married0.0% Separated0.0% Widowed0.0% DivorcedWomen who did not give birth in the past 12 months Now married:
0.0% (0)Unmarried:
100.0% (16)
Marital status - Asian population 15 years and over
Males 79.0% Never married21.0% Now married0.0% Separated0.0% Widowed0.0% DivorcedFemales 83.3% Never married8.9% Now married0.0% Separated1.1% Widowed6.7% DivorcedWomen who did not give birth in the past 12 months Now married:
9.6% (8)Unmarried:
90.4% (77)
Marital status - Other race population 15 years and over
Males 64.1% Never married34.4% Now married0.0% Separated0.0% Widowed1.6% DivorcedFemales 38.2% Never married21.8% Now married0.0% Separated0.0% Widowed40.0% DivorcedWomen who did not give birth in the past 12 months Now married:
31.6% (16)Unmarried:
68.4% (34)
Marital status - Two or more races population 15 years and over
Males 77.6% Never married8.5% Now married0.0% Separated0.0% Widowed13.9% DivorcedFemales 48.4% Never married37.5% Now married0.0% Separated0.0% Widowed14.1% DivorcedWomen who did not give birth in the past 12 months Now married:
26.3% (92)Unmarried:
73.7% (259)
Marital status - White alone, not Hispanic / Latino population 15 years and over
Males 50.2% Never married36.3% Now married0.2% Separated3.4% Widowed9.9% DivorcedFemales 38.8% Never married37.5% Now married0.0% Separated11.1% Widowed12.6% DivorcedWomen who gave birth in the past 12 months Now married:
82.6% (98)Unmarried:
17.4% (21)
Women who did not give birth in the past 12 months Now married:
25.7% (557)Unmarried:
74.3% (1,610)
Marital status - Hispanic or Latino population 15 years and over
Males 74.5% Never married13.0% Now married0.0% Separated0.0% Widowed12.4% DivorcedFemales 22.9% Never married68.3% Now married0.0% Separated0.0% Widowed8.8% DivorcedWomen who did not give birth in the past 12 months Now married:
50.8% (68)Unmarried:
49.2% (66)
Ancestries in St. Peter
1,879 35.5% German458 8.6% Norwegian408 7.7% American234 4.4% Irish138 2.6% African126 2.4% European97 1.8% Swedish87 1.6% Finnish81 1.5% Northern European76 1.4% Bulgarian72 1.4% Polish60 1.1% Scandinavian57 1.1% Nigerian48 0.9% Danish40 0.8% English35 0.7% Kenyan33 0.6% Italian30 0.6% Somali23 0.4% Hungarian22 0.4% Czech22 0.4% Scottish20 0.4% Ukrainian16 0.3% Portuguese16 0.3% Haitian13 0.2% Belgian13 0.2% French11 0.2% Swiss9 0.2% Lebanese8 0.2% French Canadian6 0.1% Ghanaian5 0.09% Yugoslavian3 0.06% Slavic2 0.04% South African
Children Nativity (place of birth) in St. Peter
Children under 6 years - Living with two parents Both parents native 283 100.0% NativeBoth parents foreign-born 41 100.0% NativeOne native, one foreign-born parent 33 100.0% NativeChildren under 6 years - Living with one parent Native parent 193 100.0% NativeForeign-born parent 13 100.0% NativeChildren 6 to 17 years - Living with two parents Both parents native 684 100.0% NativeBoth parents foreign-born 63 100.0% NativeOne native, one foreign-born parent 99 100.0% NativeChildren 6 to 17 years - Living with one parent Native parent 349 100.0% NativeForeign-born parent 141 50.4% Native139 49.6% Foreign-born
Grandparents responsible for own grandchildren in St. Peter
Grandparents (30 to 59 years) White / Caucasian 21 100.0% Not responsible for grandchildrenWhite alone, not Hispanic / Latino 21 100.0% Not responsible for grandchildrenGrandparents (60 years and over) White / Caucasian 11 56.1% Responsible for grandchildren8 43.9% Not responsible for grandchildrenWhite alone, not Hispanic / Latino 11 56.3% Responsible for grandchildren9 43.7% Not responsible for grandchildren