Races in Sterling, Colorado (CO) Detailed Stats
Ancestries, Foreign-born residents, place of birth
Settings
X


Recent posts about races in Sterling, Colorado on our local forum with over 2,400,000 registered users:
 | South Asians (Indians) in Lone Tree area. (35 replies) |
| Can we discuss HOAs? (97 replies) |
| right leaning suburbs (44 replies) |
| Anyone from Sterling or know someone there? (10 replies) |
| Relocating in CO (6 replies) |
| Just how much authority is granted HoA's in Colorado? (67 replies) |
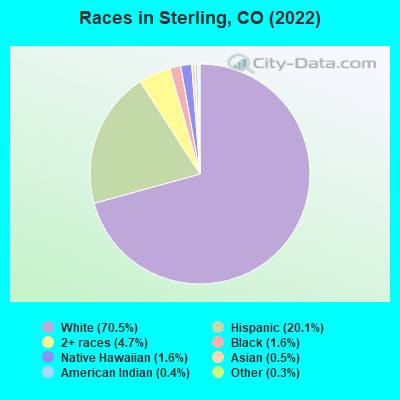
According to 2022 data, the most numerous races in Sterling, CO are White alone (10,354 residents), Hispanic (3,187 residents), and Two or more races (1,219 residents). 89.0% of Sterling residents speak English at home. 4.2% of Sterling, CO residents are foreign-born (3.4% born in Latin America), which is 115.3% less than the foreign-born rate of 9.0% across the entire state of Colorado.
Race distribution in Sterling
2000
2022

- 9,46383.3%White alone
- 1,61314.2%Hispanic
- 950.8%Two or more races
- 830.7%Black alone
- 540.5%American Indian alone
- 430.4%Asian alone
- 70.06%Native Hawaiian and Other
Pacific Islander alone - 20.02%Other race alone

-
- 10,35467.7%White alone
- 3,18720.9%Hispanic
- 1,2198.0%Two or more races
- 1911.2%Black alone
- 1691.1%Asian alone
- 1751.1%Native Hawaiian and Other
Pacific Islander alone - 1290.8%American Indian alone
- 180.1%Other race alone
2000
2022
-
- 3,202,88074.5%White alone
- 735,60117.1%Hispanic
- 158,4433.7%Black alone
- 93,2772.2%Asian alone
- 72,7211.7%Two or more races
- 28,9820.7%American Indian alone
- 5,5120.1%Other race alone
- 3,8450.09%Native Hawaiian and Other
Pacific Islander alone

-
- 3,793,27065.0%White alone
- 1,314,96222.5%Hispanic
- 268,7544.6%Two or more races
- 220,7563.8%Black alone
- 182,6583.1%Asian alone
- 29,7980.5%Other race alone
- 23,3890.4%American Indian alone
- 6,3390.1%Native Hawaiian and Other
Pacific Islander alone

Income and house value in Sterling
- Median household income in 2022
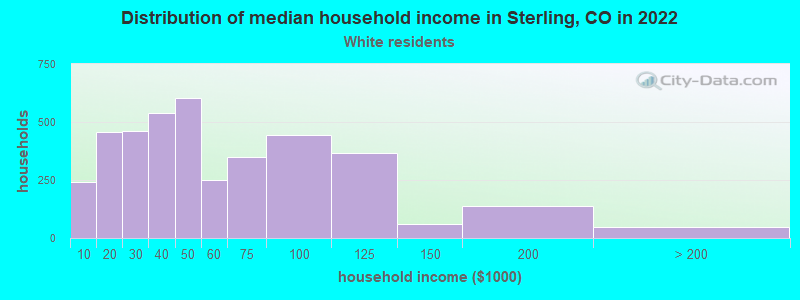
- $61,631White non-Hispanic householders
- $59,398Black householders
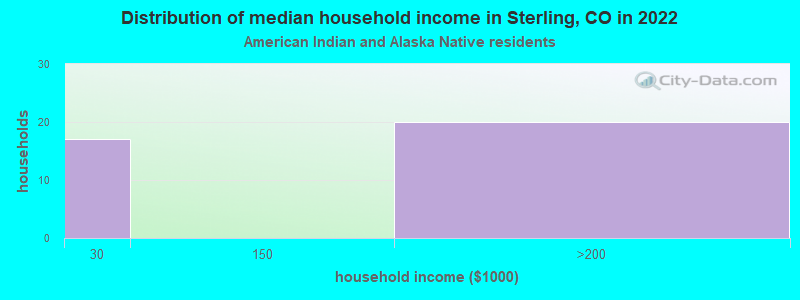
- $33,208American Indian and Alaska Native householders
- $49,225Asian householders
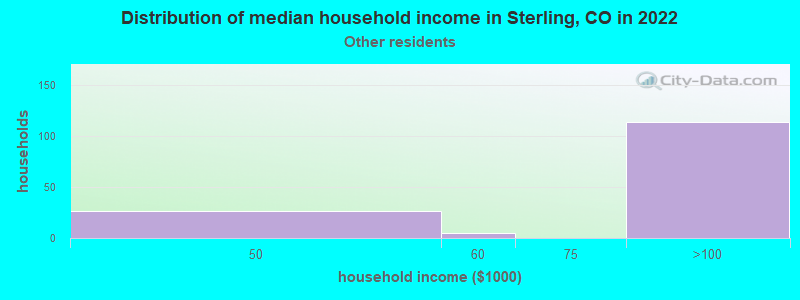
- $17,143Some other race householders
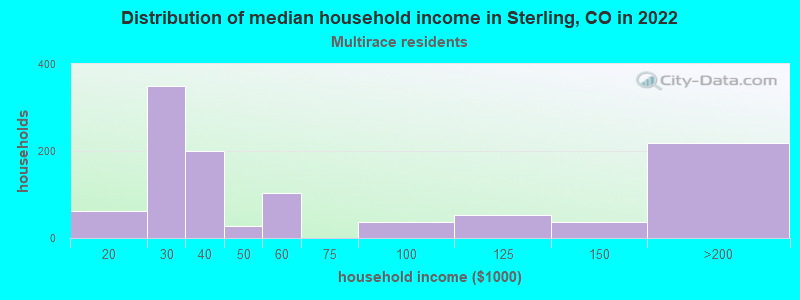
- $131,235Two or more races householders
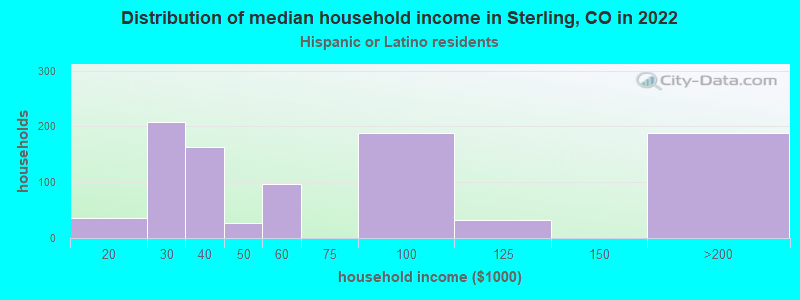
- $48,434Hispanic or Latino race householders
- Median 2022 house value
- $267,706White Non-Hispanic householders
- $204,677Some other race householders
- $281,970Two or more races householders
- $222,259Hispanic or Latino householders
Household income for White non-Hispanic householders
Household income for American Indian and Alaska Native householders
Household income for Some other race householders
Household income for Two or more races householders
Household income for Hispanic or Latino race householders
Median age by race in Sterling
- 37.1Median age for White residents
- 36.9Males
- 37.1Females
- 25.2Median age for Black or African American residents
- 56.0Median age for American Indian / Alaska Native residents
- 48.5Males
- 56.7Females
- 40.0Median age for Asian residents
- 19.3Males
- 40.1Females
- 52.6Median age for Other race residents
- 4.3Median age for Two or more races residents
- 2.7Males
- 4.7Females
- 39.7Median age for White alone residents
- 37.3Males
- 45.4Females
- 26.5Median age for Hispanic or Latino residents
- 33.7Males
- 20.2Females
Owner/renter occupied households by race in Sterling
- House owners and renters - White residents
- 2,83656.1%Owner occupied
- 2,21743.9%Renter occupied
- House owners and renters - Black or African American residents
- 38100.0%Owner occupied
- House owners and renters - American Indian / Alaska Native residents
- 513.9%Owner occupied
- 3086.1%Renter occupied
- House owners and renters - Asian residents
- 2774.2%Owner occupied
- 925.8%Renter occupied
- House owners and renters - Native Hawaiian / Pacific Islander residents
- 27100.0%Renter occupied
- House owners and renters - Other race residents
- 3026.8%Owner occupied
- 8173.2%Renter occupied
- House owners and renters - Two or more races residents
- 100100.0%Renter occupied
- House owners and renters - White alone residents
- 2,66658.8%Owner occupied
- 1,87241.2%Renter occupied
- House owners and renters - Hispanic or Latino residents
- 31133.9%Owner occupied
- 60666.1%Renter occupied
Language usage in Sterling
- English speakers - Total
- 89.0% of residents of Sterling speak English at home.
- 9.4% of residents speak Spanish at home
- 81863.5%Speak English very well
- 47136.5%Speak English less than very well
- 1.7% of residents speak other language at home
- 17273.8%Speak English very well
- 6126.2%Speak English less than very well
- English speakers - Born in the United States
- 94.6% of residents of Sterling speak English at home.
- 5.2% of residents speak Spanish at home
- 26596.4%Speak English very well
- 103.6%Speak English less than very well
- 0.3% of residents speak other language at home
- 15100.0%Speak English very well
- English speakers - Native, born elsewhere
- 28.6% of residents of Sterling speak English at home.
- 61.5% of residents speak other language at home
- 118100.0%Speak English very well
- English speakers - Foreign-born
- 13.8% of residents of Sterling speak English at home.
- 74.6% of residents speak Spanish at home
- 9018.9%Speak English very well
- 38581.1%Speak English less than very well
- 8.3% of residents speak other language at home
- 1324.5%Speak English very well
- 4075.5%Speak English less than very well
White (Caucasian) - Speak only English
| Native: | 94.8% (10,863) |
| Foreign-born: | 16.7% (62) |
White (Caucasian) - Speak another language
| Native: | 5.3% (602) |
| Foreign-born: | 78.3% (291) |
Asian - Speak only English
| Native: | 100.0% (99) |
| Foreign-born: | 36.1% (23) |
Other race - Speak another language
| Native: | 6.1% (7) |
| Foreign-born: | 95.1% (11) |
White alone - Speak only English
| Native: | 98.7% (9,682) |
| Foreign-born: | 94.4% (65) |
White alone - Speak another language
| Native: | 1.4% (141) |
| Foreign-born: | 9.7% (7) |
Hispanic or Latino - Speak another language
| Native: | 30.4% (767) |
| Foreign-born: | 96.7% (456) |
Foreign-born residents in Sterling
639 residents are foreign born (3.4% Latin America).
| This city: | 4.2% |
| Colorado: | 100.0% |


Marital status for residents in Sterling
Marital status - White (Caucasian) population 15 years and over
- Males
- 38.0%Never married
- 44.6%Now married
- 3.5%Separated
- 1.5%Widowed
- 12.3%Divorced
- Females
- 29.0%Never married
- 42.0%Now married
- 1.1%Separated
- 12.9%Widowed
- 15.0%Divorced
Women who gave birth in the past 12 months
| Now married: | 88.8% (165) |
| Unmarried: | 11.2% (21) |
Women who did not give birth in the past 12 months
| Now married: | 35.4% (855) |
| Unmarried: | 64.6% (1,562) |
Marital status - Black or African American population 15 years and over
- Males
- 76.8%Never married
- 17.7%Now married
- 0.0%Separated
- 0.0%Widowed
- 5.5%Divorced
- Females
- 100.0%Never married
- 0.0%Now married
- 0.0%Separated
- 0.0%Widowed
- 0.0%Divorced
Women who did not give birth in the past 12 months
| Now married: | 0.0% (0) |
| Unmarried: | 100.0% (5) |
Marital status - American Indian / Alaska Native population 15 years and over
- Males
- 50.4%Never married
- 25.5%Now married
- 0.0%Separated
- 0.0%Widowed
- 24.1%Divorced
- Females
- 27.3%Never married
- 54.5%Now married
- 0.0%Separated
- 18.2%Widowed
- 0.0%Divorced
Women who did not give birth in the past 12 months
| Now married: | 0.0% (0) |
| Unmarried: | 100.0% (6) |
Marital status - Asian population 15 years and over
- Males
- 60.0%Never married
- 11.4%Now married
- 0.0%Separated
- 0.0%Widowed
- 28.6%Divorced
- Females
- 13.0%Never married
- 58.0%Now married
- 0.0%Separated
- 29.0%Widowed
- 0.0%Divorced
Women who did not give birth in the past 12 months
| Now married: | 69.0% (23) |
| Unmarried: | 31.0% (10) |
Marital status - Native Hawaiian / Pacific Islander population 15 years and over
- Males
- 0.0%Never married
- 0.0%Now married
- 0.0%Separated
- 0.0%Widowed
- 100.0%Divorced
- Females
- 50.0%Never married
- 0.0%Now married
- 0.0%Separated
- 50.0%Widowed
- 0.0%Divorced
Women who did not give birth in the past 12 months
| Now married: | 0.0% (0) |
| Unmarried: | 100.0% (131) |
Marital status - Other race population 15 years and over
- Males
- 100.0%Never married
- 0.0%Now married
- 0.0%Separated
- 0.0%Widowed
- 0.0%Divorced
- Females
- 0.0%Never married
- 47.4%Now married
- 0.0%Separated
- 0.0%Widowed
- 52.6%Divorced
Women who did not give birth in the past 12 months
| Now married: | 100.0% (11) |
| Unmarried: | 0.0% (0) |
Marital status - Two or more races population 15 years and over
- Males
- 33.0%Never married
- 59.0%Now married
- 0.0%Separated
- 0.0%Widowed
- 8.0%Divorced
- Females
- 23.9%Never married
- 32.5%Now married
- 0.0%Separated
- 0.0%Widowed
- 43.6%Divorced
Women who gave birth in the past 12 months
| Now married: | 100.0% (103) |
| Unmarried: | 0.0% (0) |
Women who did not give birth in the past 12 months
| Now married: | 0.0% (0) |
| Unmarried: | 100.0% (244) |
Marital status - White alone, not Hispanic / Latino population 15 years and over
- Males
- 35.5%Never married
- 45.0%Now married
- 2.4%Separated
- 2.0%Widowed
- 15.1%Divorced
- Females
- 25.3%Never married
- 43.7%Now married
- 1.1%Separated
- 14.1%Widowed
- 15.8%Divorced
Women who gave birth in the past 12 months
| Now married: | 86.0% (137) |
| Unmarried: | 14.0% (22) |
Women who did not give birth in the past 12 months
| Now married: | 36.5% (695) |
| Unmarried: | 63.5% (1,210) |
Marital status - Hispanic or Latino population 15 years and over
- Males
- 50.4%Never married
- 40.4%Now married
- 7.0%Separated
- 0.0%Widowed
- 2.2%Divorced
- Females
- 45.2%Never married
- 34.9%Now married
- 1.0%Separated
- 7.6%Widowed
- 11.4%Divorced
Women who gave birth in the past 12 months
| Now married: | 100.0% (43) |
| Unmarried: | 0.0% (0) |
Women who did not give birth in the past 12 months
| Now married: | 33.2% (252) |
| Unmarried: | 66.8% (507) |
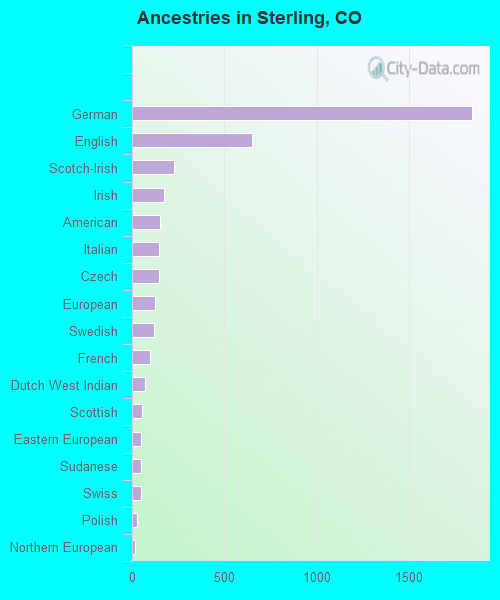
Ancestries in Sterling

- 1,09116.7%German
- 3825.9%American
- 3455.3%English
- 3265.0%Irish
- 3034.6%European
- 1221.9%Italian
- 1151.8%Scotch-Irish
- 831.3%Czech
- 711.1%Scandinavian
- 711.1%Dutch West Indian
- 671.0%French
- 661.0%Polish
- 500.8%Scottish
- 440.7%Swiss
- 430.7%Swedish
- 410.6%Canadian
- 400.6%Northern European
- 370.6%Eastern European
- 350.5%African
- 250.4%Celtic
- 240.4%Norwegian
- 230.4%Greek
- 110.2%French Canadian
- 90.1%Lebanese
- 80.1%Danish
- 70.1%Belizean
- 50.08%Dutch
Geographical mobility in Sterling

- Same house 1 year ago
- 9,33576.3%White (Caucasian)
- 10856.4%Black or African American
- 15186.5%American Indian / Alaska Native
- 183100.0%Asian
- 10488.9%Other race
- 31516.0%Two or more races
- 7,74776.9%White alone, not Hispanic / Latino
- 2,21773.0%Hispanic or Latino

-
- Moved within same county
- 1,0959.0%White / Caucasian
- 229100.0%Native Hawaiian / Pacific Islander
- 68434.7%Two or more races
- 1,03610.3%White alone, not Hispanic / Latino
- 1896.2%Hispanic or Latino

-
- Moved within same state
- 1,32310.8%White / Caucasian
- 6232.1%Black or African American
- 87.0%Other race
- 74537.8%Two or more races
- 9769.7%White alone, not Hispanic / Latino
- 50416.6%Hispanic or Latino

-
- Moved from different state
- 3262.7%White / Caucasian
- 2211.6%Black or African American
- 2816.3%American Indian / Alaska Native
- 2582.6%White alone, not Hispanic / Latino
- 722.4%Hispanic or Latino

-
- Moved from abroad
- 650.5%White
- 210.2%White alone, not Hispanic / Latino
- 692.3%Hispanic or Latino

Children Nativity (place of birth) in Sterling
Place of birth for residents in Sterling
![Place of birth for the foreign-born population - Regions]()
- 564Americas
- 509Latin America
- 509Central America
- 60Asia
- 54Northern America
- 40South Eastern Asia
- 20Eastern Asia
- 9China
- 8Oceania
- 8Australia and New Zealand Subregion
- 7Europe
- 4Southern Europe
- 3Western Europe

![Place of birth for the foreign-born population - Countries]()
- 499Mexico
- 54Canada
- 40Vietnam
- 11Japan
- 10Belize
- 9China
- 8Australia
- 4Italy
- 3Netherlands

Grandparents responsible for own grandchildren in Sterling
Zip codes: 80751.