Races in Streator, Illinois (IL) Detailed Stats
Data:
Races - White alone (%)
Races - White alone (% change since 2000)
Races - Black alone (%)
Races - Black alone (% change since 2000)
Races - American Indian alone (%)
Races - American Indian alone (% change since 2000)
Races - Asian alone (%)
Races - Asian alone (% change since 2000)
Races - Hispanic (%)
Races - Hispanic (% change since 2000)
Races - Native Hawaiian and Other Pacific Islander alone (%)
Races - Native Hawaiian and Other Pacific Islander alone (% change since 2000)
Races - Two or more races(%)
Races - Two or more races(% change since 2000)
Races - Other race alone (%)
Races - Other race alone (% change since 2000)
Racial diversity
Place of birth - Born in state of residence (%)
Place of birth - Born in state of residence (%) - White
Place of birth - Born in state of residence (%) - Black or African American
Place of birth - Born in state of residence (%) - Asian
Place of birth - Born in state of residence (%) - Hispanic or Latino
Place of birth - Born in state of residence (%) - American Indian and Alaska Native
Place of birth - Born in state of residence (%) - Multirace
Place of birth - Born in state of residence (%) - Other Race
Place of birth - Born in other state (%)
Place of birth - Born in other state (%) - White
Place of birth - Born in other state (%) - Black or African American
Place of birth - Born in other state (%) - Asian
Place of birth - Born in other state (%) - Hispanic or Latino
Place of birth - Born in other state (%) - American Indian and Alaska Native
Place of birth - Born in other state (%) - Multirace
Place of birth - Born in other state (%) - Other Race
Place of birth - Native, outside of US (%)
Place of birth - Native, outside of US (%) - White
Place of birth - Native, outside of US (%) - Black or African American
Place of birth - Native, outside of US (%) - Asian
Place of birth - Native, outside of US (%) - Hispanic or Latino
Place of birth - Native, outside of US (%) - American Indian and Alaska Native
Place of birth - Native, outside of US (%) - Multirace
Place of birth - Native, outside of US (%) - Other Race
Place of birth - Foreign born (%)
Place of birth - Foreign born (%) - White
Place of birth - Foreign born (%) - Black or African American
Place of birth - Foreign born (%) - Asian
Place of birth - Foreign born (%) - Hispanic or Latino
Place of birth - Foreign born (%) - American Indian and Alaska Native
Place of birth - Foreign born (%) - Multirace
Place of birth - Foreign born (%) - Other Race
Residents speaking English at home (%)
Residents speaking English at home - Born in the United States (%)
Residents speaking English at home - Native, born elsewhere (%)
Residents speaking English at home - Foreign born (%)
Residents speaking Spanish at home (%)
Residents speaking Spanish at home - Born in the United States (%)
Residents speaking Spanish at home - Native, born elsewhere (%)
Residents speaking Spanish at home - Foreign born (%)
Residents speaking other language at home (%)
Residents speaking other language at home - Born in the United States (%)
Residents speaking other language at home - Native, born elsewhere (%)
Residents speaking other language at home - Foreign born (%)
Marital status - Never married (%)
Marital status - Now married (%)
Marital status - Separated (%)
Marital status - Widowed (%)
Marital status - Divorced (%)
Ancestries Reported - Arab (%)
Ancestries Reported - Czech (%)
Ancestries Reported - Danish (%)
Ancestries Reported - Dutch (%)
Ancestries Reported - English (%)
Ancestries Reported - French (%)
Ancestries Reported - French Canadian (%)
Ancestries Reported - German (%)
Ancestries Reported - Greek (%)
Ancestries Reported - Hungarian (%)
Ancestries Reported - Irish (%)
Ancestries Reported - Italian (%)
Ancestries Reported - Lithuanian (%)
Ancestries Reported - Norwegian (%)
Ancestries Reported - Polish (%)
Ancestries Reported - Portuguese (%)
Ancestries Reported - Russian (%)
Ancestries Reported - Scotch-Irish (%)
Ancestries Reported - Scottish (%)
Ancestries Reported - Slovak (%)
Ancestries Reported - Subsaharan African (%)
Ancestries Reported - Swedish (%)
Ancestries Reported - Swiss (%)
Ancestries Reported - Ukrainian (%)
Ancestries Reported - United States (%)
Ancestries Reported - Welsh (%)
Ancestries Reported - West Indian (%)
Ancestries Reported - Other (%)
Geographical mobility - Same house 1 year ago (%)
Geographical mobility - Same house 1 year ago (%) - White
Geographical mobility - Same house 1 year ago (%) - Black or African American
Geographical mobility - Same house 1 year ago (%) - Asian
Geographical mobility - Same house 1 year ago (%) - Hispanic or Latino
Geographical mobility - Same house 1 year ago (%) - American Indian and Alaska Native
Geographical mobility - Same house 1 year ago (%) - Multirace
Geographical mobility - Same house 1 year ago (%) - Other Race
Geographical mobility - Moved within same county (%)
Geographical mobility - Moved within same county (%) - White
Geographical mobility - Moved within same county (%) - Black or African American
Geographical mobility - Moved within same county (%) - Asian
Geographical mobility - Moved within same county (%) - Hispanic or Latino
Geographical mobility - Moved within same county (%) - American Indian and Alaska Native
Geographical mobility - Moved within same county (%) - Multirace
Geographical mobility - Moved within same county (%) - Other Race
Geographical mobility - Moved from different county within same state (%)
Geographical mobility - Moved from different county within same state (%) - White
Geographical mobility - Moved from different county within same state (%) - Black or African American
Geographical mobility - Moved from different county within same state (%) - Asian
Geographical mobility - Moved from different county within same state (%) - Hispanic or Latino
Geographical mobility - Moved from different county within same state (%) - American Indian and Alaska Native
Geographical mobility - Moved from different county within same state (%) - Multirace
Geographical mobility - Moved from different county within same state (%) - Other Race
Geographical mobility - Moved from different state (%)
Geographical mobility - Moved from different state (%) - White
Geographical mobility - Moved from different state (%) - Black or African American
Geographical mobility - Moved from different state (%) - Asian
Geographical mobility - Moved from different state (%) - Hispanic or Latino
Geographical mobility - Moved from different state (%) - American Indian and Alaska Native
Geographical mobility - Moved from different state (%) - Multirace
Geographical mobility - Moved from different state (%) - Other Race
Geographical mobility - Moved from abroad (%)
Geographical mobility - Moved from abroad (%) - White
Geographical mobility - Moved from abroad (%) - Black or African American
Geographical mobility - Moved from abroad (%) - Asian
Geographical mobility - Moved from abroad (%) - Hispanic or Latino
Geographical mobility - Moved from abroad (%) - American Indian and Alaska Native
Geographical mobility - Moved from abroad (%) - Multirace
Geographical mobility - Moved from abroad (%) - Other Race
Place of birth for the foreign-born population - Ireland (%)
Place of birth for the foreign-born population - Denmark (%)
Place of birth for the foreign-born population - Norway (%)
Place of birth for the foreign-born population - Sweden (%)
Place of birth for the foreign-born population - United Kingdom (%)
Place of birth for the foreign-born population - England (%)
Place of birth for the foreign-born population - Scotland (%)
Place of birth for the foreign-born population - Other Northern Europe (%)
Place of birth for the foreign-born population - Austria (%)
Place of birth for the foreign-born population - Belgium (%)
Place of birth for the foreign-born population - France (%)
Place of birth for the foreign-born population - Germany (%)
Place of birth for the foreign-born population - Netherlands (%)
Place of birth for the foreign-born population - Switzerland (%)
Place of birth for the foreign-born population - Other Western Europe (%)
Place of birth for the foreign-born population - Greece (%)
Place of birth for the foreign-born population - Italy (%)
Place of birth for the foreign-born population - Portugal (%)
Place of birth for the foreign-born population - Spain (%)
Place of birth for the foreign-born population - Other Southern Europe (%)
Place of birth for the foreign-born population - Albania (%)
Place of birth for the foreign-born population - Belarus (%)
Place of birth for the foreign-born population - Bosnia and Herzegovina (%)
Place of birth for the foreign-born population - Bulgaria (%)
Place of birth for the foreign-born population - Croatia (%)
Place of birth for the foreign-born population - Czechoslovakia (%)
Place of birth for the foreign-born population - Hungary (%)
Place of birth for the foreign-born population - Latvia (%)
Place of birth for the foreign-born population - Lithuania (%)
Place of birth for the foreign-born population - North Macedonia (Macedonia) (%)
Place of birth for the foreign-born population - Moldova (%)
Place of birth for the foreign-born population - Poland (%)
Place of birth for the foreign-born population - Romania (%)
Place of birth for the foreign-born population - Russia (%)
Place of birth for the foreign-born population - Serbia (%)
Place of birth for the foreign-born population - Ukraine (%)
Place of birth for the foreign-born population - Other Eastern Europe (%)
Place of birth for the foreign-born population - China (%)
Place of birth for the foreign-born population - Hong Kong (%)
Place of birth for the foreign-born population - Taiwan (%)
Place of birth for the foreign-born population - Japan (%)
Place of birth for the foreign-born population - Korea (%)
Place of birth for the foreign-born population - Other Eastern Asia (%)
Place of birth for the foreign-born population - Afghanistan (%)
Place of birth for the foreign-born population - Bangladesh (%)
Place of birth for the foreign-born population - India (%)
Place of birth for the foreign-born population - Iran (%)
Place of birth for the foreign-born population - Kazakhstan (%)
Place of birth for the foreign-born population - Nepal (%)
Place of birth for the foreign-born population - Pakistan (%)
Place of birth for the foreign-born population - Sri Lanka (%)
Place of birth for the foreign-born population - Uzbekistan (%)
Place of birth for the foreign-born population - Other South Central Asia (%)
Place of birth for the foreign-born population - Burma (%)
Place of birth for the foreign-born population - Cambodia (%)
Place of birth for the foreign-born population - Indonesia (%)
Place of birth for the foreign-born population - Laos (%)
Place of birth for the foreign-born population - Malaysia (%)
Place of birth for the foreign-born population - Philippines (%)
Place of birth for the foreign-born population - Singapore (%)
Place of birth for the foreign-born population - Thailand (%)
Place of birth for the foreign-born population - Vietnam (%)
Place of birth for the foreign-born population - Other South Eastern Asia (%)
Place of birth for the foreign-born population - Armenia (%)
Place of birth for the foreign-born population - Iraq (%)
Place of birth for the foreign-born population - Israel (%)
Place of birth for the foreign-born population - Jordan (%)
Place of birth for the foreign-born population - Kuwait (%)
Place of birth for the foreign-born population - Lebanon (%)
Place of birth for the foreign-born population - Saudi Arabia (%)
Place of birth for the foreign-born population - Syria (%)
Place of birth for the foreign-born population - Turkey (%)
Place of birth for the foreign-born population - Yemen (%)
Place of birth for the foreign-born population - Other Western Asia (%)
Place of birth for the foreign-born population - Eritrea (%)
Place of birth for the foreign-born population - Ethiopia (%)
Place of birth for the foreign-born population - Kenya (%)
Place of birth for the foreign-born population - Somalia (%)
Place of birth for the foreign-born population - Uganda (%)
Place of birth for the foreign-born population - Zimbabwe (%)
Place of birth for the foreign-born population - Other Eastern Africa (%)
Place of birth for the foreign-born population - Cameroon (%)
Place of birth for the foreign-born population - Congo (%)
Place of birth for the foreign-born population - Democratic Republic of Congo (Zaire) (%)
Place of birth for the foreign-born population - Other Middle Africa (%)
Place of birth for the foreign-born population - Egypt (%)
Place of birth for the foreign-born population - Morocco (%)
Place of birth for the foreign-born population - Sudan (%)
Place of birth for the foreign-born population - Other Northern Africa (%)
Place of birth for the foreign-born population - South Africa (%)
Place of birth for the foreign-born population - Other Southern Africa (%)
Place of birth for the foreign-born population - Cabo Verde (%)
Place of birth for the foreign-born population - Ghana (%)
Place of birth for the foreign-born population - Liberia (%)
Place of birth for the foreign-born population - Nigeria (%)
Place of birth for the foreign-born population - Senegal (%)
Place of birth for the foreign-born population - Sierra Leone (%)
Place of birth for the foreign-born population - Other Western Africa (%)
Place of birth for the foreign-born population - Australia (%)
Place of birth for the foreign-born population - New Zealand (%)
Place of birth for the foreign-born population - Fiji (%)
Place of birth for the foreign-born population - Micronesia (%)
Place of birth for the foreign-born population - Bahamas (%)
Place of birth for the foreign-born population - Barbados (%)
Place of birth for the foreign-born population - Cuba (%)
Place of birth for the foreign-born population - Dominica (%)
Place of birth for the foreign-born population - Dominican Republic (%)
Place of birth for the foreign-born population - Grenada (%)
Place of birth for the foreign-born population - Haiti (%)
Place of birth for the foreign-born population - Jamaica (%)
Place of birth for the foreign-born population - St. Vincent and the Grenadines (%)
Place of birth for the foreign-born population - Trinidad and Tobago (%)
Place of birth for the foreign-born population - West Indies (%)
Place of birth for the foreign-born population - Other Caribbean (%)
Place of birth for the foreign-born population - Belize (%)
Place of birth for the foreign-born population - Costa Rica (%)
Place of birth for the foreign-born population - El Salvador (%)
Place of birth for the foreign-born population - Guatemala (%)
Place of birth for the foreign-born population - Honduras (%)
Place of birth for the foreign-born population - Mexico (%)
Place of birth for the foreign-born population - Nicaragua (%)
Place of birth for the foreign-born population - Panama (%)
Place of birth for the foreign-born population - Other Central America (%)
Place of birth for the foreign-born population - Argentina (%)
Place of birth for the foreign-born population - Bolivia (%)
Place of birth for the foreign-born population - Brazil (%)
Place of birth for the foreign-born population - Chile (%)
Place of birth for the foreign-born population - Colombia (%)
Place of birth for the foreign-born population - Ecuador (%)
Place of birth for the foreign-born population - Guyana (%)
Place of birth for the foreign-born population - Peru (%)
Place of birth for the foreign-born population - Uruguay (%)
Place of birth for the foreign-born population - Venezuela (%)
Place of birth for the foreign-born population - Other South America (%)
Place of birth for the foreign-born population - Canada (%)
Place of birth for the foreign-born population - Other Northern America (%)
Place of birth for the foreign-born population - Other (%)
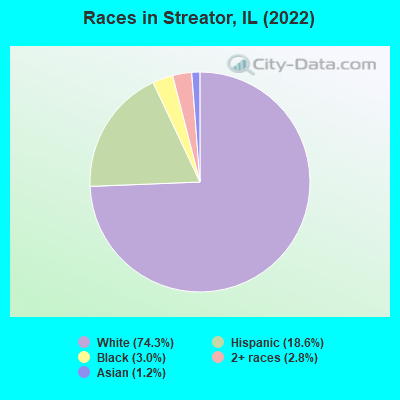
According to 2022 data, the most numerous races in Streator, IL are White alone (9,002 residents), Hispanic (2,260 residents), and Black alone (361 residents). 88.6% of Streator residents speak English at home. 4.3% of Streator, IL residents are foreign-born (4.1% born in Latin America), which is 223.8% less than the foreign-born rate of 14.0% across the entire state of Illinois.
Race distribution in Streator
2000 2022
8,424,140 67.8% White alone 1,856,152 14.9% Black alone 1,530,262 12.3% Hispanic 419,916 3.4% Asian alone 153,996 1.2% Two or more races 13,479 0.1% Other race alone 18,232 0.1% American Indian alone 3,116 0.03% Native Hawaiian and Other
7,356,301 58.5% White alone 2,299,726 18.3% Hispanic 1,660,423 13.2% Black alone 747,296 5.9% Asian alone 458,599 3.6% Two or more races 45,386 0.4% Other race alone 10,405 0.08% American Indian alone 3,896 0.03% Native Hawaiian and Other
Income and house value in Streator Median household income in 2022 $42,595 White non-Hispanic householders$68,573 Some other race householders$71,218 Two or more races householders$56,079 Hispanic or Latino race householdersMedian 2022 house value $84,049 White Non-Hispanic householders$112,165 Black or African American householders$97,209 American Indian or Alaska Native householders $265,457 Asian householders$67,299 Some other race householders$143,422 Two or more races householders$120,390 Hispanic or Latino householders
Median age by race in Streator
43.3 Median age for White residents43.5 43.1 24.0 Median age for Black or African American residents27.3 33.8 -672,816,727.5 Median age for American Indian / Alaska Native residents-720,238,094.5 -666,666,666.0 9.6 Median age for Asian residents-904,109,588.1 -1,006,441,222.8 -593,236,714.4 Median age for Native Hawaiian / Pacific Islander residents-666,666,666.0 -576,015,108.0 33.4 Median age for Other race residents36.0 29.2 38.2 Median age for Two or more races residents37.8 39.9 44.9 Median age for White alone residents44.6 45.7 30.2 Median age for Hispanic or Latino residents32.4 29.5
Owner/renter occupied households by race in Streator
House owners and renters - White residents 3,075 61.5% Owner occupied1,922 38.5% Renter occupiedHouse owners and renters - Black or African American residents 10 8.3% Owner occupied108 91.7% Renter occupiedHouse owners and renters - American Indian / Alaska Native residents 16 100.0% Renter occupiedHouse owners and renters - Asian residents 21 100.0% Owner occupiedHouse owners and renters - Other race residents 246 90.8% Owner occupied25 9.2% Renter occupiedHouse owners and renters - Two or more races residents 281 69.3% Owner occupied124 30.7% Renter occupiedHouse owners and renters - White alone residents 2,977 62.0% Owner occupied1,825 38.0% Renter occupiedHouse owners and renters - Hispanic or Latino residents 420 61.3% Owner occupied265 38.7% Renter occupied
Language usage in Streator
English speakers - Total 88.6% of residents of Streator speak English at home.
10.1% of residents speak Spanish at home 736 63.5% Speak English very well423 36.5% Speak English less than very well1.7% of residents speak other language at home 169 88.9% Speak English very well21 11.1% Speak English less than very well
English speakers - Born in the United States 92.9% of residents of Streator speak English at home.
10.6% of residents speak Spanish at home 121 100.0% Speak English very well3.7% of residents speak other language at home 42 100.0% Speak English very well
English speakers - Native, born elsewhere 0.0% of residents of Streator speak English at home.
100.0% of residents speak Spanish at home 9 100.0% Speak English very well
English speakers - Foreign-born 2.6% of residents of Streator speak English at home.
95.6% of residents speak Spanish at home 220 35.8% Speak English very well395 64.2% Speak English less than very well1.4% of residents speak other language at home 9 100.0% Speak English less than very well
White (Caucasian) - Speak only English Native:
97.0% (8,767)Foreign-born:
5.3% (9)
White (Caucasian) - Speak another language Native:
2.3% (212)Foreign-born:
97.7% (170)
Other race - Speak only English Native:
37.5% (173)Foreign-born:
2.8% (12)
Other race - Speak another language Native:
54.6% (252)Foreign-born:
95.9% (401)
Two or more races - Speak another language Native:
12.8% (125)Foreign-born:
100.0% (53)
White alone - Speak only English Native:
98.9% (8,510)Foreign-born:
26.1% (6)
White alone - Speak another language Native:
1.1% (90)Foreign-born:
71.0% (17)
Hispanic or Latino - Speak only English Native:
62.9% (853)Foreign-born:
1.9% (13)
Hispanic or Latino - Speak another language Native:
37.5% (508)Foreign-born:
96.6% (669)
Foreign-born residents in Streator 524 residents are foreign born (4.1% Latin America ).
This city:
4.3%Illinois:
14.1%
Marital status for residents in Streator Marital status - White (Caucasian) population 15 years and over
Males 30.5% Never married47.1% Now married1.3% Separated4.7% Widowed16.3% DivorcedFemales 31.2% Never married38.3% Now married0.7% Separated14.2% Widowed15.6% DivorcedWomen who gave birth in the past 12 months Now married:
20.7% (42)Unmarried:
79.3% (162)
Women who did not give birth in the past 12 months Now married:
39.5% (800)Unmarried:
60.5% (1,225)
Marital status - Black or African American population 15 years and over
Males 66.0% Never married20.0% Now married14.0% Separated0.0% Widowed0.0% DivorcedFemales 82.8% Never married0.0% Now married0.0% Separated0.0% Widowed17.2% DivorcedWomen who did not give birth in the past 12 months Now married:
0.0% (0)Unmarried:
100.0% (95)
Marital status - Asian population 15 years and over
Males 0.0% Never married100.0% Now married0.0% Separated0.0% Widowed0.0% DivorcedFemales 0.0% Never married100.0% Now married0.0% Separated0.0% Widowed0.0% DivorcedWomen who did not give birth in the past 12 months Now married:
100.0% (18)Unmarried:
0.0% (0)
Marital status - Other race population 15 years and over
Males 34.5% Never married61.3% Now married4.1% Separated0.0% Widowed0.0% DivorcedFemales 16.0% Never married73.8% Now married0.0% Separated10.2% Widowed0.0% DivorcedWomen who gave birth in the past 12 months Now married:
100.0% (87)Unmarried:
0.0% (0)
Women who did not give birth in the past 12 months Now married:
31.2% (28)Unmarried:
68.8% (62)
Marital status - Two or more races population 15 years and over
Males 14.3% Never married32.6% Now married0.0% Separated0.0% Widowed53.1% DivorcedFemales 27.4% Never married35.7% Now married0.0% Separated36.8% Widowed0.0% DivorcedWomen who did not give birth in the past 12 months Now married:
31.1% (35)Unmarried:
68.9% (77)
Marital status - White alone, not Hispanic / Latino population 15 years and over
Males 30.1% Never married46.8% Now married1.4% Separated4.9% Widowed16.8% DivorcedFemales 31.3% Never married37.7% Now married0.7% Separated15.0% Widowed15.3% DivorcedWomen who gave birth in the past 12 months Now married:
21.8% (43)Unmarried:
78.2% (155)
Women who did not give birth in the past 12 months Now married:
38.4% (709)Unmarried:
61.6% (1,138)
Marital status - Hispanic or Latino population 15 years and over
Males 29.0% Never married48.0% Now married1.8% Separated0.0% Widowed21.1% DivorcedFemales 24.7% Never married48.5% Now married0.0% Separated18.7% Widowed8.2% DivorcedWomen who gave birth in the past 12 months Now married:
87.2% (77)Unmarried:
12.8% (11)
Women who did not give birth in the past 12 months Now married:
39.1% (139)Unmarried:
60.9% (217)
Ancestries in Streator
641 12.3% German565 10.8% American475 9.1% Irish437 8.4% English182 3.5% African170 3.3% Italian147 2.8% Slovak105 2.0% Swedish62 1.2% Czech46 0.9% Norwegian42 0.8% Polish37 0.7% Danish35 0.7% Greek29 0.6% Scotch-Irish25 0.5% European15 0.3% British14 0.3% Dutch13 0.2% Croatian13 0.2% Scottish11 0.2% Slavic7 0.1% French4 0.08% Austrian4 0.08% Russian3 0.06% Yugoslavian
Children Nativity (place of birth) in Streator
Children under 6 years - Living with two parents Both parents native 367 100.0% NativeOne native, one foreign-born parent 67 100.0% NativeChildren under 6 years - Living with one parent Native parent 429 100.0% Native
Children 6 to 17 years - Living with two parents Both parents native 704 100.0% NativeBoth parents foreign-born 189 100.0% NativeChildren 6 to 17 years - Living with one parent Native parent 515 100.0% Native
Place of birth for residents in Streator 513 Americas503 Latin America503 Central America11 Europe11 Eastern Europe10 Northern America
Grandparents responsible for own grandchildren in Streator
Grandparents (30 to 59 years) White / Caucasian 19 33.1% Responsible for grandchildren38 66.9% Not responsible for grandchildrenOther race 109 100.0% Not responsible for grandchildrenWhite alone, not Hispanic / Latino 19 32.4% Responsible for grandchildren40 67.6% Not responsible for grandchildrenHispanic or Latino 96 100.0% Not responsible for grandchildrenGrandparents (60 years and over) White / Caucasian 15 49.3% Responsible for grandchildren16 50.7% Not responsible for grandchildrenWhite alone, not Hispanic / Latino 15 48.8% Responsible for grandchildren16 51.2% Not responsible for grandchildren