Races in Sumner, Washington (WA) Detailed Stats
Data:
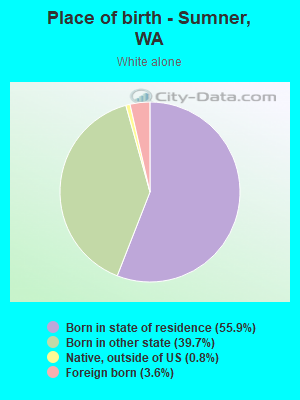
Races - White alone (%)
Races - White alone (% change since 2000)
Races - Black alone (%)
Races - Black alone (% change since 2000)
Races - American Indian alone (%)
Races - American Indian alone (% change since 2000)
Races - Asian alone (%)
Races - Asian alone (% change since 2000)
Races - Hispanic (%)
Races - Hispanic (% change since 2000)
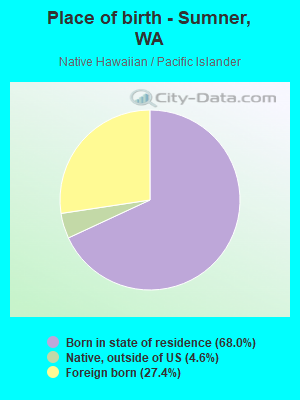
Races - Native Hawaiian and Other Pacific Islander alone (%)
Races - Native Hawaiian and Other Pacific Islander alone (% change since 2000)
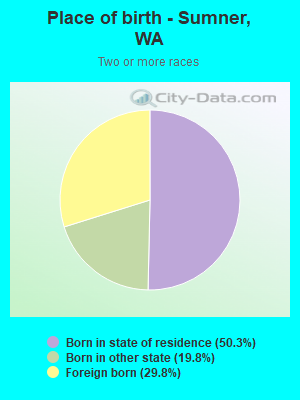
Races - Two or more races(%)
Races - Two or more races(% change since 2000)
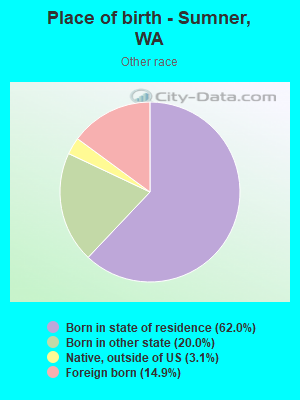
Races - Other race alone (%)
Races - Other race alone (% change since 2000)
Racial diversity
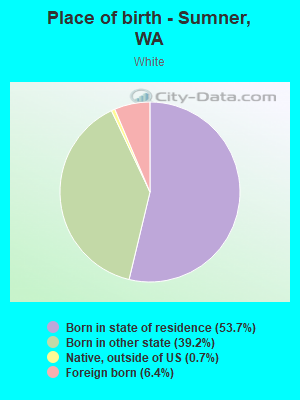
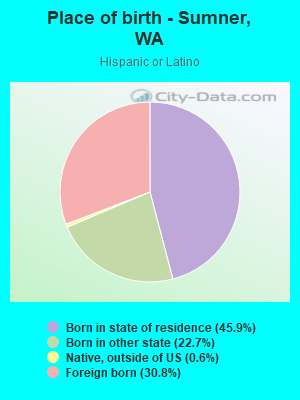
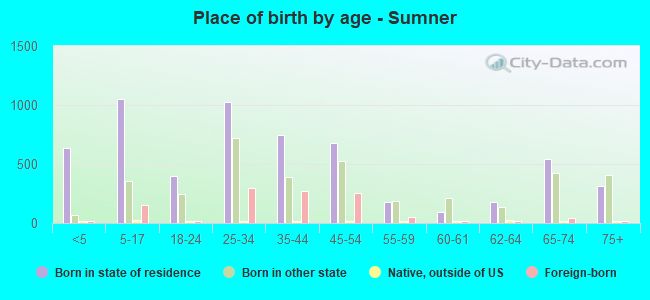
Place of birth - Born in state of residence (%)
Place of birth - Born in state of residence (%) - White
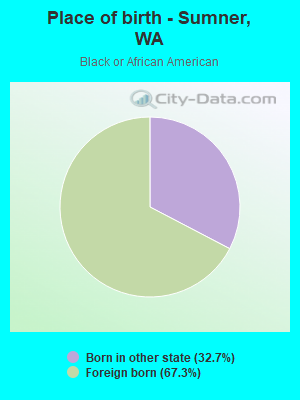
Place of birth - Born in state of residence (%) - Black or African American
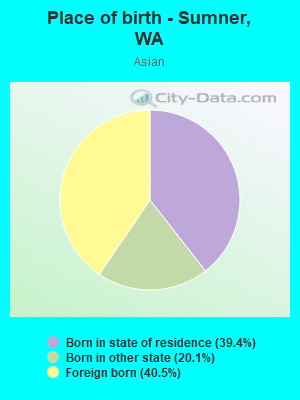
Place of birth - Born in state of residence (%) - Asian
Place of birth - Born in state of residence (%) - Hispanic or Latino
Place of birth - Born in state of residence (%) - American Indian and Alaska Native
Place of birth - Born in state of residence (%) - Multirace
Place of birth - Born in state of residence (%) - Other Race
Place of birth - Born in other state (%)
Place of birth - Born in other state (%) - White
Place of birth - Born in other state (%) - Black or African American
Place of birth - Born in other state (%) - Asian
Place of birth - Born in other state (%) - Hispanic or Latino
Place of birth - Born in other state (%) - American Indian and Alaska Native
Place of birth - Born in other state (%) - Multirace
Place of birth - Born in other state (%) - Other Race
Place of birth - Native, outside of US (%)
Place of birth - Native, outside of US (%) - White
Place of birth - Native, outside of US (%) - Black or African American
Place of birth - Native, outside of US (%) - Asian
Place of birth - Native, outside of US (%) - Hispanic or Latino
Place of birth - Native, outside of US (%) - American Indian and Alaska Native
Place of birth - Native, outside of US (%) - Multirace
Place of birth - Native, outside of US (%) - Other Race
Place of birth - Foreign born (%)
Place of birth - Foreign born (%) - White
Place of birth - Foreign born (%) - Black or African American
Place of birth - Foreign born (%) - Asian
Place of birth - Foreign born (%) - Hispanic or Latino
Place of birth - Foreign born (%) - American Indian and Alaska Native
Place of birth - Foreign born (%) - Multirace
Place of birth - Foreign born (%) - Other Race
Residents speaking English at home (%)
Residents speaking English at home - Born in the United States (%)
Residents speaking English at home - Native, born elsewhere (%)
Residents speaking English at home - Foreign born (%)
Residents speaking Spanish at home (%)
Residents speaking Spanish at home - Born in the United States (%)
Residents speaking Spanish at home - Native, born elsewhere (%)
Residents speaking Spanish at home - Foreign born (%)
Residents speaking other language at home (%)
Residents speaking other language at home - Born in the United States (%)
Residents speaking other language at home - Native, born elsewhere (%)
Residents speaking other language at home - Foreign born (%)
Marital status - Never married (%)
Marital status - Now married (%)
Marital status - Separated (%)
Marital status - Widowed (%)
Marital status - Divorced (%)
Ancestries Reported - Arab (%)
Ancestries Reported - Czech (%)
Ancestries Reported - Danish (%)
Ancestries Reported - Dutch (%)
Ancestries Reported - English (%)
Ancestries Reported - French (%)
Ancestries Reported - French Canadian (%)
Ancestries Reported - German (%)
Ancestries Reported - Greek (%)
Ancestries Reported - Hungarian (%)
Ancestries Reported - Irish (%)
Ancestries Reported - Italian (%)
Ancestries Reported - Lithuanian (%)
Ancestries Reported - Norwegian (%)
Ancestries Reported - Polish (%)
Ancestries Reported - Portuguese (%)
Ancestries Reported - Russian (%)
Ancestries Reported - Scotch-Irish (%)
Ancestries Reported - Scottish (%)
Ancestries Reported - Slovak (%)
Ancestries Reported - Subsaharan African (%)
Ancestries Reported - Swedish (%)
Ancestries Reported - Swiss (%)
Ancestries Reported - Ukrainian (%)
Ancestries Reported - United States (%)
Ancestries Reported - Welsh (%)
Ancestries Reported - West Indian (%)
Ancestries Reported - Other (%)
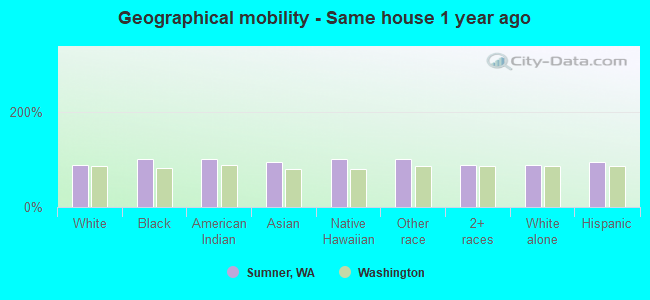
Geographical mobility - Same house 1 year ago (%)
Geographical mobility - Same house 1 year ago (%) - White
Geographical mobility - Same house 1 year ago (%) - Black or African American
Geographical mobility - Same house 1 year ago (%) - Asian
Geographical mobility - Same house 1 year ago (%) - Hispanic or Latino
Geographical mobility - Same house 1 year ago (%) - American Indian and Alaska Native
Geographical mobility - Same house 1 year ago (%) - Multirace
Geographical mobility - Same house 1 year ago (%) - Other Race
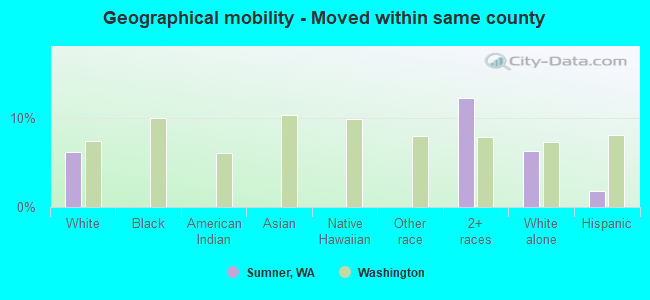
Geographical mobility - Moved within same county (%)
Geographical mobility - Moved within same county (%) - White
Geographical mobility - Moved within same county (%) - Black or African American
Geographical mobility - Moved within same county (%) - Asian
Geographical mobility - Moved within same county (%) - Hispanic or Latino
Geographical mobility - Moved within same county (%) - American Indian and Alaska Native
Geographical mobility - Moved within same county (%) - Multirace
Geographical mobility - Moved within same county (%) - Other Race
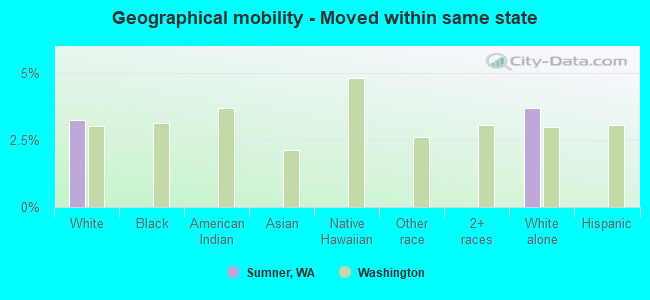
Geographical mobility - Moved from different county within same state (%)
Geographical mobility - Moved from different county within same state (%) - White
Geographical mobility - Moved from different county within same state (%) - Black or African American
Geographical mobility - Moved from different county within same state (%) - Asian
Geographical mobility - Moved from different county within same state (%) - Hispanic or Latino
Geographical mobility - Moved from different county within same state (%) - American Indian and Alaska Native
Geographical mobility - Moved from different county within same state (%) - Multirace
Geographical mobility - Moved from different county within same state (%) - Other Race
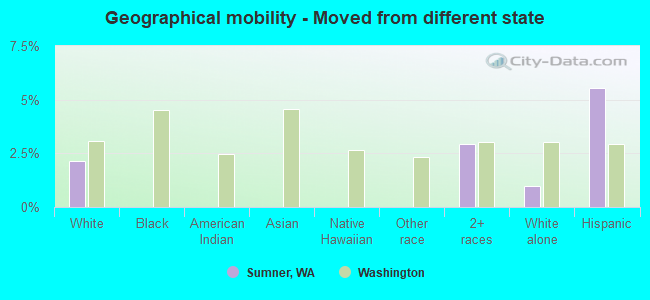
Geographical mobility - Moved from different state (%)
Geographical mobility - Moved from different state (%) - White
Geographical mobility - Moved from different state (%) - Black or African American
Geographical mobility - Moved from different state (%) - Asian
Geographical mobility - Moved from different state (%) - Hispanic or Latino
Geographical mobility - Moved from different state (%) - American Indian and Alaska Native
Geographical mobility - Moved from different state (%) - Multirace
Geographical mobility - Moved from different state (%) - Other Race
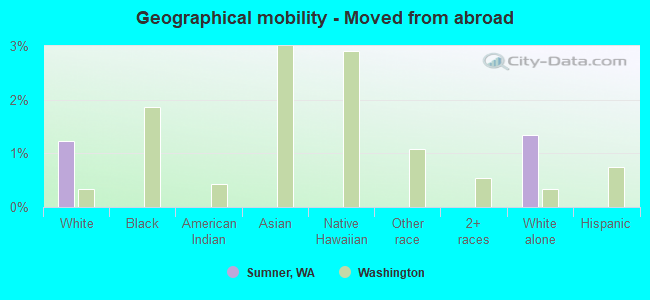
Geographical mobility - Moved from abroad (%)
Geographical mobility - Moved from abroad (%) - White
Geographical mobility - Moved from abroad (%) - Black or African American
Geographical mobility - Moved from abroad (%) - Asian
Geographical mobility - Moved from abroad (%) - Hispanic or Latino
Geographical mobility - Moved from abroad (%) - American Indian and Alaska Native
Geographical mobility - Moved from abroad (%) - Multirace
Geographical mobility - Moved from abroad (%) - Other Race
Place of birth for the foreign-born population - Ireland (%)
Place of birth for the foreign-born population - Denmark (%)
Place of birth for the foreign-born population - Norway (%)
Place of birth for the foreign-born population - Sweden (%)
Place of birth for the foreign-born population - United Kingdom (%)
Place of birth for the foreign-born population - England (%)
Place of birth for the foreign-born population - Scotland (%)
Place of birth for the foreign-born population - Other Northern Europe (%)
Place of birth for the foreign-born population - Austria (%)
Place of birth for the foreign-born population - Belgium (%)
Place of birth for the foreign-born population - France (%)
Place of birth for the foreign-born population - Germany (%)
Place of birth for the foreign-born population - Netherlands (%)
Place of birth for the foreign-born population - Switzerland (%)
Place of birth for the foreign-born population - Other Western Europe (%)
Place of birth for the foreign-born population - Greece (%)
Place of birth for the foreign-born population - Italy (%)
Place of birth for the foreign-born population - Portugal (%)
Place of birth for the foreign-born population - Spain (%)
Place of birth for the foreign-born population - Other Southern Europe (%)
Place of birth for the foreign-born population - Albania (%)
Place of birth for the foreign-born population - Belarus (%)
Place of birth for the foreign-born population - Bosnia and Herzegovina (%)
Place of birth for the foreign-born population - Bulgaria (%)
Place of birth for the foreign-born population - Croatia (%)
Place of birth for the foreign-born population - Czechoslovakia (%)
Place of birth for the foreign-born population - Hungary (%)
Place of birth for the foreign-born population - Latvia (%)
Place of birth for the foreign-born population - Lithuania (%)
Place of birth for the foreign-born population - North Macedonia (Macedonia) (%)
Place of birth for the foreign-born population - Moldova (%)
Place of birth for the foreign-born population - Poland (%)
Place of birth for the foreign-born population - Romania (%)
Place of birth for the foreign-born population - Russia (%)
Place of birth for the foreign-born population - Serbia (%)
Place of birth for the foreign-born population - Ukraine (%)
Place of birth for the foreign-born population - Other Eastern Europe (%)
Place of birth for the foreign-born population - China (%)
Place of birth for the foreign-born population - Hong Kong (%)
Place of birth for the foreign-born population - Taiwan (%)
Place of birth for the foreign-born population - Japan (%)
Place of birth for the foreign-born population - Korea (%)
Place of birth for the foreign-born population - Other Eastern Asia (%)
Place of birth for the foreign-born population - Afghanistan (%)
Place of birth for the foreign-born population - Bangladesh (%)
Place of birth for the foreign-born population - India (%)
Place of birth for the foreign-born population - Iran (%)
Place of birth for the foreign-born population - Kazakhstan (%)
Place of birth for the foreign-born population - Nepal (%)
Place of birth for the foreign-born population - Pakistan (%)
Place of birth for the foreign-born population - Sri Lanka (%)
Place of birth for the foreign-born population - Uzbekistan (%)
Place of birth for the foreign-born population - Other South Central Asia (%)
Place of birth for the foreign-born population - Burma (%)
Place of birth for the foreign-born population - Cambodia (%)
Place of birth for the foreign-born population - Indonesia (%)
Place of birth for the foreign-born population - Laos (%)
Place of birth for the foreign-born population - Malaysia (%)
Place of birth for the foreign-born population - Philippines (%)
Place of birth for the foreign-born population - Singapore (%)
Place of birth for the foreign-born population - Thailand (%)
Place of birth for the foreign-born population - Vietnam (%)
Place of birth for the foreign-born population - Other South Eastern Asia (%)
Place of birth for the foreign-born population - Armenia (%)
Place of birth for the foreign-born population - Iraq (%)
Place of birth for the foreign-born population - Israel (%)
Place of birth for the foreign-born population - Jordan (%)
Place of birth for the foreign-born population - Kuwait (%)
Place of birth for the foreign-born population - Lebanon (%)
Place of birth for the foreign-born population - Saudi Arabia (%)
Place of birth for the foreign-born population - Syria (%)
Place of birth for the foreign-born population - Turkey (%)
Place of birth for the foreign-born population - Yemen (%)
Place of birth for the foreign-born population - Other Western Asia (%)
Place of birth for the foreign-born population - Eritrea (%)
Place of birth for the foreign-born population - Ethiopia (%)
Place of birth for the foreign-born population - Kenya (%)
Place of birth for the foreign-born population - Somalia (%)
Place of birth for the foreign-born population - Uganda (%)
Place of birth for the foreign-born population - Zimbabwe (%)
Place of birth for the foreign-born population - Other Eastern Africa (%)
Place of birth for the foreign-born population - Cameroon (%)
Place of birth for the foreign-born population - Congo (%)
Place of birth for the foreign-born population - Democratic Republic of Congo (Zaire) (%)
Place of birth for the foreign-born population - Other Middle Africa (%)
Place of birth for the foreign-born population - Egypt (%)
Place of birth for the foreign-born population - Morocco (%)
Place of birth for the foreign-born population - Sudan (%)
Place of birth for the foreign-born population - Other Northern Africa (%)
Place of birth for the foreign-born population - South Africa (%)
Place of birth for the foreign-born population - Other Southern Africa (%)
Place of birth for the foreign-born population - Cabo Verde (%)
Place of birth for the foreign-born population - Ghana (%)
Place of birth for the foreign-born population - Liberia (%)
Place of birth for the foreign-born population - Nigeria (%)
Place of birth for the foreign-born population - Senegal (%)
Place of birth for the foreign-born population - Sierra Leone (%)
Place of birth for the foreign-born population - Other Western Africa (%)
Place of birth for the foreign-born population - Australia (%)
Place of birth for the foreign-born population - New Zealand (%)
Place of birth for the foreign-born population - Fiji (%)
Place of birth for the foreign-born population - Micronesia (%)
Place of birth for the foreign-born population - Bahamas (%)
Place of birth for the foreign-born population - Barbados (%)
Place of birth for the foreign-born population - Cuba (%)
Place of birth for the foreign-born population - Dominica (%)
Place of birth for the foreign-born population - Dominican Republic (%)
Place of birth for the foreign-born population - Grenada (%)
Place of birth for the foreign-born population - Haiti (%)
Place of birth for the foreign-born population - Jamaica (%)
Place of birth for the foreign-born population - St. Vincent and the Grenadines (%)
Place of birth for the foreign-born population - Trinidad and Tobago (%)
Place of birth for the foreign-born population - West Indies (%)
Place of birth for the foreign-born population - Other Caribbean (%)
Place of birth for the foreign-born population - Belize (%)
Place of birth for the foreign-born population - Costa Rica (%)
Place of birth for the foreign-born population - El Salvador (%)
Place of birth for the foreign-born population - Guatemala (%)
Place of birth for the foreign-born population - Honduras (%)
Place of birth for the foreign-born population - Mexico (%)
Place of birth for the foreign-born population - Nicaragua (%)
Place of birth for the foreign-born population - Panama (%)
Place of birth for the foreign-born population - Other Central America (%)
Place of birth for the foreign-born population - Argentina (%)
Place of birth for the foreign-born population - Bolivia (%)
Place of birth for the foreign-born population - Brazil (%)
Place of birth for the foreign-born population - Chile (%)
Place of birth for the foreign-born population - Colombia (%)
Place of birth for the foreign-born population - Ecuador (%)
Place of birth for the foreign-born population - Guyana (%)
Place of birth for the foreign-born population - Peru (%)
Place of birth for the foreign-born population - Uruguay (%)
Place of birth for the foreign-born population - Venezuela (%)
Place of birth for the foreign-born population - Other South America (%)
Place of birth for the foreign-born population - Canada (%)
Place of birth for the foreign-born population - Other Northern America (%)
Place of birth for the foreign-born population - Other (%)
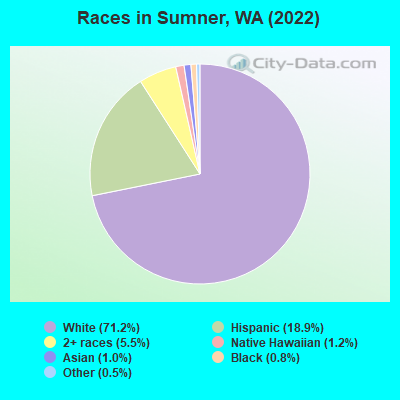
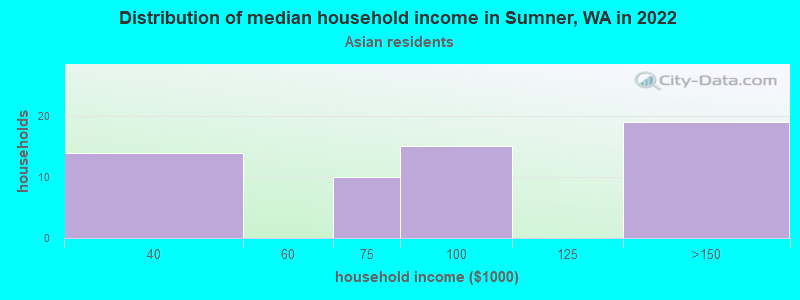
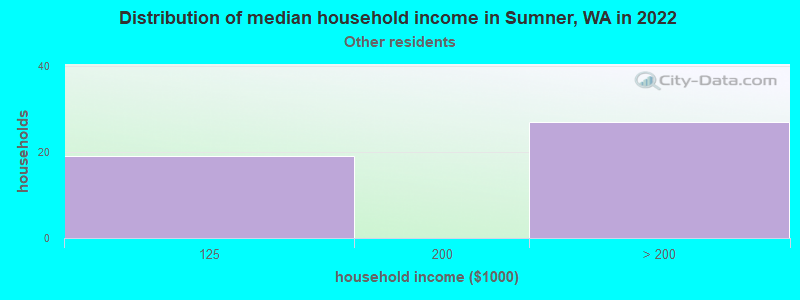
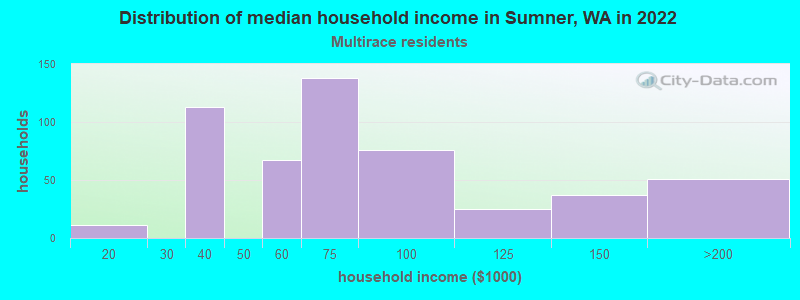
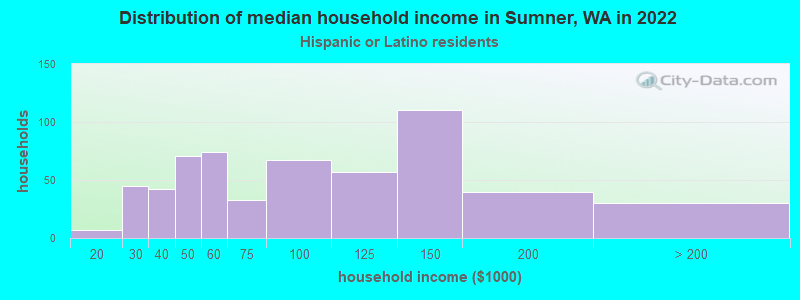
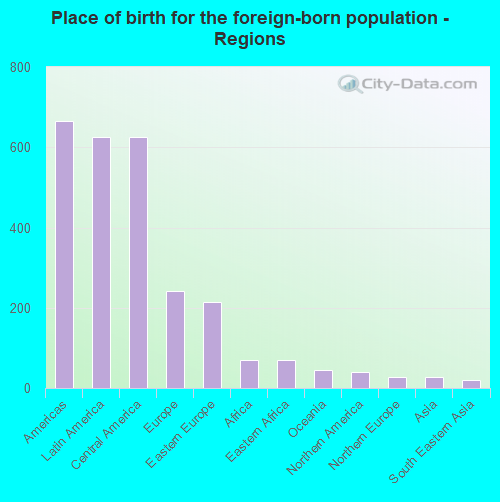
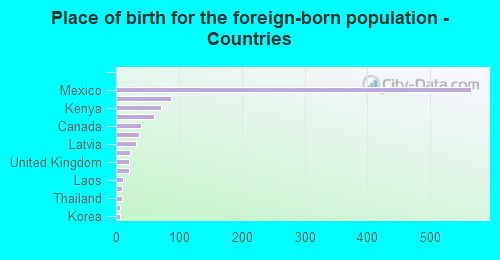
According to 2022 data, the most numerous races in Sumner, WA are White alone (7,611 residents), Hispanic (2,023 residents), and Asian alone (112 residents). 85.7% of Sumner residents speak English at home. 9.8% of Sumner, WA residents are foreign-born (5.7% born in Latin America, 2.2% born in Europe), which is 52.5% less than the foreign-born rate of 15.0% across the entire state of Washington.
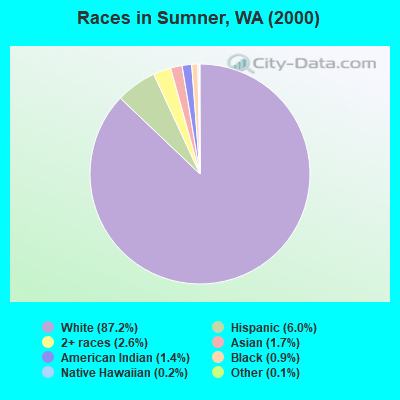
Race distribution in Sumner
2000 2022
4,652,490 78.9% White alone 441,509 7.5% Hispanic 319,401 5.4% Asian alone 184,631 3.1% Black alone 175,926 3.0% Two or more races 85,396 1.4% American Indian alone 22,779 0.4% Native Hawaiian and Other 11,989 0.2% Other race alone
4,941,456 63.5% White alone 1,093,313 14.0% Hispanic 755,832 9.7% Asian alone 523,448 6.7% Two or more races 299,537 3.8% Black alone 69,024 0.9% American Indian alone 52,231 0.7% Native Hawaiian and Other 50,945 0.7% Other race alone
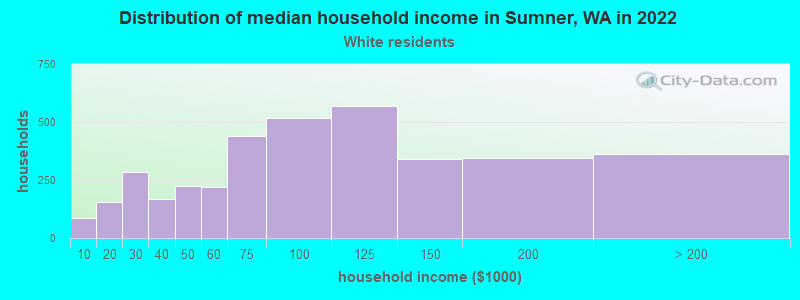
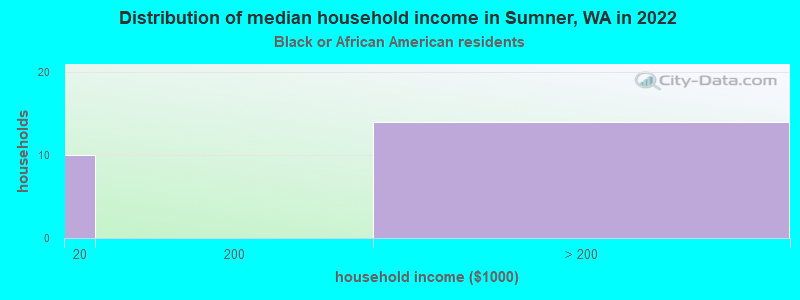
Income and house value in Sumner Median household income in 2022 $87,924 White non-Hispanic householders$75,962 Asian householders$78,367 Two or more races householders$77,111 Hispanic or Latino race householdersMedian 2022 house value $557,772 White Non-Hispanic householders$633,832 Black or African American householders$599,898 American Indian or Alaska Native householders $633,832 Asian householders$536,319 Native Hawaiian and other Pacific Islander householders$542,560 Two or more races householders$438,807 Hispanic or Latino householders
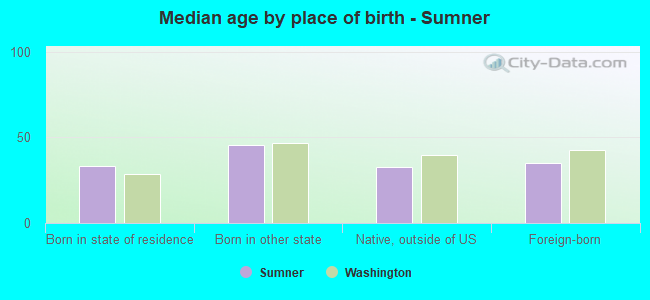
Median age by race in Sumner
41.6 Median age for White residents39.6 43.6 43.5 Median age for Black or African American residents42.7 -716,122,650.1 15.1 Median age for American Indian / Alaska Native residents-622,057,000.6 21.9 33.9 Median age for Asian residents37.5 31.0 42.0 Median age for Native Hawaiian / Pacific Islander residents50.1 38.5 7.6 Median age for Other race residents6.4 11.8 26.4 Median age for Two or more races residents28.6 14.4 42.7 Median age for White alone residents41.4 43.8 24.5 Median age for Hispanic or Latino residents20.1 26.6
Owner/renter occupied households by race in Sumner
House owners and renters - White residents 2,000 53.4% Owner occupied1,743 46.6% Renter occupiedHouse owners and renters - Black or African American residents 28 100.0% Renter occupiedHouse owners and renters - American Indian / Alaska Native residents 27 100.0% Owner occupiedHouse owners and renters - Asian residents 34 50.1% Owner occupied33 49.9% Renter occupiedHouse owners and renters - Native Hawaiian / Pacific Islander residents 53 100.0% Renter occupiedHouse owners and renters - Other race residents 41 100.0% Owner occupiedHouse owners and renters - Two or more races residents 73 13.7% Owner occupied458 86.3% Renter occupiedHouse owners and renters - White alone residents 1,896 54.3% Owner occupied1,596 45.7% Renter occupiedHouse owners and renters - Hispanic or Latino residents 228 38.5% Owner occupied364 61.5% Renter occupied
Language usage in Sumner
English speakers - Total 85.7% of residents of Sumner speak English at home.
9.3% of residents speak Spanish at home 498 53.8% Speak English very well427 46.2% Speak English less than very well4.4% of residents speak other language at home 211 48.1% Speak English very well228 51.9% Speak English less than very well
English speakers - Born in the United States 95.1% of residents of Sumner speak English at home.
3.7% of residents speak Spanish at home 121 90.3% Speak English very well13 9.7% Speak English less than very well1.1% of residents speak other language at home 40 100.0% Speak English very well
English speakers - Native, born elsewhere 81.8% of residents of Sumner speak English at home.
10.4% of residents speak Spanish at home 8 100.0% Speak English less than very well
English speakers - Foreign-born 14.0% of residents of Sumner speak English at home.
53.7% of residents speak Spanish at home 184 31.6% Speak English very well398 68.4% Speak English less than very well28.6% of residents speak other language at home 82 26.5% Speak English very well228 73.5% Speak English less than very well
White (Caucasian) - Speak only English Native:
97.4% (7,201)Foreign-born:
12.7% (67)
White (Caucasian) - Speak another language Native:
2.7% (197)Foreign-born:
90.5% (477)
Asian - Speak only English Native:
100.0% (68)Foreign-born:
100.0% (44)
Other race - Speak only English Native:
76.2% (99)Foreign-born:
31.4% (15)
Other race - Speak another language Native:
24.9% (32)Foreign-born:
70.7% (34)
Two or more races - Speak only English Native:
78.3% (697)Foreign-born:
3.3% (16)
Two or more races - Speak another language Native:
22.5% (201)Foreign-born:
100.0% (476)
White alone - Speak only English Native:
98.4% (6,965)Foreign-born:
26.3% (71)
White alone - Speak another language Native:
1.7% (119)Foreign-born:
75.7% (204)
Hispanic or Latino - Speak only English Native:
65.5% (654)Foreign-born:
2.5% (16)
Hispanic or Latino - Speak another language Native:
34.6% (346)Foreign-born:
98.8% (628)
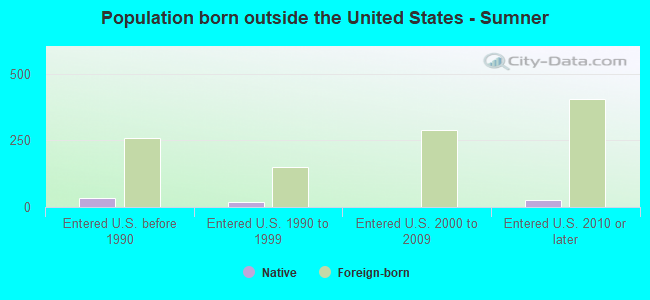
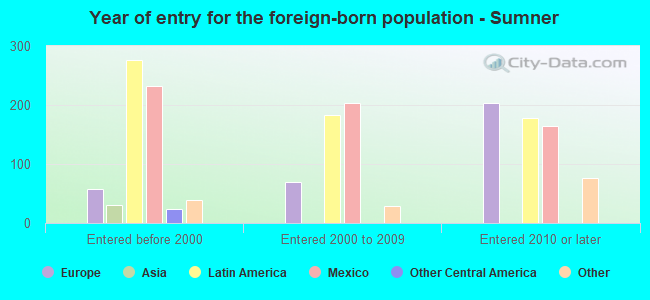
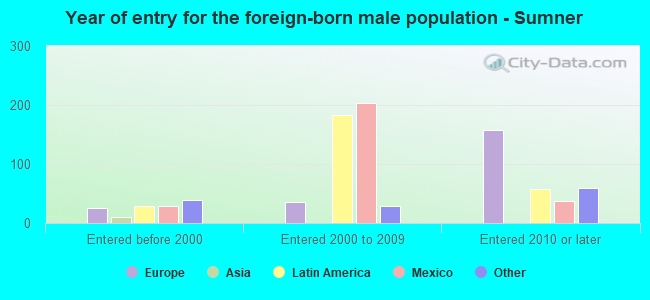
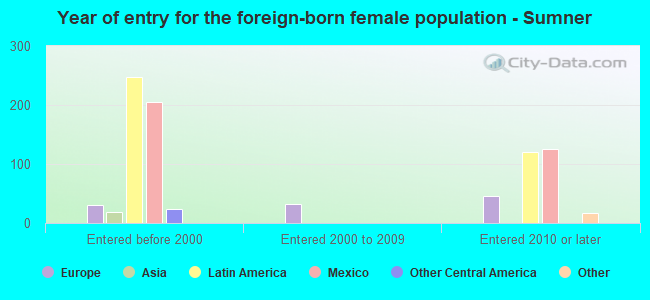
Foreign-born residents in Sumner 1,051 residents are foreign born (5.7% Latin America , 2.2% Europe ).
This city:
9.8%Washington:
14.9%
Marital status for residents in Sumner Marital status - White (Caucasian) population 15 years and over
Males 36.4% Never married46.0% Now married2.8% Separated3.2% Widowed11.6% DivorcedFemales 24.8% Never married43.8% Now married6.2% Separated7.0% Widowed18.3% DivorcedWomen who gave birth in the past 12 months Now married:
87.9% (109)Unmarried:
12.1% (15)
Women who did not give birth in the past 12 months Now married:
46.1% (869)Unmarried:
53.9% (1,016)
Marital status - Black or African American population 15 years and over
Males 43.3% Never married35.8% Now married20.9% Separated0.0% Widowed0.0% DivorcedFemales 0.0% Never married0.0% Now married52.2% Separated0.0% Widowed47.8% DivorcedWomen who did not give birth in the past 12 months Now married:
52.2% (12)Unmarried:
47.8% (11)
Marital status - American Indian / Alaska Native population 15 years and over
Males 100.0% Never married0.0% Now married0.0% Separated0.0% Widowed0.0% DivorcedFemales 100.0% Never married0.0% Now married0.0% Separated0.0% Widowed0.0% DivorcedWomen who did not give birth in the past 12 months Now married:
0.0% (0)Unmarried:
100.0% (75)
Marital status - Asian population 15 years and over
Males 0.0% Never married41.7% Now married0.0% Separated0.0% Widowed58.3% DivorcedFemales 34.0% Never married32.1% Now married0.0% Separated34.0% Widowed0.0% DivorcedWomen who did not give birth in the past 12 months Now married:
48.6% (18)Unmarried:
51.4% (19)
Marital status - Native Hawaiian / Pacific Islander population 15 years and over
Males 23.8% Never married76.2% Now married0.0% Separated0.0% Widowed0.0% DivorcedFemales 100.0% Never married0.0% Now married0.0% Separated0.0% Widowed0.0% DivorcedWomen who did not give birth in the past 12 months Now married:
0.0% (0)Unmarried:
100.0% (43)
Marital status - Other race population 15 years and over
Males 70.6% Never married29.4% Now married0.0% Separated0.0% Widowed0.0% DivorcedFemales 38.0% Never married40.8% Now married21.1% Separated0.0% Widowed0.0% DivorcedWomen who gave birth in the past 12 months Now married:
0.0% (0)Unmarried:
100.0% (21)
Women who did not give birth in the past 12 months Now married:
84.6% (48)Unmarried:
15.4% (9)
Marital status - Two or more races population 15 years and over
Males 67.9% Never married29.1% Now married0.0% Separated0.0% Widowed3.1% DivorcedFemales 30.9% Never married48.5% Now married6.1% Separated2.3% Widowed12.2% DivorcedWomen who did not give birth in the past 12 months Now married:
55.6% (164)Unmarried:
44.4% (132)
Marital status - White alone, not Hispanic / Latino population 15 years and over
Males 35.4% Never married46.2% Now married3.0% Separated3.5% Widowed11.9% DivorcedFemales 25.9% Never married41.7% Now married5.4% Separated7.6% Widowed19.4% DivorcedWomen who gave birth in the past 12 months Now married:
84.2% (82)Unmarried:
15.8% (15)
Women who did not give birth in the past 12 months Now married:
44.7% (811)Unmarried:
55.3% (1,002)
Marital status - Hispanic or Latino population 15 years and over
Males 50.2% Never married45.6% Now married0.0% Separated0.0% Widowed4.1% DivorcedFemales 31.4% Never married52.2% Now married12.0% Separated0.9% Widowed3.4% DivorcedWomen who gave birth in the past 12 months Now married:
62.0% (34)Unmarried:
38.0% (21)
Women who did not give birth in the past 12 months Now married:
55.5% (250)Unmarried:
44.5% (200)
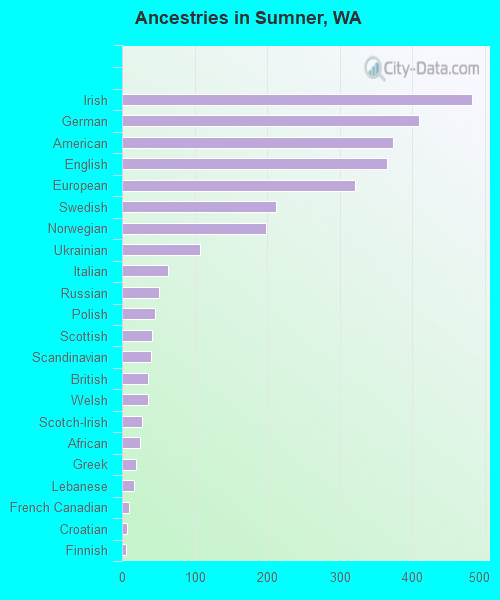
Ancestries in Sumner
482 10.5% Irish410 9.0% German374 8.2% American365 8.0% English321 7.0% European212 4.6% Swedish199 4.4% Norwegian107 2.3% Ukrainian63 1.4% Italian51 1.1% Russian46 1.0% Polish41 0.9% Scottish40 0.9% Scandinavian36 0.8% British36 0.8% Welsh28 0.6% Scotch-Irish25 0.5% African19 0.4% Greek17 0.4% Lebanese9 0.2% French Canadian7 0.2% Croatian6 0.1% Finnish4 0.09% French
Children Nativity (place of birth) in Sumner
Children under 6 years - Living with two parents Both parents native 228 100.0% NativeBoth parents foreign-born 84 100.0% NativeOne native, one foreign-born parent 141 100.0% NativeChildren under 6 years - Living with one parent Native parent 280 100.0% NativeChildren 6 to 17 years - Living with two parents Both parents native 429 100.0% NativeBoth parents foreign-born 118 35.8% Native210 64.2% Foreign-bornOne native, one foreign-born parent 35 100.0% NativeChildren 6 to 17 years - Living with one parent Native parent 638 100.0% NativeForeign-born parent 109 49.7% Native111 50.3% Foreign-born
Grandparents responsible for own grandchildren in Sumner
Grandparents (30 to 59 years) White / Caucasian 15 100.0% Not responsible for grandchildrenAmerican Indian / Alaska Native 29 100.0% Not responsible for grandchildrenWhite alone, not Hispanic / Latino 15 100.0% Not responsible for grandchildrenHispanic or Latino 55 100.0% Not responsible for grandchildrenGrandparents (60 years and over) White / Caucasian 87 56.6% Responsible for grandchildren67 43.4% Not responsible for grandchildrenWhite alone, not Hispanic / Latino 91 57.5% Responsible for grandchildren67 42.5% Not responsible for grandchildren