Races in Sycamore, Illinois (IL) Detailed Stats
Data:
Races - White alone (%)
Races - White alone (% change since 2000)
Races - Black alone (%)
Races - Black alone (% change since 2000)
Races - American Indian alone (%)
Races - American Indian alone (% change since 2000)
Races - Asian alone (%)
Races - Asian alone (% change since 2000)
Races - Hispanic (%)
Races - Hispanic (% change since 2000)
Races - Native Hawaiian and Other Pacific Islander alone (%)
Races - Native Hawaiian and Other Pacific Islander alone (% change since 2000)
Races - Two or more races(%)
Races - Two or more races(% change since 2000)
Races - Other race alone (%)
Races - Other race alone (% change since 2000)
Racial diversity
Place of birth - Born in state of residence (%)
Place of birth - Born in state of residence (%) - White
Place of birth - Born in state of residence (%) - Black or African American
Place of birth - Born in state of residence (%) - Asian
Place of birth - Born in state of residence (%) - Hispanic or Latino
Place of birth - Born in state of residence (%) - American Indian and Alaska Native
Place of birth - Born in state of residence (%) - Multirace
Place of birth - Born in state of residence (%) - Other Race
Place of birth - Born in other state (%)
Place of birth - Born in other state (%) - White
Place of birth - Born in other state (%) - Black or African American
Place of birth - Born in other state (%) - Asian
Place of birth - Born in other state (%) - Hispanic or Latino
Place of birth - Born in other state (%) - American Indian and Alaska Native
Place of birth - Born in other state (%) - Multirace
Place of birth - Born in other state (%) - Other Race
Place of birth - Native, outside of US (%)
Place of birth - Native, outside of US (%) - White
Place of birth - Native, outside of US (%) - Black or African American
Place of birth - Native, outside of US (%) - Asian
Place of birth - Native, outside of US (%) - Hispanic or Latino
Place of birth - Native, outside of US (%) - American Indian and Alaska Native
Place of birth - Native, outside of US (%) - Multirace
Place of birth - Native, outside of US (%) - Other Race
Place of birth - Foreign born (%)
Place of birth - Foreign born (%) - White
Place of birth - Foreign born (%) - Black or African American
Place of birth - Foreign born (%) - Asian
Place of birth - Foreign born (%) - Hispanic or Latino
Place of birth - Foreign born (%) - American Indian and Alaska Native
Place of birth - Foreign born (%) - Multirace
Place of birth - Foreign born (%) - Other Race
Residents speaking English at home (%)
Residents speaking English at home - Born in the United States (%)
Residents speaking English at home - Native, born elsewhere (%)
Residents speaking English at home - Foreign born (%)
Residents speaking Spanish at home (%)
Residents speaking Spanish at home - Born in the United States (%)
Residents speaking Spanish at home - Native, born elsewhere (%)
Residents speaking Spanish at home - Foreign born (%)
Residents speaking other language at home (%)
Residents speaking other language at home - Born in the United States (%)
Residents speaking other language at home - Native, born elsewhere (%)
Residents speaking other language at home - Foreign born (%)
Marital status - Never married (%)
Marital status - Now married (%)
Marital status - Separated (%)
Marital status - Widowed (%)
Marital status - Divorced (%)
Ancestries Reported - Arab (%)
Ancestries Reported - Czech (%)
Ancestries Reported - Danish (%)
Ancestries Reported - Dutch (%)
Ancestries Reported - English (%)
Ancestries Reported - French (%)
Ancestries Reported - French Canadian (%)
Ancestries Reported - German (%)
Ancestries Reported - Greek (%)
Ancestries Reported - Hungarian (%)
Ancestries Reported - Irish (%)
Ancestries Reported - Italian (%)
Ancestries Reported - Lithuanian (%)
Ancestries Reported - Norwegian (%)
Ancestries Reported - Polish (%)
Ancestries Reported - Portuguese (%)
Ancestries Reported - Russian (%)
Ancestries Reported - Scotch-Irish (%)
Ancestries Reported - Scottish (%)
Ancestries Reported - Slovak (%)
Ancestries Reported - Subsaharan African (%)
Ancestries Reported - Swedish (%)
Ancestries Reported - Swiss (%)
Ancestries Reported - Ukrainian (%)
Ancestries Reported - United States (%)
Ancestries Reported - Welsh (%)
Ancestries Reported - West Indian (%)
Ancestries Reported - Other (%)
Geographical mobility - Same house 1 year ago (%)
Geographical mobility - Same house 1 year ago (%) - White
Geographical mobility - Same house 1 year ago (%) - Black or African American
Geographical mobility - Same house 1 year ago (%) - Asian
Geographical mobility - Same house 1 year ago (%) - Hispanic or Latino
Geographical mobility - Same house 1 year ago (%) - American Indian and Alaska Native
Geographical mobility - Same house 1 year ago (%) - Multirace
Geographical mobility - Same house 1 year ago (%) - Other Race
Geographical mobility - Moved within same county (%)
Geographical mobility - Moved within same county (%) - White
Geographical mobility - Moved within same county (%) - Black or African American
Geographical mobility - Moved within same county (%) - Asian
Geographical mobility - Moved within same county (%) - Hispanic or Latino
Geographical mobility - Moved within same county (%) - American Indian and Alaska Native
Geographical mobility - Moved within same county (%) - Multirace
Geographical mobility - Moved within same county (%) - Other Race
Geographical mobility - Moved from different county within same state (%)
Geographical mobility - Moved from different county within same state (%) - White
Geographical mobility - Moved from different county within same state (%) - Black or African American
Geographical mobility - Moved from different county within same state (%) - Asian
Geographical mobility - Moved from different county within same state (%) - Hispanic or Latino
Geographical mobility - Moved from different county within same state (%) - American Indian and Alaska Native
Geographical mobility - Moved from different county within same state (%) - Multirace
Geographical mobility - Moved from different county within same state (%) - Other Race
Geographical mobility - Moved from different state (%)
Geographical mobility - Moved from different state (%) - White
Geographical mobility - Moved from different state (%) - Black or African American
Geographical mobility - Moved from different state (%) - Asian
Geographical mobility - Moved from different state (%) - Hispanic or Latino
Geographical mobility - Moved from different state (%) - American Indian and Alaska Native
Geographical mobility - Moved from different state (%) - Multirace
Geographical mobility - Moved from different state (%) - Other Race
Geographical mobility - Moved from abroad (%)
Geographical mobility - Moved from abroad (%) - White
Geographical mobility - Moved from abroad (%) - Black or African American
Geographical mobility - Moved from abroad (%) - Asian
Geographical mobility - Moved from abroad (%) - Hispanic or Latino
Geographical mobility - Moved from abroad (%) - American Indian and Alaska Native
Geographical mobility - Moved from abroad (%) - Multirace
Geographical mobility - Moved from abroad (%) - Other Race
Place of birth for the foreign-born population - Ireland (%)
Place of birth for the foreign-born population - Denmark (%)
Place of birth for the foreign-born population - Norway (%)
Place of birth for the foreign-born population - Sweden (%)
Place of birth for the foreign-born population - United Kingdom (%)
Place of birth for the foreign-born population - England (%)
Place of birth for the foreign-born population - Scotland (%)
Place of birth for the foreign-born population - Other Northern Europe (%)
Place of birth for the foreign-born population - Austria (%)
Place of birth for the foreign-born population - Belgium (%)
Place of birth for the foreign-born population - France (%)
Place of birth for the foreign-born population - Germany (%)
Place of birth for the foreign-born population - Netherlands (%)
Place of birth for the foreign-born population - Switzerland (%)
Place of birth for the foreign-born population - Other Western Europe (%)
Place of birth for the foreign-born population - Greece (%)
Place of birth for the foreign-born population - Italy (%)
Place of birth for the foreign-born population - Portugal (%)
Place of birth for the foreign-born population - Spain (%)
Place of birth for the foreign-born population - Other Southern Europe (%)
Place of birth for the foreign-born population - Albania (%)
Place of birth for the foreign-born population - Belarus (%)
Place of birth for the foreign-born population - Bosnia and Herzegovina (%)
Place of birth for the foreign-born population - Bulgaria (%)
Place of birth for the foreign-born population - Croatia (%)
Place of birth for the foreign-born population - Czechoslovakia (%)
Place of birth for the foreign-born population - Hungary (%)
Place of birth for the foreign-born population - Latvia (%)
Place of birth for the foreign-born population - Lithuania (%)
Place of birth for the foreign-born population - North Macedonia (Macedonia) (%)
Place of birth for the foreign-born population - Moldova (%)
Place of birth for the foreign-born population - Poland (%)
Place of birth for the foreign-born population - Romania (%)
Place of birth for the foreign-born population - Russia (%)
Place of birth for the foreign-born population - Serbia (%)
Place of birth for the foreign-born population - Ukraine (%)
Place of birth for the foreign-born population - Other Eastern Europe (%)
Place of birth for the foreign-born population - China (%)
Place of birth for the foreign-born population - Hong Kong (%)
Place of birth for the foreign-born population - Taiwan (%)
Place of birth for the foreign-born population - Japan (%)
Place of birth for the foreign-born population - Korea (%)
Place of birth for the foreign-born population - Other Eastern Asia (%)
Place of birth for the foreign-born population - Afghanistan (%)
Place of birth for the foreign-born population - Bangladesh (%)
Place of birth for the foreign-born population - India (%)
Place of birth for the foreign-born population - Iran (%)
Place of birth for the foreign-born population - Kazakhstan (%)
Place of birth for the foreign-born population - Nepal (%)
Place of birth for the foreign-born population - Pakistan (%)
Place of birth for the foreign-born population - Sri Lanka (%)
Place of birth for the foreign-born population - Uzbekistan (%)
Place of birth for the foreign-born population - Other South Central Asia (%)
Place of birth for the foreign-born population - Burma (%)
Place of birth for the foreign-born population - Cambodia (%)
Place of birth for the foreign-born population - Indonesia (%)
Place of birth for the foreign-born population - Laos (%)
Place of birth for the foreign-born population - Malaysia (%)
Place of birth for the foreign-born population - Philippines (%)
Place of birth for the foreign-born population - Singapore (%)
Place of birth for the foreign-born population - Thailand (%)
Place of birth for the foreign-born population - Vietnam (%)
Place of birth for the foreign-born population - Other South Eastern Asia (%)
Place of birth for the foreign-born population - Armenia (%)
Place of birth for the foreign-born population - Iraq (%)
Place of birth for the foreign-born population - Israel (%)
Place of birth for the foreign-born population - Jordan (%)
Place of birth for the foreign-born population - Kuwait (%)
Place of birth for the foreign-born population - Lebanon (%)
Place of birth for the foreign-born population - Saudi Arabia (%)
Place of birth for the foreign-born population - Syria (%)
Place of birth for the foreign-born population - Turkey (%)
Place of birth for the foreign-born population - Yemen (%)
Place of birth for the foreign-born population - Other Western Asia (%)
Place of birth for the foreign-born population - Eritrea (%)
Place of birth for the foreign-born population - Ethiopia (%)
Place of birth for the foreign-born population - Kenya (%)
Place of birth for the foreign-born population - Somalia (%)
Place of birth for the foreign-born population - Uganda (%)
Place of birth for the foreign-born population - Zimbabwe (%)
Place of birth for the foreign-born population - Other Eastern Africa (%)
Place of birth for the foreign-born population - Cameroon (%)
Place of birth for the foreign-born population - Congo (%)
Place of birth for the foreign-born population - Democratic Republic of Congo (Zaire) (%)
Place of birth for the foreign-born population - Other Middle Africa (%)
Place of birth for the foreign-born population - Egypt (%)
Place of birth for the foreign-born population - Morocco (%)
Place of birth for the foreign-born population - Sudan (%)
Place of birth for the foreign-born population - Other Northern Africa (%)
Place of birth for the foreign-born population - South Africa (%)
Place of birth for the foreign-born population - Other Southern Africa (%)
Place of birth for the foreign-born population - Cabo Verde (%)
Place of birth for the foreign-born population - Ghana (%)
Place of birth for the foreign-born population - Liberia (%)
Place of birth for the foreign-born population - Nigeria (%)
Place of birth for the foreign-born population - Senegal (%)
Place of birth for the foreign-born population - Sierra Leone (%)
Place of birth for the foreign-born population - Other Western Africa (%)
Place of birth for the foreign-born population - Australia (%)
Place of birth for the foreign-born population - New Zealand (%)
Place of birth for the foreign-born population - Fiji (%)
Place of birth for the foreign-born population - Micronesia (%)
Place of birth for the foreign-born population - Bahamas (%)
Place of birth for the foreign-born population - Barbados (%)
Place of birth for the foreign-born population - Cuba (%)
Place of birth for the foreign-born population - Dominica (%)
Place of birth for the foreign-born population - Dominican Republic (%)
Place of birth for the foreign-born population - Grenada (%)
Place of birth for the foreign-born population - Haiti (%)
Place of birth for the foreign-born population - Jamaica (%)
Place of birth for the foreign-born population - St. Vincent and the Grenadines (%)
Place of birth for the foreign-born population - Trinidad and Tobago (%)
Place of birth for the foreign-born population - West Indies (%)
Place of birth for the foreign-born population - Other Caribbean (%)
Place of birth for the foreign-born population - Belize (%)
Place of birth for the foreign-born population - Costa Rica (%)
Place of birth for the foreign-born population - El Salvador (%)
Place of birth for the foreign-born population - Guatemala (%)
Place of birth for the foreign-born population - Honduras (%)
Place of birth for the foreign-born population - Mexico (%)
Place of birth for the foreign-born population - Nicaragua (%)
Place of birth for the foreign-born population - Panama (%)
Place of birth for the foreign-born population - Other Central America (%)
Place of birth for the foreign-born population - Argentina (%)
Place of birth for the foreign-born population - Bolivia (%)
Place of birth for the foreign-born population - Brazil (%)
Place of birth for the foreign-born population - Chile (%)
Place of birth for the foreign-born population - Colombia (%)
Place of birth for the foreign-born population - Ecuador (%)
Place of birth for the foreign-born population - Guyana (%)
Place of birth for the foreign-born population - Peru (%)
Place of birth for the foreign-born population - Uruguay (%)
Place of birth for the foreign-born population - Venezuela (%)
Place of birth for the foreign-born population - Other South America (%)
Place of birth for the foreign-born population - Canada (%)
Place of birth for the foreign-born population - Other Northern America (%)
Place of birth for the foreign-born population - Other (%)
Latest news about races in Sycamore, IL collected exclusively by city-data.com from local newspapers, TV, and radio stations
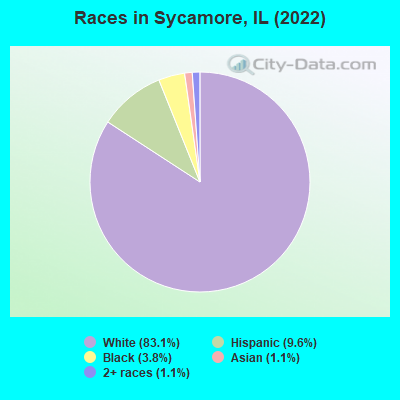
According to 2022 data, the most numerous races in Sycamore, IL are White alone (15,024 residents), Hispanic (1,728 residents), and Black alone (693 residents). 94.5% of Sycamore residents speak English at home. 5.0% of Sycamore, IL residents are foreign-born (1.9% born in Latin America, 1.6% born in Europe, 1.3% born in Asia), which is 182.6% less than the foreign-born rate of 14.0% across the entire state of Illinois.
Race distribution in Sycamore
2000 2022
8,424,140 67.8% White alone 1,856,152 14.9% Black alone 1,530,262 12.3% Hispanic 419,916 3.4% Asian alone 153,996 1.2% Two or more races 13,479 0.1% Other race alone 18,232 0.1% American Indian alone 3,116 0.03% Native Hawaiian and Other
7,356,301 58.5% White alone 2,299,726 18.3% Hispanic 1,660,423 13.2% Black alone 747,296 5.9% Asian alone 458,599 3.6% Two or more races 45,386 0.4% Other race alone 10,405 0.08% American Indian alone 3,896 0.03% Native Hawaiian and Other
Income and house value in Sycamore Median household income in 2022 $82,023 White non-Hispanic householders$57,225 Black householders$166,486 Asian householders$99,874 Some other race householders$43,914 Two or more races householders$52,686 Hispanic or Latino race householdersMedian 2022 house value $273,644 White Non-Hispanic householders$228,037 Black or African American householders$152,024 American Indian or Alaska Native householders $228,037 Asian householders$228,037 Some other race householders$192,564 Two or more races householders$397,900 Hispanic or Latino householders
Median age by race in Sycamore
39.6 Median age for White residents39.3 40.9 27.4 Median age for Black or African American residents8.0 48.5 -1,344,444,443.1 Median age for American Indian / Alaska Native residents-720,238,094.5 -959,446,092.0 45.4 Median age for Asian residents79.1 5.3 -593,236,714.4 Median age for Native Hawaiian / Pacific Islander residents-666,666,666.0 -666,666,666.0 53.1 Median age for Other race residents55.7 47.0 17.5 Median age for Two or more races residents16.8 17.8 40.4 Median age for White alone residents39.6 42.5 22.2 Median age for Hispanic or Latino residents27.8 19.7
Owner/renter occupied households by race in Sycamore
House owners and renters - White residents 5,035 74.4% Owner occupied1,736 25.6% Renter occupiedHouse owners and renters - Black or African American residents 50 23.8% Owner occupied159 76.2% Renter occupiedHouse owners and renters - Asian residents 61 100.0% Owner occupiedHouse owners and renters - Other race residents 128 91.6% Owner occupied12 8.4% Renter occupiedHouse owners and renters - Two or more races residents 106 68.5% Owner occupied49 31.5% Renter occupiedHouse owners and renters - White alone residents 5,098 75.4% Owner occupied1,667 24.6% Renter occupiedHouse owners and renters - Hispanic or Latino residents 237 59.5% Owner occupied161 40.5% Renter occupied
Language usage in Sycamore
English speakers - Total 94.5% of residents of Sycamore speak English at home.
4.1% of residents speak Spanish at home 463 65.3% Speak English very well246 34.7% Speak English less than very well1.5% of residents speak other language at home 178 70.1% Speak English very well76 29.9% Speak English less than very well
English speakers - Born in the United States 97.3% of residents of Sycamore speak English at home.
1.4% of residents speak Spanish at home 53 100.0% Speak English very well0.2% of residents speak other language at home 9 100.0% Speak English very well
All residents speak only English at home
English speakers - Foreign-born 49.3% of residents of Sycamore speak English at home.
37.0% of residents speak Spanish at home 80 26.9% Speak English very well217 73.1% Speak English less than very well21.7% of residents speak other language at home 105 60.3% Speak English very well69 39.7% Speak English less than very well
White (Caucasian) - Speak only English Native:
99.8% (14,202)Foreign-born:
45.5% (89)
White (Caucasian) - Speak another language Native:
1.1% (150)Foreign-born:
54.5% (107)
Asian - Speak only English Native:
70.2% (44)Foreign-born:
35.0% (51)
Asian - Speak another language Native:
29.3% (18)Foreign-born:
61.1% (90)
Other race - Speak another language Native:
63.8% (48)Foreign-born:
98.5% (186)
Two or more races - Speak another language Native:
28.9% (251)Foreign-born:
83.3% (139)
White alone - Speak only English Native:
99.1% (13,825)Foreign-born:
49.0% (172)
White alone - Speak another language Native:
0.8% (118)Foreign-born:
48.0% (169)
Hispanic or Latino - Speak another language Native:
25.8% (335)Foreign-born:
91.4% (309)
Foreign-born residents in Sycamore 896 residents are foreign born (1.9% Latin America , 1.6% Europe , 1.3% Asia ).
This city:
5.0%Illinois:
14.1%
Marital status for residents in Sycamore Marital status - White (Caucasian) population 15 years and over
Males 32.6% Never married56.8% Now married0.4% Separated1.5% Widowed8.7% DivorcedFemales 31.6% Never married47.0% Now married2.4% Separated6.7% Widowed12.3% DivorcedWomen who gave birth in the past 12 months Now married:
92.9% (154)Unmarried:
7.1% (12)
Women who did not give birth in the past 12 months Now married:
38.3% (1,406)Unmarried:
61.7% (2,262)
Marital status - Black or African American population 15 years and over
Males 79.0% Never married0.0% Now married0.0% Separated0.0% Widowed21.0% DivorcedFemales 59.9% Never married0.0% Now married0.0% Separated8.9% Widowed31.2% DivorcedWomen who did not give birth in the past 12 months Now married:
0.0% (0)Unmarried:
100.0% (166)
Marital status - Asian population 15 years and over
Males 11.5% Never married72.4% Now married16.1% Separated0.0% Widowed0.0% DivorcedFemales 11.9% Never married88.1% Now married0.0% Separated0.0% Widowed0.0% DivorcedWomen who did not give birth in the past 12 months Now married:
84.9% (45)Unmarried:
15.1% (8)
Marital status - Other race population 15 years and over
Males 32.9% Never married55.9% Now married5.6% Separated0.0% Widowed5.6% DivorcedFemales 11.1% Never married63.7% Now married0.0% Separated0.0% Widowed25.2% DivorcedWomen who gave birth in the past 12 months Now married:
100.0% (13)Unmarried:
0.0% (0)
Women who did not give birth in the past 12 months Now married:
60.5% (87)Unmarried:
39.5% (57)
Marital status - Two or more races population 15 years and over
Males 46.6% Never married47.5% Now married2.2% Separated3.6% Widowed0.0% DivorcedFemales 65.0% Never married34.6% Now married0.0% Separated0.0% Widowed0.5% DivorcedWomen who did not give birth in the past 12 months Now married:
12.4% (29)Unmarried:
87.6% (205)
Marital status - White alone, not Hispanic / Latino population 15 years and over
Males 32.8% Never married56.4% Now married0.4% Separated1.5% Widowed8.9% DivorcedFemales 31.3% Never married47.5% Now married2.5% Separated6.9% Widowed11.7% DivorcedWomen who gave birth in the past 12 months Now married:
92.2% (147)Unmarried:
7.8% (12)
Women who did not give birth in the past 12 months Now married:
38.4% (1,419)Unmarried:
61.6% (2,273)
Marital status - Hispanic or Latino population 15 years and over
Males 36.7% Never married59.3% Now married2.0% Separated0.0% Widowed2.0% DivorcedFemales 43.2% Never married38.0% Now married0.0% Separated0.0% Widowed18.8% DivorcedWomen who gave birth in the past 12 months Now married:
100.0% (29)Unmarried:
0.0% (0)
Women who did not give birth in the past 12 months Now married:
31.5% (144)Unmarried:
68.5% (312)
Ancestries in Sycamore
1,169 17.8% German635 9.6% Irish498 7.6% Yugoslavian488 7.4% American423 6.4% Italian368 5.6% English366 5.6% Polish230 3.5% Norwegian154 2.3% European138 2.1% Swedish84 1.3% French69 1.0% Scottish67 1.0% Ukrainian64 1.0% Scandinavian64 1.0% Scotch-Irish51 0.8% Czechoslovakian43 0.7% Danish43 0.7% Russian39 0.6% Welsh30 0.5% Portuguese26 0.4% Dutch22 0.3% British17 0.3% Belgian15 0.2% Turkish12 0.2% Czech10 0.2% African9 0.1% Greek8 0.1% Armenian8 0.1% Bulgarian8 0.1% Lithuanian6 0.09% Finnish5 0.08% French Canadian5 0.08% Pennsylvania German4 0.06% Northern European
Geographical mobility in Sycamore Same house 1 year ago 13,205 88.2% White (Caucasian)303 40.8% Black or African American318 100.0% Asian244 64.8% Other race1,042 93.9% Two or more races13,132 88.3% White alone, not Hispanic / Latino1,379 80.1% Hispanic or LatinoMoved within same county 1,129 7.5% White / Caucasian403 54.4% Black or African American9 2.4% Other race65 5.9% Two or more races1,114 7.5% White alone, not Hispanic / Latino96 5.6% Hispanic or LatinoMoved within same state 527 3.5% White / Caucasian33 4.4% Black or African American515 3.5% White alone, not Hispanic / Latino9 0.5% Hispanic or LatinoMoved from different state 129 0.9% White / Caucasian5 0.7% Black or African American48 12.8% Other race131 0.9% White alone, not Hispanic / Latino43 2.5% Hispanic or LatinoMoved from abroad 99 26.1% Other race68 4.0% Hispanic or Latino
Children Nativity (place of birth) in Sycamore
Children under 6 years - Living with two parents Both parents native 788 100.0% NativeBoth parents foreign-born 25 74.9% Native8 25.1% Foreign-bornOne native, one foreign-born parent 18 100.0% NativeChildren under 6 years - Living with one parent Native parent 209 100.0% NativeChildren 6 to 17 years - Living with two parents Both parents native 1,386 98.8% Native17 1.2% Foreign-bornBoth parents foreign-born 188 87.5% Native27 12.5% Foreign-bornOne native, one foreign-born parent 174 100.0% NativeChildren 6 to 17 years - Living with one parent Native parent 1,233 99.0% Native13 1.0% Foreign-bornForeign-born parent 14 100.0% Native
Grandparents responsible for own grandchildren in Sycamore
Grandparents (30 to 59 years) White / Caucasian 12 52.6% Responsible for grandchildren11 47.4% Not responsible for grandchildrenAsian 17 100.0% Not responsible for grandchildrenWhite alone, not Hispanic / Latino 13 100.0% Responsible for grandchildrenHispanic or Latino 17 100.0% Not responsible for grandchildrenGrandparents (60 years and over) White / Caucasian 32 24.8% Responsible for grandchildren98 75.2% Not responsible for grandchildrenAsian 12 100.0% Not responsible for grandchildrenWhite alone, not Hispanic / Latino 35 24.0% Responsible for grandchildren111 76.0% Not responsible for grandchildren