Races in Tanaina, Alaska (AK) Detailed Stats
Ancestries, Foreign-born residents, place of birth
Settings
X


Recent posts about races in Tanaina, Alaska on our local forum with over 2,400,000 registered users:
 | Does anyone worry... (158 replies) |
| Earthen homes in AK? (39 replies) |
Latest news about races in Tanaina, AK collected exclusively by city-data.com from local newspapers, TV, and radio stations
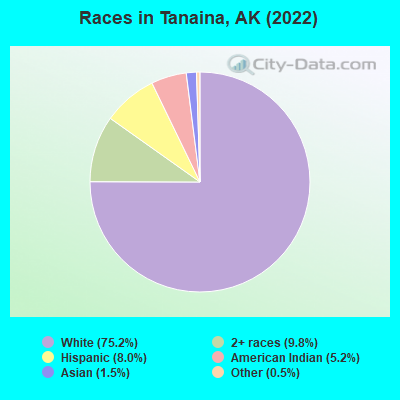
According to 2022 data, the most numerous races in Tanaina, AK are White alone (7,927 residents), American Indian alone (845 residents), and Two or more races (715 residents). 89.3% of Tanaina residents speak English at home. 4.5% of Tanaina, AK residents are foreign-born (2.3% born in Europe, 1.1% born in Asia, 1.0% born in Latin America), which is 55.1% less than the foreign-born rate of 7.0% across the entire state of Alaska.
Race distribution in Tanaina
2000
2022

- 4,30886.3%White alone
- 2234.5%American Indian alone
- 2094.2%Two or more races
- 1723.4%Hispanic
- 300.6%Asian alone
- 270.5%Black alone
- 230.5%Other race alone
- 10.02%Native Hawaiian and Other
Pacific Islander alone

-
- 7,92773.9%White alone
- 9639.0%Hispanic
- 8457.9%American Indian alone
- 7156.7%Two or more races
- 850.8%Asian alone
- 380.4%Black alone
2000
2022
-
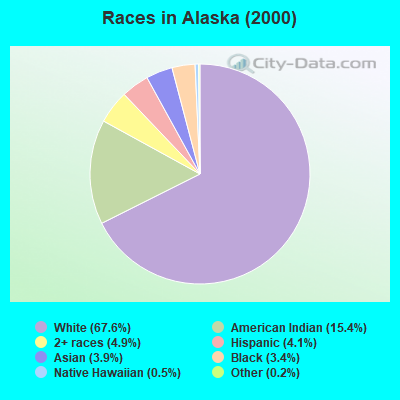
- 423,78867.6%White alone
- 96,50515.4%American Indian alone
- 30,4544.9%Two or more races
- 25,8524.1%Hispanic
- 24,7413.9%Asian alone
- 21,0733.4%Black alone
- 3,1810.5%Native Hawaiian and Other
Pacific Islander alone - 1,3380.2%Other race alone
-
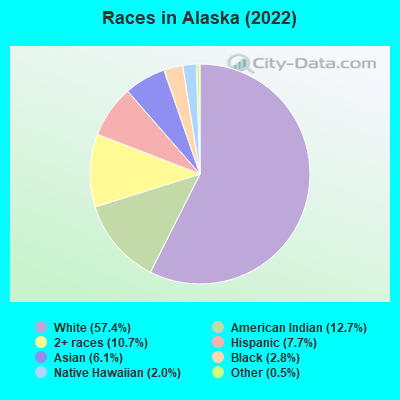
- 421,10457.4%White alone
- 93,29412.7%American Indian alone
- 78,55210.7%Two or more races
- 56,4917.7%Hispanic
- 44,9056.1%Asian alone
- 20,6642.8%Black alone
- 14,5392.0%Native Hawaiian and Other
Pacific Islander alone - 4,0340.5%Other race alone
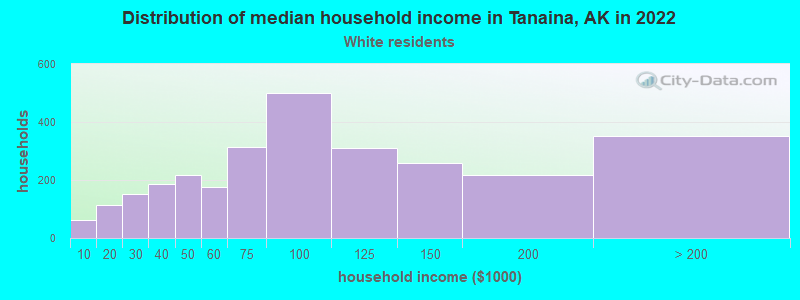
Income and house value in Tanaina
- Median household income in 2022
- $89,515White non-Hispanic householders
- $150,548Black householders
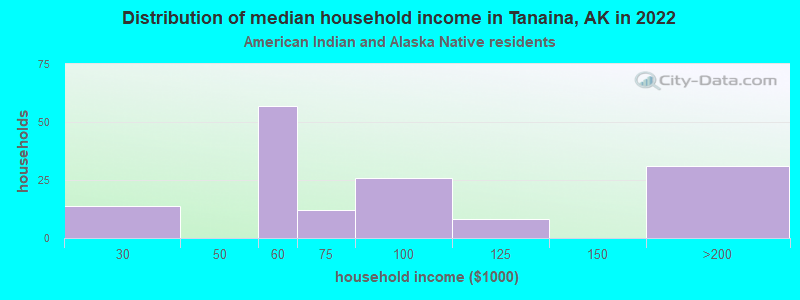
- $96,827American Indian and Alaska Native householders
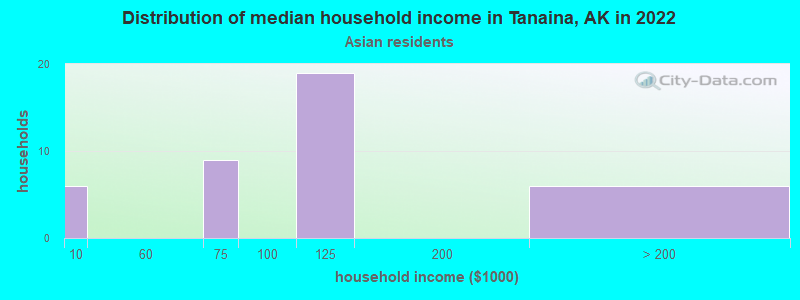
- $66,255Asian householders
- $41,474Some other race householders
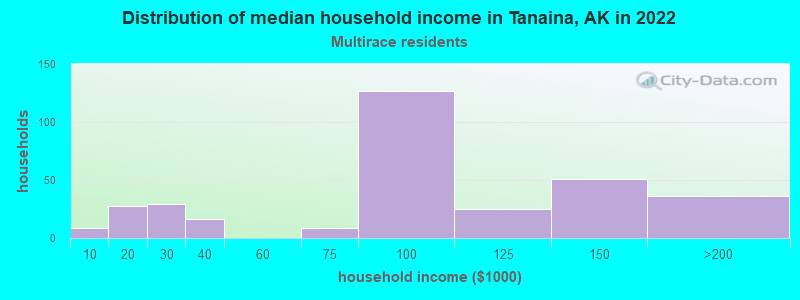
- $81,395Two or more races householders
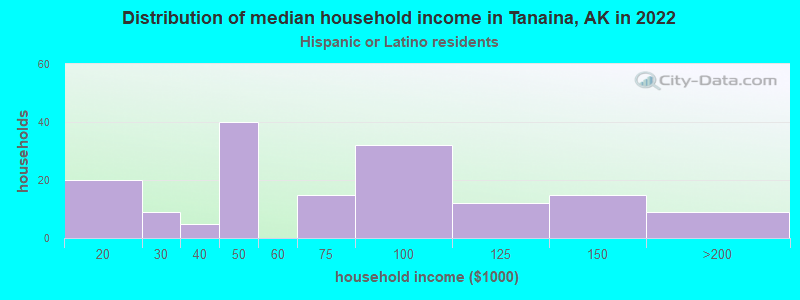
- $65,149Hispanic or Latino race householders
- Median 2022 house value
- $309,437White Non-Hispanic householders
- $337,145Black or African American householders
- $275,846American Indian or Alaska Native householders
- $290,067Two or more races householders
- $110,338Hispanic or Latino householders
Household income for White non-Hispanic householders
Household income for Black householders

Household income for American Indian and Alaska Native householders
Household income for Asian householders
Household income for Some other race householders

Household income for Two or more races householders
Household income for Hispanic or Latino race householders
Median age by race in Tanaina
- 33.1Median age for White residents
- 33.0Males
- 34.1Females
- 73.5Median age for Black or African American residents
- 22.4Median age for American Indian / Alaska Native residents
- 17.3Males
- 24.5Females
- 29.8Median age for Asian residents
- 27.2Median age for Native Hawaiian / Pacific Islander residents
- 48.8Median age for Other race residents
- 39.6Males
- 52.0Females
- 26.0Median age for Two or more races residents
- 29.9Males
- 22.7Females
- 33.8Median age for White alone residents
- 32.9Males
- 36.1Females
- 24.4Median age for Hispanic or Latino residents
- 18.0Males
- 24.3Females
Owner/renter occupied households by race in Tanaina
- House owners and renters - White residents
- 2,10880.6%Owner occupied
- 50819.4%Renter occupied
- House owners and renters - Black or African American residents
- 2383.4%Owner occupied
- 516.6%Renter occupied
- House owners and renters - American Indian / Alaska Native residents
- 8671.3%Owner occupied
- 3528.7%Renter occupied
- House owners and renters - Asian residents
- 3983.8%Owner occupied
- 816.2%Renter occupied
- House owners and renters - Other race residents
- 1581.6%Owner occupied
- 318.4%Renter occupied
- House owners and renters - Two or more races residents
- 15573.6%Owner occupied
- 5626.4%Renter occupied
- House owners and renters - White alone residents
- 1,99880.7%Owner occupied
- 47619.3%Renter occupied
- House owners and renters - Hispanic or Latino residents
- 15383.1%Owner occupied
- 3116.9%Renter occupied
Language usage in Tanaina
- English speakers - Total
- 89.3% of residents of Tanaina speak English at home.
- 2.9% of residents speak Spanish at home
- 27096.8%Speak English very well
- 93.2%Speak English less than very well
- 8.1% of residents speak other language at home
- 65384.8%Speak English very well
- 11715.2%Speak English less than very well
- English speakers - Born in the United States
- 91.4% of residents of Tanaina speak English at home.
- 2.6% of residents speak Spanish at home
- 11792.9%Speak English very well
- 97.1%Speak English less than very well
- 5.3% of residents speak other language at home
- 24996.1%Speak English very well
- 103.9%Speak English less than very well
- English speakers - Native, born elsewhere
- 97.2% of residents of Tanaina speak English at home.
- English speakers - Foreign-born
- 19.9% of residents of Tanaina speak English at home.
- 23.3% of residents speak Spanish at home
- 109100.0%Speak English very well
- 57.0% of residents speak other language at home
- 16260.9%Speak English very well
- 10439.1%Speak English less than very well
White (Caucasian) - Speak only English
| Native: | 92.7% (6,940) |
| Foreign-born: | 17.2% (59) |
White (Caucasian) - Speak another language
| Native: | 6.3% (471) |
| Foreign-born: | 75.4% (256) |
Asian - Speak only English
| Native: | 100.0% (4) |
| Foreign-born: | 43.5% (28) |
Other race - Speak only English
| Native: | 100.0% (40) |
| Foreign-born: | 91.4% (22) |
Other race - Speak another language
| Native: | 10.3% (4) |
| Foreign-born: | 38.4% (9) |
White alone - Speak only English
| Native: | 93.6% (6,615) |
| Foreign-born: | 20.2% (68) |
White alone - Speak another language
| Native: | 5.4% (380) |
| Foreign-born: | 73.8% (249) |
Hispanic or Latino - Speak only English
| Native: | 76.6% (532) |
| Foreign-born: | 10.8% (11) |
Hispanic or Latino - Speak another language
| Native: | 21.6% (150) |
| Foreign-born: | 88.7% (94) |
Foreign-born residents in Tanaina
484 residents are foreign born (2.3% Europe, 1.1% Asia, 1.0% Latin America).
| This city: | 4.5% |
| Alaska: | 100.0% |


Marital status for residents in Tanaina
Marital status - White (Caucasian) population 15 years and over
- Males
- 34.1%Never married
- 54.4%Now married
- 0.8%Separated
- 1.9%Widowed
- 8.9%Divorced
- Females
- 30.3%Never married
- 58.2%Now married
- 0.3%Separated
- 2.6%Widowed
- 8.6%Divorced
Women who gave birth in the past 12 months
| Now married: | 76.7% (86) |
| Unmarried: | 23.3% (26) |
Women who did not give birth in the past 12 months
| Now married: | 54.7% (940) |
| Unmarried: | 45.3% (779) |
Marital status - Black or African American population 15 years and over
- Males
- 0.0%Never married
- 100.0%Now married
- 0.0%Separated
- 0.0%Widowed
- 0.0%Divorced
- Females
- 0.0%Never married
- 28.6%Now married
- 0.0%Separated
- 0.0%Widowed
- 71.4%Divorced
Marital status - American Indian / Alaska Native population 15 years and over
- Males
- 63.2%Never married
- 26.1%Now married
- 0.0%Separated
- 2.6%Widowed
- 8.1%Divorced
- Females
- 44.3%Never married
- 36.5%Now married
- 7.8%Separated
- 3.1%Widowed
- 8.2%Divorced
Women who gave birth in the past 12 months
| Now married: | 0.0% (0) |
| Unmarried: | 100.0% (18) |
Women who did not give birth in the past 12 months
| Now married: | 38.7% (59) |
| Unmarried: | 61.3% (94) |
Marital status - Asian population 15 years and over
- Males
- 0.0%Never married
- 0.0%Now married
- 100.0%Separated
- 0.0%Widowed
- 0.0%Divorced
- Females
- 36.4%Never married
- 48.5%Now married
- 0.0%Separated
- 0.0%Widowed
- 15.2%Divorced
Women who did not give birth in the past 12 months
| Now married: | 34.6% (15) |
| Unmarried: | 65.4% (29) |
Marital status - Other race population 15 years and over
- Males
- 33.3%Never married
- 66.7%Now married
- 0.0%Separated
- 0.0%Widowed
- 0.0%Divorced
- Females
- 15.4%Never married
- 84.6%Now married
- 0.0%Separated
- 0.0%Widowed
- 0.0%Divorced
Women who did not give birth in the past 12 months
| Now married: | 84.6% (31) |
| Unmarried: | 15.4% (6) |
Marital status - Two or more races population 15 years and over
- Males
- 50.5%Never married
- 24.1%Now married
- 2.5%Separated
- 0.0%Widowed
- 22.9%Divorced
- Females
- 58.6%Never married
- 38.2%Now married
- 0.0%Separated
- 3.2%Widowed
- 0.0%Divorced
Women who gave birth in the past 12 months
| Now married: | 0.0% (0) |
| Unmarried: | 100.0% (28) |
Women who did not give birth in the past 12 months
| Now married: | 31.2% (70) |
| Unmarried: | 68.8% (155) |
Marital status - White alone, not Hispanic / Latino population 15 years and over
- Males
- 34.1%Never married
- 53.9%Now married
- 0.8%Separated
- 1.9%Widowed
- 9.2%Divorced
- Females
- 29.9%Never married
- 58.3%Now married
- 0.3%Separated
- 2.6%Widowed
- 8.9%Divorced
Women who gave birth in the past 12 months
| Now married: | 76.7% (88) |
| Unmarried: | 23.3% (27) |
Women who did not give birth in the past 12 months
| Now married: | 53.7% (841) |
| Unmarried: | 46.3% (726) |
Marital status - Hispanic or Latino population 15 years and over
- Males
- 41.7%Never married
- 58.3%Now married
- 0.0%Separated
- 0.0%Widowed
- 0.0%Divorced
- Females
- 32.1%Never married
- 56.3%Now married
- 4.9%Separated
- 2.2%Widowed
- 4.5%Divorced
Women who did not give birth in the past 12 months
| Now married: | 67.7% (155) |
| Unmarried: | 32.3% (74) |
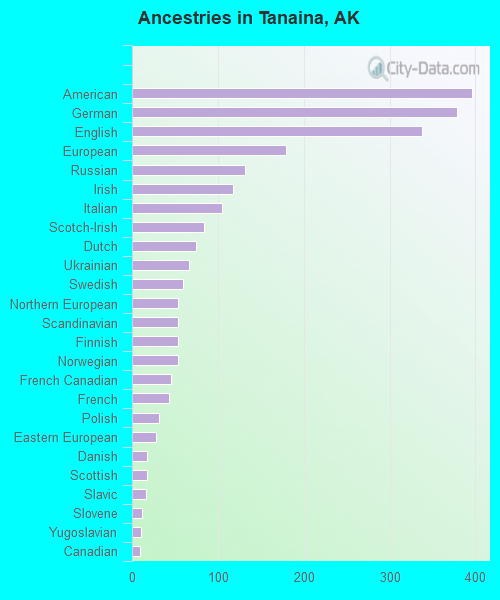
Ancestries in Tanaina

- 55415.9%American
- 2386.8%German
- 1805.2%English
- 1353.9%Ukrainian
- 1253.6%European
- 1223.5%French Canadian
- 1012.9%Russian
- 892.6%Italian
- 872.5%Irish
- 762.2%British
- 722.1%Norwegian
- 481.4%Scandinavian
- 421.2%Polish
- 391.1%Finnish
- 361.0%Dutch
- 270.8%French
- 250.7%Scotch-Irish
- 200.6%Scottish
- 180.5%Eastern European
- 120.3%Yugoslavian
- 110.3%Czechoslovakian
- 100.3%Welsh
- 80.2%Portuguese
- 60.2%Romanian
- 50.1%Danish
- 30.09%Greek
- 10.03%Canadian
Geographical mobility in Tanaina

- Same house 1 year ago
- 7,29387.0%White (Caucasian)
- 30100.0%Black or African American
- 58077.2%American Indian / Alaska Native
- 76100.0%Asian
- 10100.0%Native Hawaiian / Pacific Islander
- 71100.0%Other race
- 76673.4%Two or more races
- 6,67686.6%White alone, not Hispanic / Latino
- 76787.6%Hispanic or Latino

-
- Moved within same county
- 6828.1%White / Caucasian
- 8110.8%American Indian / Alaska Native
- 15514.8%Two or more races
- 6188.0%White alone, not Hispanic / Latino
- 758.5%Hispanic or Latino

-
- Moved within same state
- 2653.2%White / Caucasian
- 658.7%American Indian / Alaska Native
- 33.8%Asian
- 3033.9%White alone, not Hispanic / Latino
- 222.5%Hispanic or Latino

-
- Moved from different state
- 1601.9%White / Caucasian
- 11611.1%Two or more races
- 1231.6%White alone, not Hispanic / Latino
- 252.9%Hispanic or Latino

-
- Moved from abroad
- 50.1%White
- 110.1%White alone, not Hispanic / Latino

Children Nativity (place of birth) in Tanaina
Place of birth for residents in Tanaina
![Place of birth for the foreign-born population - Regions]()
- 243Europe
- 193Eastern Europe
- 125Americas
- 114Asia
- 106Latin America
- 59Central America
- 46South America
- 44South Eastern Asia
- 43Eastern Asia
- 26Northern Europe
- 26South Central Asia
- 19Northern America
- 15Western Europe
- 15China
- 8Southern Europe

![Place of birth for the foreign-born population - Countries]()
- 119Ukraine
- 51Russia
- 49Mexico
- 44Philippines
- 28Korea
- 26Kazakhstan
- 22Colombia
- 20England
- 19Canada
- 15Latvia
- 15China
- 13Bolivia
- 11Uruguay
- 10Honduras
- 8Germany
- 8Portugal
- 7France
- 7Moldova
- 6Norway

Grandparents responsible for own grandchildren in Tanaina
Zip codes: 99654.