Races in Taylors, South Carolina (SC) Detailed Stats
Data:
Races - White alone (%)
Races - White alone (% change since 2000)
Races - Black alone (%)
Races - Black alone (% change since 2000)
Races - American Indian alone (%)
Races - American Indian alone (% change since 2000)
Races - Asian alone (%)
Races - Asian alone (% change since 2000)
Races - Hispanic (%)
Races - Hispanic (% change since 2000)
Races - Native Hawaiian and Other Pacific Islander alone (%)
Races - Native Hawaiian and Other Pacific Islander alone (% change since 2000)
Races - Two or more races(%)
Races - Two or more races(% change since 2000)
Races - Other race alone (%)
Races - Other race alone (% change since 2000)
Racial diversity
Place of birth - Born in state of residence (%)
Place of birth - Born in state of residence (%) - White
Place of birth - Born in state of residence (%) - Black or African American
Place of birth - Born in state of residence (%) - Asian
Place of birth - Born in state of residence (%) - Hispanic or Latino
Place of birth - Born in state of residence (%) - American Indian and Alaska Native
Place of birth - Born in state of residence (%) - Multirace
Place of birth - Born in state of residence (%) - Other Race
Place of birth - Born in other state (%)
Place of birth - Born in other state (%) - White
Place of birth - Born in other state (%) - Black or African American
Place of birth - Born in other state (%) - Asian
Place of birth - Born in other state (%) - Hispanic or Latino
Place of birth - Born in other state (%) - American Indian and Alaska Native
Place of birth - Born in other state (%) - Multirace
Place of birth - Born in other state (%) - Other Race
Place of birth - Native, outside of US (%)
Place of birth - Native, outside of US (%) - White
Place of birth - Native, outside of US (%) - Black or African American
Place of birth - Native, outside of US (%) - Asian
Place of birth - Native, outside of US (%) - Hispanic or Latino
Place of birth - Native, outside of US (%) - American Indian and Alaska Native
Place of birth - Native, outside of US (%) - Multirace
Place of birth - Native, outside of US (%) - Other Race
Place of birth - Foreign born (%)
Place of birth - Foreign born (%) - White
Place of birth - Foreign born (%) - Black or African American
Place of birth - Foreign born (%) - Asian
Place of birth - Foreign born (%) - Hispanic or Latino
Place of birth - Foreign born (%) - American Indian and Alaska Native
Place of birth - Foreign born (%) - Multirace
Place of birth - Foreign born (%) - Other Race
Residents speaking English at home (%)
Residents speaking English at home - Born in the United States (%)
Residents speaking English at home - Native, born elsewhere (%)
Residents speaking English at home - Foreign born (%)
Residents speaking Spanish at home (%)
Residents speaking Spanish at home - Born in the United States (%)
Residents speaking Spanish at home - Native, born elsewhere (%)
Residents speaking Spanish at home - Foreign born (%)
Residents speaking other language at home (%)
Residents speaking other language at home - Born in the United States (%)
Residents speaking other language at home - Native, born elsewhere (%)
Residents speaking other language at home - Foreign born (%)
Marital status - Never married (%)
Marital status - Now married (%)
Marital status - Separated (%)
Marital status - Widowed (%)
Marital status - Divorced (%)
Ancestries Reported - Arab (%)
Ancestries Reported - Czech (%)
Ancestries Reported - Danish (%)
Ancestries Reported - Dutch (%)
Ancestries Reported - English (%)
Ancestries Reported - French (%)
Ancestries Reported - French Canadian (%)
Ancestries Reported - German (%)
Ancestries Reported - Greek (%)
Ancestries Reported - Hungarian (%)
Ancestries Reported - Irish (%)
Ancestries Reported - Italian (%)
Ancestries Reported - Lithuanian (%)
Ancestries Reported - Norwegian (%)
Ancestries Reported - Polish (%)
Ancestries Reported - Portuguese (%)
Ancestries Reported - Russian (%)
Ancestries Reported - Scotch-Irish (%)
Ancestries Reported - Scottish (%)
Ancestries Reported - Slovak (%)
Ancestries Reported - Subsaharan African (%)
Ancestries Reported - Swedish (%)
Ancestries Reported - Swiss (%)
Ancestries Reported - Ukrainian (%)
Ancestries Reported - United States (%)
Ancestries Reported - Welsh (%)
Ancestries Reported - West Indian (%)
Ancestries Reported - Other (%)
Geographical mobility - Same house 1 year ago (%)
Geographical mobility - Same house 1 year ago (%) - White
Geographical mobility - Same house 1 year ago (%) - Black or African American
Geographical mobility - Same house 1 year ago (%) - Asian
Geographical mobility - Same house 1 year ago (%) - Hispanic or Latino
Geographical mobility - Same house 1 year ago (%) - American Indian and Alaska Native
Geographical mobility - Same house 1 year ago (%) - Multirace
Geographical mobility - Same house 1 year ago (%) - Other Race
Geographical mobility - Moved within same county (%)
Geographical mobility - Moved within same county (%) - White
Geographical mobility - Moved within same county (%) - Black or African American
Geographical mobility - Moved within same county (%) - Asian
Geographical mobility - Moved within same county (%) - Hispanic or Latino
Geographical mobility - Moved within same county (%) - American Indian and Alaska Native
Geographical mobility - Moved within same county (%) - Multirace
Geographical mobility - Moved within same county (%) - Other Race
Geographical mobility - Moved from different county within same state (%)
Geographical mobility - Moved from different county within same state (%) - White
Geographical mobility - Moved from different county within same state (%) - Black or African American
Geographical mobility - Moved from different county within same state (%) - Asian
Geographical mobility - Moved from different county within same state (%) - Hispanic or Latino
Geographical mobility - Moved from different county within same state (%) - American Indian and Alaska Native
Geographical mobility - Moved from different county within same state (%) - Multirace
Geographical mobility - Moved from different county within same state (%) - Other Race
Geographical mobility - Moved from different state (%)
Geographical mobility - Moved from different state (%) - White
Geographical mobility - Moved from different state (%) - Black or African American
Geographical mobility - Moved from different state (%) - Asian
Geographical mobility - Moved from different state (%) - Hispanic or Latino
Geographical mobility - Moved from different state (%) - American Indian and Alaska Native
Geographical mobility - Moved from different state (%) - Multirace
Geographical mobility - Moved from different state (%) - Other Race
Geographical mobility - Moved from abroad (%)
Geographical mobility - Moved from abroad (%) - White
Geographical mobility - Moved from abroad (%) - Black or African American
Geographical mobility - Moved from abroad (%) - Asian
Geographical mobility - Moved from abroad (%) - Hispanic or Latino
Geographical mobility - Moved from abroad (%) - American Indian and Alaska Native
Geographical mobility - Moved from abroad (%) - Multirace
Geographical mobility - Moved from abroad (%) - Other Race
Place of birth for the foreign-born population - Ireland (%)
Place of birth for the foreign-born population - Denmark (%)
Place of birth for the foreign-born population - Norway (%)
Place of birth for the foreign-born population - Sweden (%)
Place of birth for the foreign-born population - United Kingdom (%)
Place of birth for the foreign-born population - England (%)
Place of birth for the foreign-born population - Scotland (%)
Place of birth for the foreign-born population - Other Northern Europe (%)
Place of birth for the foreign-born population - Austria (%)
Place of birth for the foreign-born population - Belgium (%)
Place of birth for the foreign-born population - France (%)
Place of birth for the foreign-born population - Germany (%)
Place of birth for the foreign-born population - Netherlands (%)
Place of birth for the foreign-born population - Switzerland (%)
Place of birth for the foreign-born population - Other Western Europe (%)
Place of birth for the foreign-born population - Greece (%)
Place of birth for the foreign-born population - Italy (%)
Place of birth for the foreign-born population - Portugal (%)
Place of birth for the foreign-born population - Spain (%)
Place of birth for the foreign-born population - Other Southern Europe (%)
Place of birth for the foreign-born population - Albania (%)
Place of birth for the foreign-born population - Belarus (%)
Place of birth for the foreign-born population - Bosnia and Herzegovina (%)
Place of birth for the foreign-born population - Bulgaria (%)
Place of birth for the foreign-born population - Croatia (%)
Place of birth for the foreign-born population - Czechoslovakia (%)
Place of birth for the foreign-born population - Hungary (%)
Place of birth for the foreign-born population - Latvia (%)
Place of birth for the foreign-born population - Lithuania (%)
Place of birth for the foreign-born population - North Macedonia (Macedonia) (%)
Place of birth for the foreign-born population - Moldova (%)
Place of birth for the foreign-born population - Poland (%)
Place of birth for the foreign-born population - Romania (%)
Place of birth for the foreign-born population - Russia (%)
Place of birth for the foreign-born population - Serbia (%)
Place of birth for the foreign-born population - Ukraine (%)
Place of birth for the foreign-born population - Other Eastern Europe (%)
Place of birth for the foreign-born population - China (%)
Place of birth for the foreign-born population - Hong Kong (%)
Place of birth for the foreign-born population - Taiwan (%)
Place of birth for the foreign-born population - Japan (%)
Place of birth for the foreign-born population - Korea (%)
Place of birth for the foreign-born population - Other Eastern Asia (%)
Place of birth for the foreign-born population - Afghanistan (%)
Place of birth for the foreign-born population - Bangladesh (%)
Place of birth for the foreign-born population - India (%)
Place of birth for the foreign-born population - Iran (%)
Place of birth for the foreign-born population - Kazakhstan (%)
Place of birth for the foreign-born population - Nepal (%)
Place of birth for the foreign-born population - Pakistan (%)
Place of birth for the foreign-born population - Sri Lanka (%)
Place of birth for the foreign-born population - Uzbekistan (%)
Place of birth for the foreign-born population - Other South Central Asia (%)
Place of birth for the foreign-born population - Burma (%)
Place of birth for the foreign-born population - Cambodia (%)
Place of birth for the foreign-born population - Indonesia (%)
Place of birth for the foreign-born population - Laos (%)
Place of birth for the foreign-born population - Malaysia (%)
Place of birth for the foreign-born population - Philippines (%)
Place of birth for the foreign-born population - Singapore (%)
Place of birth for the foreign-born population - Thailand (%)
Place of birth for the foreign-born population - Vietnam (%)
Place of birth for the foreign-born population - Other South Eastern Asia (%)
Place of birth for the foreign-born population - Armenia (%)
Place of birth for the foreign-born population - Iraq (%)
Place of birth for the foreign-born population - Israel (%)
Place of birth for the foreign-born population - Jordan (%)
Place of birth for the foreign-born population - Kuwait (%)
Place of birth for the foreign-born population - Lebanon (%)
Place of birth for the foreign-born population - Saudi Arabia (%)
Place of birth for the foreign-born population - Syria (%)
Place of birth for the foreign-born population - Turkey (%)
Place of birth for the foreign-born population - Yemen (%)
Place of birth for the foreign-born population - Other Western Asia (%)
Place of birth for the foreign-born population - Eritrea (%)
Place of birth for the foreign-born population - Ethiopia (%)
Place of birth for the foreign-born population - Kenya (%)
Place of birth for the foreign-born population - Somalia (%)
Place of birth for the foreign-born population - Uganda (%)
Place of birth for the foreign-born population - Zimbabwe (%)
Place of birth for the foreign-born population - Other Eastern Africa (%)
Place of birth for the foreign-born population - Cameroon (%)
Place of birth for the foreign-born population - Congo (%)
Place of birth for the foreign-born population - Democratic Republic of Congo (Zaire) (%)
Place of birth for the foreign-born population - Other Middle Africa (%)
Place of birth for the foreign-born population - Egypt (%)
Place of birth for the foreign-born population - Morocco (%)
Place of birth for the foreign-born population - Sudan (%)
Place of birth for the foreign-born population - Other Northern Africa (%)
Place of birth for the foreign-born population - South Africa (%)
Place of birth for the foreign-born population - Other Southern Africa (%)
Place of birth for the foreign-born population - Cabo Verde (%)
Place of birth for the foreign-born population - Ghana (%)
Place of birth for the foreign-born population - Liberia (%)
Place of birth for the foreign-born population - Nigeria (%)
Place of birth for the foreign-born population - Senegal (%)
Place of birth for the foreign-born population - Sierra Leone (%)
Place of birth for the foreign-born population - Other Western Africa (%)
Place of birth for the foreign-born population - Australia (%)
Place of birth for the foreign-born population - New Zealand (%)
Place of birth for the foreign-born population - Fiji (%)
Place of birth for the foreign-born population - Micronesia (%)
Place of birth for the foreign-born population - Bahamas (%)
Place of birth for the foreign-born population - Barbados (%)
Place of birth for the foreign-born population - Cuba (%)
Place of birth for the foreign-born population - Dominica (%)
Place of birth for the foreign-born population - Dominican Republic (%)
Place of birth for the foreign-born population - Grenada (%)
Place of birth for the foreign-born population - Haiti (%)
Place of birth for the foreign-born population - Jamaica (%)
Place of birth for the foreign-born population - St. Vincent and the Grenadines (%)
Place of birth for the foreign-born population - Trinidad and Tobago (%)
Place of birth for the foreign-born population - West Indies (%)
Place of birth for the foreign-born population - Other Caribbean (%)
Place of birth for the foreign-born population - Belize (%)
Place of birth for the foreign-born population - Costa Rica (%)
Place of birth for the foreign-born population - El Salvador (%)
Place of birth for the foreign-born population - Guatemala (%)
Place of birth for the foreign-born population - Honduras (%)
Place of birth for the foreign-born population - Mexico (%)
Place of birth for the foreign-born population - Nicaragua (%)
Place of birth for the foreign-born population - Panama (%)
Place of birth for the foreign-born population - Other Central America (%)
Place of birth for the foreign-born population - Argentina (%)
Place of birth for the foreign-born population - Bolivia (%)
Place of birth for the foreign-born population - Brazil (%)
Place of birth for the foreign-born population - Chile (%)
Place of birth for the foreign-born population - Colombia (%)
Place of birth for the foreign-born population - Ecuador (%)
Place of birth for the foreign-born population - Guyana (%)
Place of birth for the foreign-born population - Peru (%)
Place of birth for the foreign-born population - Uruguay (%)
Place of birth for the foreign-born population - Venezuela (%)
Place of birth for the foreign-born population - Other South America (%)
Place of birth for the foreign-born population - Canada (%)
Place of birth for the foreign-born population - Other Northern America (%)
Place of birth for the foreign-born population - Other (%)
Latest news about races in Taylors, SC collected exclusively by city-data.com from local newspapers, TV, and radio stations
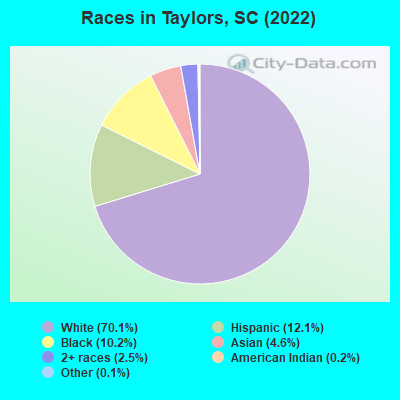
According to 2022 data, the most numerous races in Taylors, SC are White alone (16,727 residents), Black alone (2,440 residents), and Hispanic (2,896 residents). 87.6% of Taylors residents speak English at home. 11.4% of Taylors, SC residents are foreign-born (7.7% born in Latin America, 3.2% born in Asia), which is 56.0% greater than the foreign-born rate of 5.0% across the entire state of South Carolina.
Race distribution in Taylors
2000 2022
2,652,291 66.1% White alone 1,178,486 29.4% Black alone 95,076 2.4% Hispanic 35,568 0.9% Asian alone 33,290 0.8% Two or more races 12,765 0.3% American Indian alone 3,266 0.08% Other race alone 1,270 0.03% Native Hawaiian and Other
3,301,739 62.5% White alone 1,313,290 24.9% Black alone 343,783 6.5% Hispanic 190,508 3.6% Two or more races 89,888 1.7% Asian alone 29,390 0.6% Other race alone 12,112 0.2% American Indian alone 1,924 0.04% Native Hawaiian and Other
Income and house value in Taylors Median household income in 2022 $76,610 White non-Hispanic householders$55,470 Black householders$77,114 Asian householders$103,230 Some other race householders$64,662 Two or more races householders$47,903 Hispanic or Latino race householdersMedian 2022 house value $262,178 White Non-Hispanic householders$186,495 Black or African American householders$383,129 American Indian or Alaska Native householders $210,544 Asian householders$41,260 Native Hawaiian and other Pacific Islander householders$182,723 Some other race householders$332,674 Two or more races householders$311,926 Hispanic or Latino householders
Median age by race in Taylors
41.0 Median age for White residents39.3 43.0 29.1 Median age for Black or African American residents33.1 27.7 14.1 Median age for American Indian / Alaska Native residents89.6 13.8 39.5 Median age for Asian residents27.7 41.5 -698,412,697.7 Median age for Native Hawaiian / Pacific Islander residents-551,574,375.1 -1,016,109,044.8 21.3 Median age for Other race residents22.5 41.0 19.3 Median age for Two or more races residents18.8 18.0 40.8 Median age for White alone residents38.9 43.4 23.0 Median age for Hispanic or Latino residents23.9 22.2
Owner/renter occupied households by race in Taylors
House owners and renters - White residents 6,201 84.1% Owner occupied1,168 15.9% Renter occupiedHouse owners and renters - Black or African American residents 444 42.5% Owner occupied602 57.5% Renter occupiedHouse owners and renters - American Indian / Alaska Native residents 17 51.4% Owner occupied16 48.6% Renter occupiedHouse owners and renters - Asian residents 424 100.0% Owner occupiedHouse owners and renters - Other race residents 80 49.5% Owner occupied81 50.5% Renter occupiedHouse owners and renters - Two or more races residents 474 76.5% Owner occupied145 23.5% Renter occupiedHouse owners and renters - White alone residents 6,041 84.4% Owner occupied1,120 15.6% Renter occupiedHouse owners and renters - Hispanic or Latino residents 624 66.5% Owner occupied314 33.5% Renter occupied
Language usage in Taylors
English speakers - Total 87.6% of residents of Taylors speak English at home.
8.1% of residents speak Spanish at home 856 48.4% Speak English very well914 51.6% Speak English less than very well4.2% of residents speak other language at home 478 52.4% Speak English very well435 47.6% Speak English less than very well
English speakers - Born in the United States 97.7% of residents of Taylors speak English at home.
1.6% of residents speak Spanish at home 81 52.6% Speak English very well73 47.4% Speak English less than very well0.5% of residents speak other language at home 40 85.1% Speak English very well7 14.9% Speak English less than very well
English speakers - Native, born elsewhere 56.6% of residents of Taylors speak English at home.
26.7% of residents speak Spanish at home 59 100.0% Speak English very well15.4% of residents speak other language at home 27 79.4% Speak English very well7 20.6% Speak English less than very well
English speakers - Foreign-born 23.9% of residents of Taylors speak English at home.
44.6% of residents speak Spanish at home 445 39.9% Speak English very well669 60.1% Speak English less than very well30.7% of residents speak other language at home 363 47.3% Speak English very well405 52.7% Speak English less than very well
White (Caucasian) - Speak only English Native:
99.2% (15,184)Foreign-born:
71.2% (513)
White (Caucasian) - Speak another language Native:
1.1% (170)Foreign-born:
40.7% (293)
Asian - Speak only English Native:
37.6% (85)Foreign-born:
6.4% (47)
Asian - Speak another language Native:
43.6% (99)Foreign-born:
93.4% (696)
Other race - Speak only English Native:
18.6% (62)Foreign-born:
16.0% (50)
Other race - Speak another language Native:
76.5% (253)Foreign-born:
85.4% (265)
Two or more races - Speak another language Native:
16.4% (196)Foreign-born:
100.0% (687)
White alone - Speak only English Native:
99.3% (15,029)Foreign-born:
92.5% (538)
White alone - Speak another language Native:
0.7% (111)Foreign-born:
13.2% (77)
Hispanic or Latino - Speak only English Native:
63.5% (751)Foreign-born:
3.2% (39)
Hispanic or Latino - Speak another language Native:
39.7% (470)Foreign-born:
95.3% (1,163)
Foreign-born residents in Taylors 2,709 residents are foreign born (7.7% Latin America , 3.2% Asia ).
This city:
11.4%South Carolina:
5.3%
Marital status for residents in Taylors Marital status - White (Caucasian) population 15 years and over
Males 31.8% Never married56.0% Now married0.8% Separated3.8% Widowed7.5% DivorcedFemales 21.5% Never married50.0% Now married1.3% Separated10.9% Widowed16.3% DivorcedWomen who gave birth in the past 12 months Now married:
86.7% (357)Unmarried:
13.3% (55)
Women who did not give birth in the past 12 months Now married:
45.6% (1,589)Unmarried:
54.4% (1,895)
Marital status - Black or African American population 15 years and over
Males 32.2% Never married44.1% Now married8.0% Separated8.4% Widowed7.3% DivorcedFemales 64.5% Never married23.9% Now married4.1% Separated0.7% Widowed6.8% DivorcedWomen who gave birth in the past 12 months Now married:
100.0% (26)Unmarried:
0.0% (0)
Women who did not give birth in the past 12 months Now married:
13.6% (97)Unmarried:
86.4% (615)
Marital status - American Indian / Alaska Native population 15 years and over
Males 18.8% Never married81.2% Now married0.0% Separated0.0% Widowed0.0% DivorcedFemales 85.7% Never married14.3% Now married0.0% Separated0.0% Widowed0.0% DivorcedWomen who did not give birth in the past 12 months Now married:
10.0% (3)Unmarried:
90.0% (25)
Marital status - Asian population 15 years and over
Males 17.7% Never married75.9% Now married0.0% Separated0.0% Widowed6.4% DivorcedFemales 23.6% Never married62.1% Now married0.0% Separated0.0% Widowed14.3% DivorcedWomen who gave birth in the past 12 months Now married:
47.4% (10)Unmarried:
52.6% (11)
Women who did not give birth in the past 12 months Now married:
51.9% (197)Unmarried:
48.1% (183)
Marital status - Other race population 15 years and over
Males 53.1% Never married36.6% Now married0.0% Separated0.0% Widowed10.3% DivorcedFemales 26.5% Never married41.5% Now married11.0% Separated0.0% Widowed21.0% DivorcedWomen who did not give birth in the past 12 months Now married:
63.9% (135)Unmarried:
36.1% (76)
Marital status - Two or more races population 15 years and over
Males 34.2% Never married43.5% Now married0.0% Separated0.0% Widowed22.3% DivorcedFemales 42.7% Never married43.5% Now married0.0% Separated7.2% Widowed6.6% DivorcedWomen who did not give birth in the past 12 months Now married:
41.9% (185)Unmarried:
58.1% (256)
Marital status - White alone, not Hispanic / Latino population 15 years and over
Males 31.5% Never married55.8% Now married0.8% Separated4.0% Widowed7.7% DivorcedFemales 21.1% Never married50.0% Now married1.4% Separated10.9% Widowed16.7% DivorcedWomen who gave birth in the past 12 months Now married:
86.7% (364)Unmarried:
13.3% (56)
Women who did not give birth in the past 12 months Now married:
45.5% (1,557)Unmarried:
54.5% (1,862)
Marital status - Hispanic or Latino population 15 years and over
Males 36.6% Never married49.3% Now married0.0% Separated0.0% Widowed14.1% DivorcedFemales 38.0% Never married42.0% Now married5.7% Separated3.5% Widowed10.8% DivorcedWomen who gave birth in the past 12 months Now married:
100.0% (27)Unmarried:
0.0% (0)
Women who did not give birth in the past 12 months Now married:
46.0% (321)Unmarried:
54.0% (376)
Ancestries in Taylors
1,866 16.4% English962 8.5% Irish915 8.0% American779 6.8% German406 3.6% Scotch-Irish331 2.9% Italian248 2.2% Scottish238 2.1% Northern European210 1.8% Jamaican129 1.1% French Canadian127 1.1% European97 0.9% Croatian67 0.6% Eastern European66 0.6% Dutch59 0.5% French58 0.5% Polish54 0.5% Russian43 0.4% Swedish40 0.4% Czech38 0.3% Norwegian29 0.3% Welsh25 0.2% Latvian24 0.2% British24 0.2% Ukrainian23 0.2% Austrian16 0.1% Greek16 0.1% Slavic15 0.1% African12 0.1% Hungarian12 0.1% Swiss6 0.05% Lebanese
Geographical mobility in Taylors Same house 1 year ago 15,834 93.8% White (Caucasian)1,960 82.4% Black or African American28 54.2% American Indian / Alaska Native1,250 100.0% Asian581 91.1% Other race1,844 83.1% Two or more races15,294 93.4% White alone, not Hispanic / Latino2,527 89.0% Hispanic or LatinoMoved within same county 596 3.5% White / Caucasian214 9.0% Black or African American35 5.5% Other race322 14.5% Two or more races585 3.6% White alone, not Hispanic / Latino208 7.3% Hispanic or LatinoMoved within same state 79 0.5% White / Caucasian146 6.2% Black or African American20 39.0% American Indian / Alaska Native1 0.2% Other race74 0.5% White alone, not Hispanic / Latino20 0.7% Hispanic or LatinoMoved from different state 497 2.9% White / Caucasian22 1.8% Asian29 4.5% Other race86 3.9% Two or more races530 3.2% White alone, not Hispanic / Latino35 1.2% Hispanic or Latino
Children Nativity (place of birth) in Taylors
Children under 6 years - Living with two parents Both parents native 1,224 100.0% NativeBoth parents foreign-born 329 100.0% NativeOne native, one foreign-born parent 267 100.0% NativeChildren under 6 years - Living with one parent Native parent 301 100.0% NativeForeign-born parent 110 67.6% Native53 32.4% Foreign-bornChildren 6 to 17 years - Living with two parents Both parents native 2,136 100.0% NativeBoth parents foreign-born 256 89.6% Native30 10.4% Foreign-bornOne native, one foreign-born parent 79 78.3% Native22 21.7% Foreign-bornChildren 6 to 17 years - Living with one parent Native parent 488 100.0% NativeForeign-born parent 51 50.6% Native50 49.4% Foreign-born
Grandparents responsible for own grandchildren in Taylors
Grandparents (30 to 59 years) White / Caucasian 74 76.8% Responsible for grandchildren22 23.2% Not responsible for grandchildrenBlack or African American 36 100.0% Not responsible for grandchildrenWhite alone, not Hispanic / Latino 75 74.8% Responsible for grandchildren25 25.2% Not responsible for grandchildrenGrandparents (60 years and over) White / Caucasian 20 53.3% Responsible for grandchildren18 46.7% Not responsible for grandchildrenBlack or African American 12 36.9% Responsible for grandchildren21 63.1% Not responsible for grandchildrenWhite alone, not Hispanic / Latino 21 53.5% Responsible for grandchildren18 46.5% Not responsible for grandchildren