Races in Timberlake, Virginia (VA) Detailed Stats
Ancestries, Foreign-born residents, place of birth
Settings
X


Recent posts about races in Timberlake, Virginia on our local forum with over 2,400,000 registered users:
 | Mapping Virginia Beach... (52 replies) |
| throwback Lynnhaven Mall (55 replies) |
| South Boston, VA vs Roxboro, Nc (20 replies) |
| New restaraunts in Lynchburg (20 replies) |
| Move from Charlottesville to Lynchburg... Questions. (20 replies) |
| Lakeside Area...what do u expect to see come to Lynchburg within the next few years? (6 replies) |
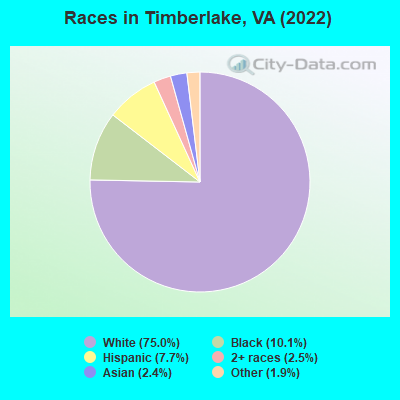
According to 2022 data, the most numerous races in Timberlake, VA are White alone (9,816 residents), Black alone (1,316 residents), and Hispanic (1,013 residents). 89.7% of Timberlake residents speak English at home. 8.4% of Timberlake, VA residents are foreign-born (3.7% born in Latin America, 2.6% born in Africa, 1.5% born in Asia), which is 42.4% less than the foreign-born rate of 12.0% across the entire state of Virginia.
Race distribution in Timberlake
2000
2022

- 9,68790.7%White alone
- 5695.3%Black alone
- 1831.7%Asian alone
- 1081.0%Hispanic
- 1031.0%Two or more races
- 290.3%American Indian alone
- 30.03%Other race alone
- 10.01%Native Hawaiian and Other
Pacific Islander alone

-
- 9,81675.0%White alone
- 1,31610.1%Black alone
- 1,0137.7%Hispanic
- 3272.5%Two or more races
- 3092.4%Asian alone
- 2451.9%Other race alone
- 30.02%American Indian alone
2000
2022
-
- 4,965,63770.2%White alone
- 1,376,37819.4%Black alone
- 329,5404.7%Hispanic
- 259,2773.7%Asian alone
- 114,0221.6%Two or more races
- 18,5960.3%American Indian alone
- 11,6850.2%Other race alone
- 3,3800.05%Native Hawaiian and Other
Pacific Islander alone

-
- 5,095,13058.7%White alone
- 1,594,78518.4%Black alone
- 905,75010.4%Hispanic
- 602,8816.9%Asian alone
- 406,0474.7%Two or more races
- 60,4190.7%Other race alone
- 11,7380.1%American Indian alone
- 6,8690.08%Native Hawaiian and Other
Pacific Islander alone

Income and house value in Timberlake
- Median household income in 2022
- $66,248White non-Hispanic householders
- $74,198Black householders
- $83,899Asian householders
- $49,083Two or more races householders
- $49,570Hispanic or Latino race householders
- Median 2022 house value
- $243,376White Non-Hispanic householders
- $253,076Black or African American householders
- $143,292American Indian or Alaska Native householders
- $243,376Asian householders
- $165,337Some other race householders
- $174,376Hispanic or Latino householders
Household income for White non-Hispanic householders

Household income for Black householders

Household income for Asian householders

Household income for Some other race householders

Household income for Two or more races householders

Household income for Hispanic or Latino race householders

Median age by race in Timberlake
- 42.3Median age for White residents
- 38.4Males
- 44.9Females
- 45.7Median age for Black or African American residents
- 36.4Males
- 53.7Females
- -682,215,742.8Median age for American Indian / Alaska Native residents
- -682,352,940.5Males
- -687,861,271.0Females
- 38.5Median age for Asian residents
- 39.6Males
- 25.2Females
- -611,955,419.9Median age for Native Hawaiian / Pacific Islander residents
- -541,531,822.5Males
- -714,150,046.8Females
- 22.2Median age for Other race residents
- 19.9Males
- 25.2Females
- 20.0Median age for Two or more races residents
- 26.7Males
- 19.7Females
- 43.3Median age for White alone residents
- 39.7Males
- 44.7Females
- 24.6Median age for Hispanic or Latino residents
- 29.0Males
- 24.4Females
Owner/renter occupied households by race in Timberlake
- House owners and renters - White residents
- 2,87468.3%Owner occupied
- 1,33331.7%Renter occupied
- House owners and renters - Black or African American residents
- 28947.8%Owner occupied
- 31552.2%Renter occupied
- House owners and renters - American Indian / Alaska Native residents
- 3100.0%Renter occupied
- House owners and renters - Asian residents
- 64100.0%Owner occupied
- House owners and renters - Other race residents
- 1515.4%Owner occupied
- 8084.6%Renter occupied
- House owners and renters - Two or more races residents
- 15252.0%Owner occupied
- 14048.0%Renter occupied
- House owners and renters - White alone residents
- 2,91068.5%Owner occupied
- 1,33631.5%Renter occupied
- House owners and renters - Hispanic or Latino residents
- 9239.2%Owner occupied
- 14360.8%Renter occupied
Language usage in Timberlake
- English speakers - Total
- 89.7% of residents of Timberlake speak English at home.
- 4.6% of residents speak Spanish at home
- 36563.6%Speak English very well
- 20936.4%Speak English less than very well
- 5.8% of residents speak other language at home
- 13318.2%Speak English very well
- 59681.8%Speak English less than very well
- English speakers - Born in the United States
- 99.0% of residents of Timberlake speak English at home.
- 0.2% of residents speak Spanish at home
- 7100.0%Speak English very well
- 0.3% of residents speak other language at home
- 12100.0%Speak English very well
- English speakers - Native, born elsewhere
- 77.3% of residents of Timberlake speak English at home.
- 8.2% of residents speak Spanish at home
- 8100.0%Speak English very well
- 12.4% of residents speak other language at home
- 12100.0%Speak English very well
- English speakers - Foreign-born
- 8.9% of residents of Timberlake speak English at home.
- 41.5% of residents speak Spanish at home
- 25555.6%Speak English very well
- 20444.4%Speak English less than very well
- 51.4% of residents speak other language at home
- 9015.8%Speak English very well
- 47884.2%Speak English less than very well
White (Caucasian) - Speak only English
| Native: | 100.0% (9,314) |
| Foreign-born: | 40.1% (64) |
White (Caucasian) - Speak another language
| Native: | 0.3% (29) |
| Foreign-born: | 62.5% (99) |
Black or African American - Speak only English
| Native: | 99.8% (919) |
| Foreign-born: | 3.3% (12) |
Asian - Speak another language
| Native: | 100.0% (123) |
| Foreign-born: | 94.1% (180) |
Two or more races - Speak another language
| Native: | 18.2% (143) |
| Foreign-born: | 100.0% (413) |
White alone - Speak only English
| Native: | 99.8% (9,375) |
| Foreign-born: | 79.4% (68) |
White alone - Speak another language
| Native: | 0.3% (27) |
| Foreign-born: | 16.2% (14) |
Hispanic or Latino - Speak another language
| Native: | 24.5% (114) |
| Foreign-born: | 99.6% (455) |
Foreign-born residents in Timberlake
1,103 residents are foreign born (3.7% Latin America, 2.6% Africa, 1.5% Asia).
| This city: | 8.4% |
| Virginia: | 12.6% |


Marital status for residents in Timberlake
Marital status - White (Caucasian) population 15 years and over
- Males
- 28.6%Never married
- 55.3%Now married
- 1.5%Separated
- 4.0%Widowed
- 10.6%Divorced
- Females
- 24.2%Never married
- 51.3%Now married
- 2.6%Separated
- 13.2%Widowed
- 8.7%Divorced
Women who gave birth in the past 12 months
| Now married: | 92.1% (131) |
| Unmarried: | 7.9% (11) |
Women who did not give birth in the past 12 months
| Now married: | 53.3% (1,162) |
| Unmarried: | 46.7% (1,016) |
Marital status - Black or African American population 15 years and over
- Males
- 33.9%Never married
- 62.2%Now married
- 0.0%Separated
- 0.0%Widowed
- 3.9%Divorced
- Females
- 30.1%Never married
- 32.4%Now married
- 0.0%Separated
- 21.2%Widowed
- 16.3%Divorced
Women who did not give birth in the past 12 months
| Now married: | 7.1% (13) |
| Unmarried: | 92.9% (168) |
Marital status - Asian population 15 years and over
- Males
- 15.8%Never married
- 68.4%Now married
- 0.0%Separated
- 15.8%Widowed
- 0.0%Divorced
- Females
- 14.9%Never married
- 58.9%Now married
- 0.0%Separated
- 26.2%Widowed
- 0.0%Divorced
Women who did not give birth in the past 12 months
| Now married: | 72.7% (58) |
| Unmarried: | 27.3% (22) |
Marital status - Other race population 15 years and over
- Males
- 68.2%Never married
- 31.8%Now married
- 0.0%Separated
- 0.0%Widowed
- 0.0%Divorced
- Females
- 83.6%Never married
- 16.4%Now married
- 0.0%Separated
- 0.0%Widowed
- 0.0%Divorced
Women who did not give birth in the past 12 months
| Now married: | 10.9% (20) |
| Unmarried: | 89.1% (161) |
Marital status - Two or more races population 15 years and over
- Males
- 45.6%Never married
- 54.4%Now married
- 0.0%Separated
- 0.0%Widowed
- 0.0%Divorced
- Females
- 66.7%Never married
- 33.3%Now married
- 0.0%Separated
- 0.0%Widowed
- 0.0%Divorced
Women who gave birth in the past 12 months
| Now married: | 100.0% (111) |
| Unmarried: | 0.0% (0) |
Women who did not give birth in the past 12 months
| Now married: | 10.5% (34) |
| Unmarried: | 89.5% (290) |
Marital status - White alone, not Hispanic / Latino population 15 years and over
- Males
- 27.6%Never married
- 56.4%Now married
- 1.5%Separated
- 4.1%Widowed
- 10.5%Divorced
- Females
- 22.3%Never married
- 52.6%Now married
- 2.6%Separated
- 13.5%Widowed
- 8.9%Divorced
Women who gave birth in the past 12 months
| Now married: | 92.1% (137) |
| Unmarried: | 7.9% (12) |
Women who did not give birth in the past 12 months
| Now married: | 56.0% (1,207) |
| Unmarried: | 44.0% (950) |
Marital status - Hispanic or Latino population 15 years and over
- Males
- 36.9%Never married
- 59.4%Now married
- 0.0%Separated
- 0.0%Widowed
- 3.7%Divorced
- Females
- 73.4%Never married
- 26.6%Now married
- 0.0%Separated
- 0.0%Widowed
- 0.0%Divorced
Women who gave birth in the past 12 months
| Now married: | 100.0% (86) |
| Unmarried: | 0.0% (0) |
Women who did not give birth in the past 12 months
| Now married: | 8.7% (31) |
| Unmarried: | 91.3% (322) |
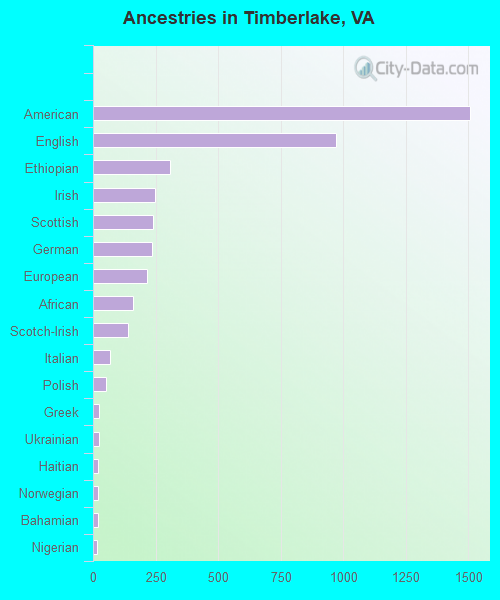
Ancestries in Timberlake

- 1,50727.0%American
- 97117.4%English
- 3095.5%Ethiopian
- 2484.4%Irish
- 2404.3%Scottish
- 2344.2%German
- 2163.9%European
- 1592.8%African
- 1402.5%Scotch-Irish
- 661.2%Italian
- 530.9%Polish
- 250.4%Greek
- 240.4%Ukrainian
- 200.4%Haitian
- 180.3%Norwegian
- 180.3%Bahamian
- 170.3%Nigerian
- 130.2%Palestinian
- 120.2%Danish
- 110.2%Czech
- 110.2%Russian
- 100.2%Belgian
- 100.2%Scandinavian
- 90.2%Finnish
- 80.1%Welsh
- 60.1%Czechoslovakian
- 50.09%Armenian
- 30.05%Austrian
Geographical mobility in Timberlake

- Same house 1 year ago
- 8,48188.3%White (Caucasian)
- 1,05880.5%Black or African American
- 396.1%American Indian / Alaska Native
- 10533.8%Asian
- 310100.0%Other race
- 1,14689.1%Two or more races
- 8,56288.1%White alone, not Hispanic / Latino
- 88689.4%Hispanic or Latino

-
- Moved within same county
- 4724.9%White / Caucasian
- 19161.3%Asian
- 221.7%Two or more races
- 4784.9%White alone, not Hispanic / Latino
- 90.9%Hispanic or Latino

-
- Moved within same state
- 4024.2%White / Caucasian
- 28621.7%Black or African American
- 1229.5%Two or more races
- 4114.2%White alone, not Hispanic / Latino
- 10110.2%Hispanic or Latino

-
- Moved from different state
- 2462.6%White / Caucasian
- 2562.6%White alone, not Hispanic / Latino

-
- Moved from abroad
- 20.0%White
- 134.2%Asian
- 30.0%White alone, not Hispanic / Latino

Children Nativity (place of birth) in Timberlake
Place of birth for residents in Timberlake
![Place of birth for the foreign-born population - Regions]()
- 491Americas
- 491Latin America
- 442Central America
- 345Africa
- 331Eastern Africa
- 196Asia
- 83South Eastern Asia
- 69South Central Asia
- 68Europe
- 36South America
- 35Eastern Asia
- 34Northern Europe
- 23China
- 20Western Europe
- 14Eastern Europe
- 14Western Africa
- 13Caribbean

![Place of birth for the foreign-born population - Countries]()
- 331Ethiopia
- 280Mexico
- 107Guatemala
- 69India
- 58Philippines
- 32Honduras
- 26Scotland
- 24Vietnam
- 23China
- 23Venezuela
- 14Russia
- 14Nigeria
- 14El Salvador
- 13Bahamas
- 13Brazil
- 12Korea
- 10Belgium
- 10Germany
- 7Nicaragua

Grandparents responsible for own grandchildren in Timberlake
Zip codes: 24550.