Races in Trenton, Michigan (MI) Detailed Stats
Ancestries, Foreign-born residents, place of birth
Settings
X


Recent posts about races in Trenton, Michigan on our local forum with over 2,400,000 registered users:
 | Where to live near Troy, Michigan :) (19 replies) |
| Forbes just named GR #1 place to invest in house (50 replies) |
| Mid 40s, no kids, returning to area. (6 replies) |
| The First Thing That Comes To Mind… (4 replies) |
| Renting a house vs. apartment in Downriver area (8 replies) |
| To Michigan from Vermont - advice (28 replies) |
Latest news about races in Trenton, MI collected exclusively by city-data.com from local newspapers, TV, and radio stations
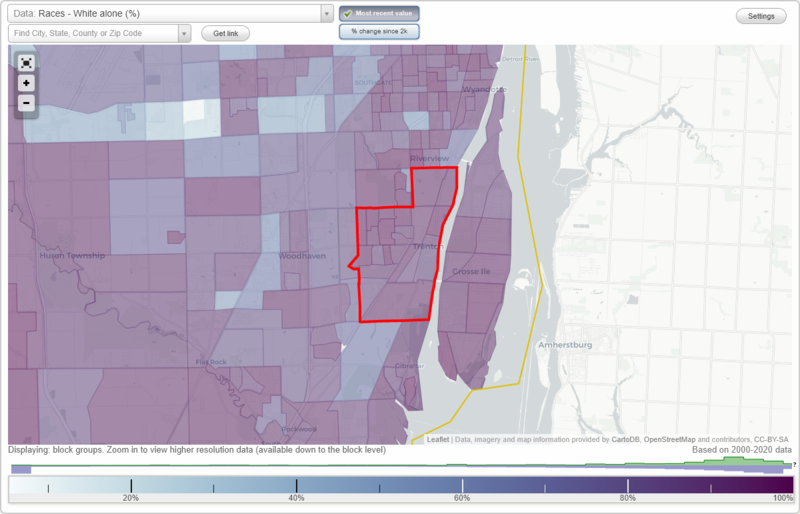
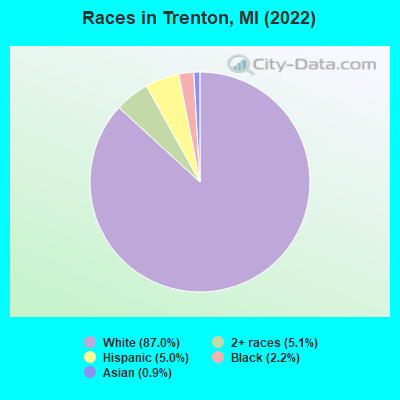
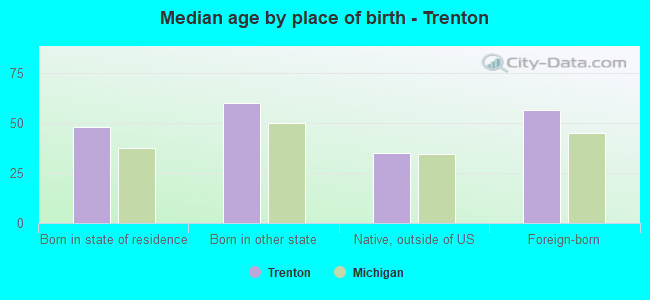
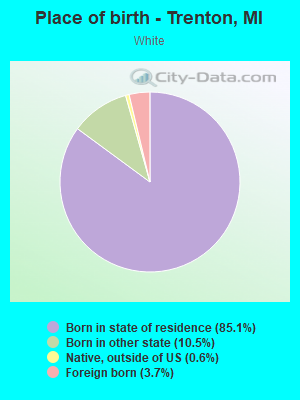
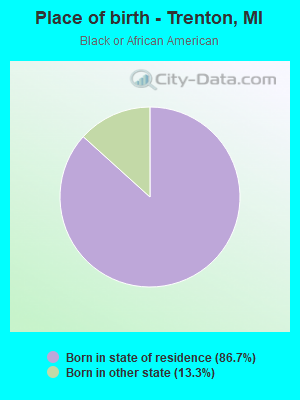
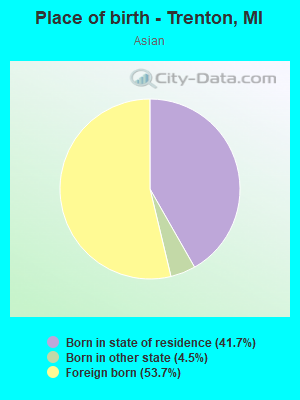
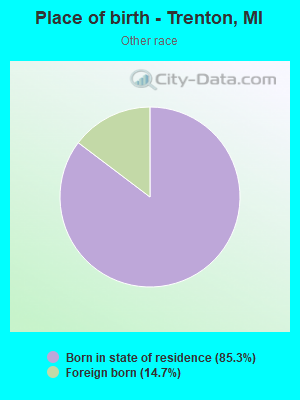
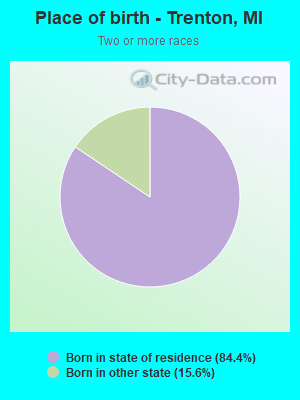
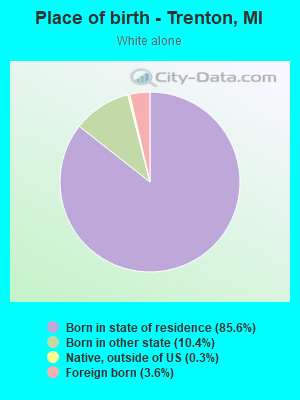
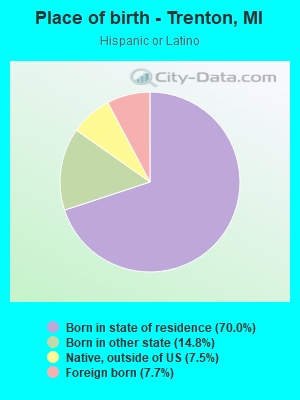
According to 2022 data, the most numerous races in Trenton, MI are White alone (15,799 residents), Black alone (405 residents), and Hispanic (905 residents). 95.5% of Trenton residents speak English at home. 3.8% of Trenton, MI residents are foreign-born (1.7% born in Europe, 1.1% born in Asia, 0.5% born in Latin America, 0.4% born in North America), which is 58.7% less than the foreign-born rate of 6.0% across the entire state of Michigan.
Race distribution in Trenton
2000
2022

- 18,68895.4%White alone
- 3902.0%Hispanic
- 2001.0%Two or more races
- 1500.8%Asian alone
- 730.4%Black alone
- 780.4%American Indian alone
- 40.02%Native Hawaiian and Other
Pacific Islander alone - 10.01%Other race alone

-
- 15,79987.0%White alone
- 9245.1%Two or more races
- 9055.0%Hispanic
- 4052.2%Black alone
- 1590.9%Asian alone
2000
2022
-
- 7,806,69178.6%White alone
- 1,402,04714.1%Black alone
- 323,8773.3%Hispanic
- 175,3111.8%Asian alone
- 163,4871.6%Two or more races
- 53,4210.5%American Indian alone
- 11,4650.1%Other race alone
- 2,1450.02%Native Hawaiian and Other
Pacific Islander alone

-
- 7,289,05172.6%White alone
- 1,310,46413.1%Black alone
- 572,4055.7%Hispanic
- 450,0314.5%Two or more races
- 335,7323.3%Asian alone
- 45,2170.5%Other race alone
- 29,0110.3%American Indian alone
- 2,2070.02%Native Hawaiian and Other
Pacific Islander alone

Income and house value in Trenton
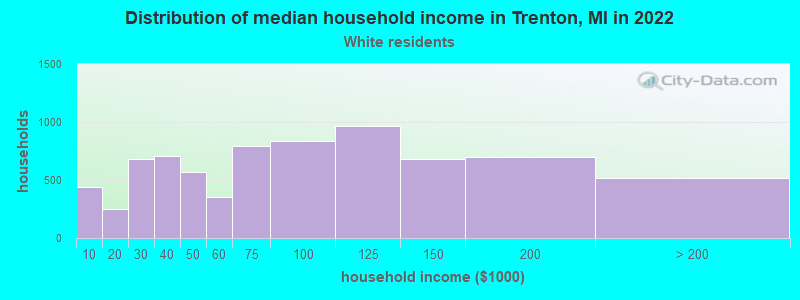
- Median household income in 2022
- $73,585White non-Hispanic householders
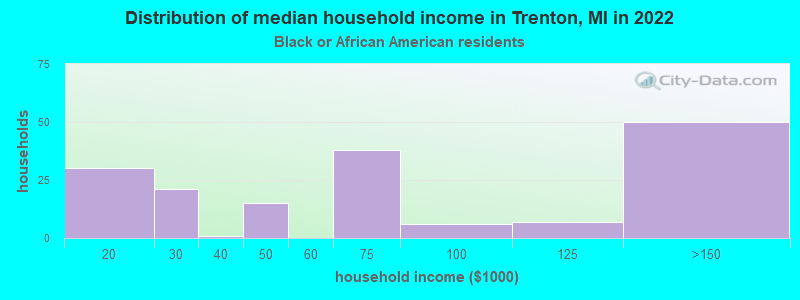
- $72,509Black householders
- $65,906Some other race householders
- $61,154Two or more races householders
- $66,989Hispanic or Latino race householders
- Median 2022 house value
- $212,563White Non-Hispanic householders
- $212,254Black or African American householders
- $177,522American Indian or Alaska Native householders
- $385,917Asian householders
- $347,326Some other race householders
- $138,312Two or more races householders
- $223,832Hispanic or Latino householders
Household income for White non-Hispanic householders
Household income for Black householders
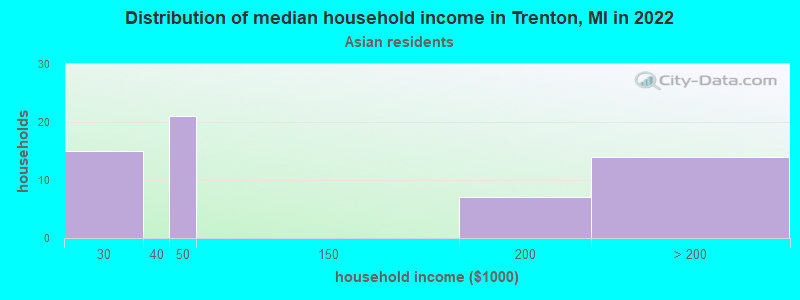
Household income for Asian householders
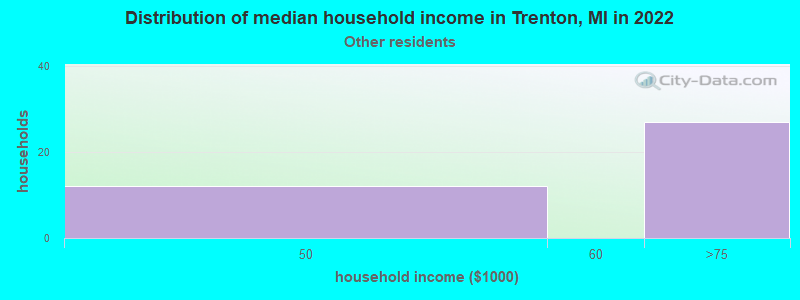
Household income for Some other race householders
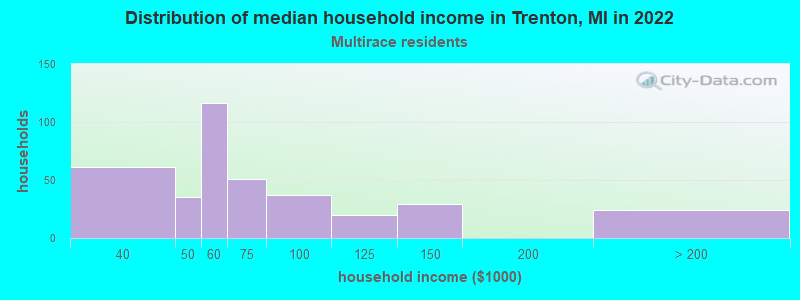
Household income for Two or more races householders
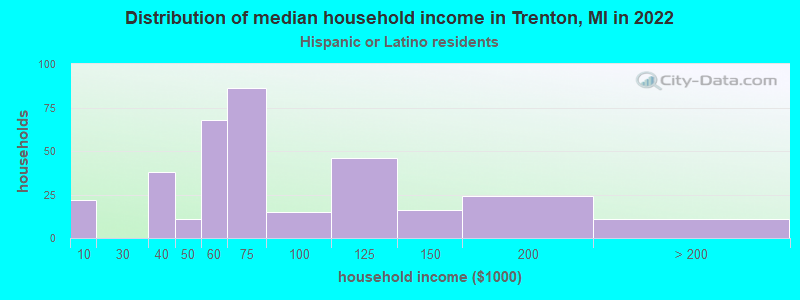
Household income for Hispanic or Latino race householders
Median age by race in Trenton
- 50.9Median age for White residents
- 47.6Males
- 54.3Females
- 41.7Median age for Black or African American residents
- 40.1Males
- 44.8Females
- -738,693,466.6Median age for American Indian / Alaska Native residents
- -795,074,757.3Males
- -684,380,031.5Females
- 51.0Median age for Asian residents
- 25.4Males
- 56.4Females
- -934,108,526.2Median age for Native Hawaiian / Pacific Islander residents
- -674,772,035.8Males
- -699,588,476.7Females
- 44.0Median age for Other race residents
- 45.2Males
- 39.1Females
- 34.0Median age for Two or more races residents
- 32.8Males
- 34.3Females
- 50.7Median age for White alone residents
- 47.3Males
- 54.7Females
- 27.9Median age for Hispanic or Latino residents
- 27.9Males
- 27.0Females
Owner/renter occupied households by race in Trenton
- House owners and renters - White residents
- 6,42785.4%Owner occupied
- 1,10014.6%Renter occupied
- House owners and renters - Black or African American residents
- 3723.0%Owner occupied
- 12577.0%Renter occupied
- House owners and renters - Asian residents
- 5281.8%Owner occupied
- 1218.2%Renter occupied
- House owners and renters - Other race residents
- 3781.7%Owner occupied
- 818.3%Renter occupied
- House owners and renters - Two or more races residents
- 28391.7%Owner occupied
- 268.3%Renter occupied
- House owners and renters - White alone residents
- 6,37085.8%Owner occupied
- 1,05314.2%Renter occupied
- House owners and renters - Hispanic or Latino residents
- 23071.8%Owner occupied
- 9028.2%Renter occupied
Language usage in Trenton
- English speakers - Total
- 95.5% of residents of Trenton speak English at home.
- 1.4% of residents speak Spanish at home
- 22190.2%Speak English very well
- 249.8%Speak English less than very well
- 2.9% of residents speak other language at home
- 29758.5%Speak English very well
- 21141.5%Speak English less than very well
- English speakers - Born in the United States
- 96.7% of residents of Trenton speak English at home.
- 1.2% of residents speak Spanish at home
- 24100.0%Speak English very well
- 1.3% of residents speak other language at home
- 25100.0%Speak English very well
All residents speak only English at home
- English speakers - Foreign-born
- 34.4% of residents of Trenton speak English at home.
- 11.5% of residents speak Spanish at home
- 6985.2%Speak English very well
- 1214.8%Speak English less than very well
- 53.4% of residents speak other language at home
- 16343.4%Speak English very well
- 21356.6%Speak English less than very well
White (Caucasian) - Speak only English
| Native: | 99.6% (14,677) |
| Foreign-born: | 33.3% (201) |
White (Caucasian) - Speak another language
| Native: | 1.4% (206) |
| Foreign-born: | 67.1% (405) |
Asian - Speak only English
| Native: | 79.1% (59) |
| Foreign-born: | 60.6% (53) |
Asian - Speak another language
| Native: | 16.8% (13) |
| Foreign-born: | 46.7% (41) |
Other race - Speak another language
| Native: | 64.2% (40) |
| Foreign-born: | 100.0% (10) |
White alone - Speak only English
| Native: | 99.3% (14,277) |
| Foreign-born: | 35.9% (205) |
White alone - Speak another language
| Native: | 1.2% (179) |
| Foreign-born: | 63.3% (361) |
Hispanic or Latino - Speak another language
| Native: | 13.8% (118) |
| Foreign-born: | 100.0% (71) |
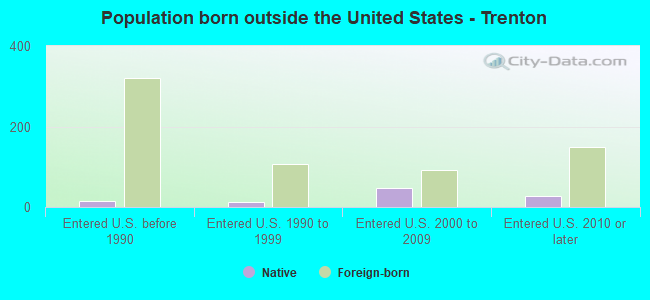
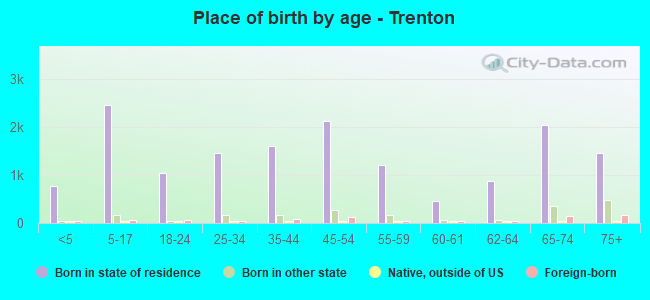
Foreign-born residents in Trenton
687 residents are foreign born (1.7% Europe, 1.1% Asia, 0.5% Latin America, 0.4% North America).
| This city: | 3.8% |
| Michigan: | 6.9% |
Marital status for residents in Trenton
Marital status - White (Caucasian) population 15 years and over
- Males
- 28.6%Never married
- 54.6%Now married
- 2.7%Separated
- 2.8%Widowed
- 11.3%Divorced
- Females
- 20.3%Never married
- 46.0%Now married
- 0.9%Separated
- 13.4%Widowed
- 19.3%Divorced
Women who gave birth in the past 12 months
| Now married: | 100.0% (69) |
| Unmarried: | 0.0% (0) |
Women who did not give birth in the past 12 months
| Now married: | 44.9% (1,298) |
| Unmarried: | 55.1% (1,593) |
Marital status - Black or African American population 15 years and over
- Males
- 43.4%Never married
- 18.2%Now married
- 4.4%Separated
- 0.0%Widowed
- 34.0%Divorced
- Females
- 74.8%Never married
- 11.5%Now married
- 0.9%Separated
- 5.0%Widowed
- 7.8%Divorced
Women who gave birth in the past 12 months
| Now married: | 0.0% (0) |
| Unmarried: | 100.0% (39) |
Women who did not give birth in the past 12 months
| Now married: | 28.7% (26) |
| Unmarried: | 71.3% (64) |
Marital status - Asian population 15 years and over
- Males
- 52.1%Never married
- 21.9%Now married
- 0.0%Separated
- 26.0%Widowed
- 0.0%Divorced
- Females
- 20.4%Never married
- 55.6%Now married
- 0.0%Separated
- 0.0%Widowed
- 24.1%Divorced
Women who did not give birth in the past 12 months
| Now married: | 50.0% (11) |
| Unmarried: | 50.0% (11) |
Marital status - Other race population 15 years and over
- Males
- 33.3%Never married
- 66.7%Now married
- 0.0%Separated
- 0.0%Widowed
- 0.0%Divorced
- Females
- 40.0%Never married
- 60.0%Now married
- 0.0%Separated
- 0.0%Widowed
- 0.0%Divorced
Women who did not give birth in the past 12 months
| Now married: | 27.3% (3) |
| Unmarried: | 72.7% (9) |
Marital status - Two or more races population 15 years and over
- Males
- 26.0%Never married
- 65.6%Now married
- 0.0%Separated
- 1.8%Widowed
- 6.6%Divorced
- Females
- 12.6%Never married
- 64.4%Now married
- 4.6%Separated
- 6.7%Widowed
- 11.7%Divorced
Women who did not give birth in the past 12 months
| Now married: | 70.9% (140) |
| Unmarried: | 29.1% (57) |
Marital status - White alone, not Hispanic / Latino population 15 years and over
- Males
- 28.0%Never married
- 54.9%Now married
- 2.8%Separated
- 2.6%Widowed
- 11.6%Divorced
- Females
- 19.0%Never married
- 46.3%Now married
- 0.9%Separated
- 14.1%Widowed
- 19.7%Divorced
Women who gave birth in the past 12 months
| Now married: | 100.0% (70) |
| Unmarried: | 0.0% (0) |
Women who did not give birth in the past 12 months
| Now married: | 47.1% (1,280) |
| Unmarried: | 52.9% (1,437) |
Marital status - Hispanic or Latino population 15 years and over
- Males
- 44.0%Never married
- 50.5%Now married
- 0.0%Separated
- 5.5%Widowed
- 0.0%Divorced
- Females
- 45.5%Never married
- 43.0%Now married
- 0.5%Separated
- 1.8%Widowed
- 9.3%Divorced
Women who did not give birth in the past 12 months
| Now married: | 19.4% (56) |
| Unmarried: | 80.6% (233) |
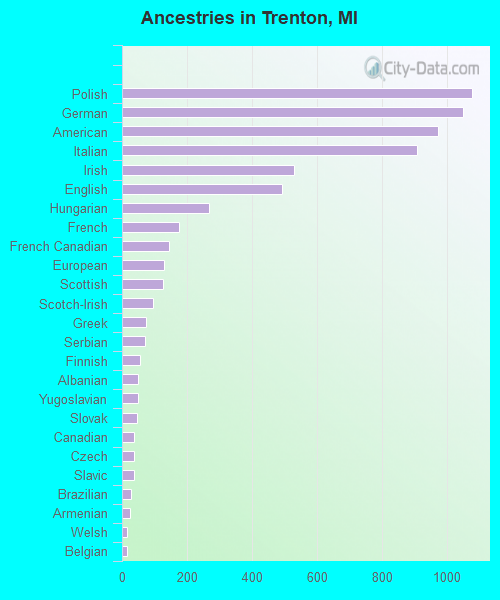
Ancestries in Trenton

- 1,07713.7%Polish
- 1,05013.3%German
- 97412.4%American
- 90811.5%Italian
- 5316.7%Irish
- 4946.3%English
- 2673.4%Hungarian
- 1752.2%French
- 1461.9%French Canadian
- 1281.6%European
- 1251.6%Scottish
- 971.2%Scotch-Irish
- 730.9%Greek
- 710.9%Serbian
- 570.7%Finnish
- 500.6%Albanian
- 490.6%Yugoslavian
- 450.6%Slovak
- 370.5%Canadian
- 360.5%Czech
- 360.5%Slavic
- 270.3%Brazilian
- 250.3%Armenian
- 150.2%Welsh
- 140.2%Belgian
- 130.2%Scandinavian
- 100.1%Maltese
- 90.1%Lithuanian
- 80.1%Dutch
- 80.1%Russian
- 80.1%Ukrainian
- 70.09%Northern European
- 60.08%Austrian
- 60.08%Norwegian
- 40.05%Cypriot
- 40.05%British
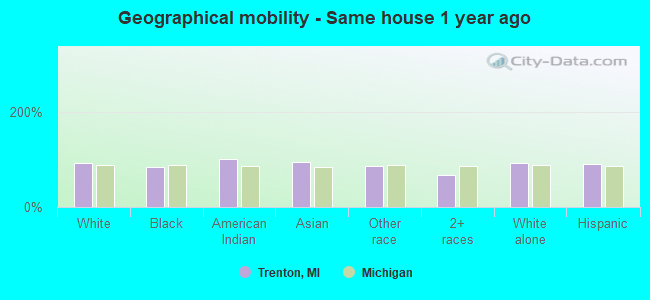
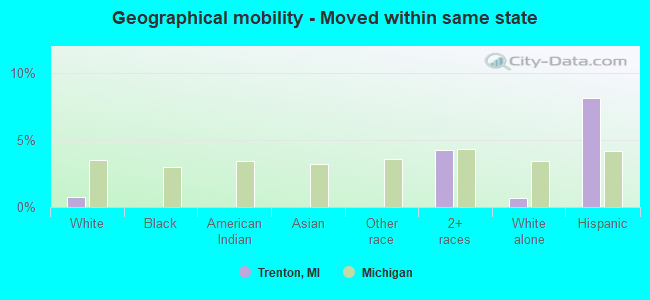
Geographical mobility in Trenton

- Same house 1 year ago
- 14,96193.1%White (Caucasian)
- 34484.0%Black or African American
- 8100.0%American Indian / Alaska Native
- 15094.3%Asian
- 6185.2%Other race
- 80067.2%Two or more races
- 14,60592.9%White alone, not Hispanic / Latino
- 81990.0%Hispanic or Latino
-
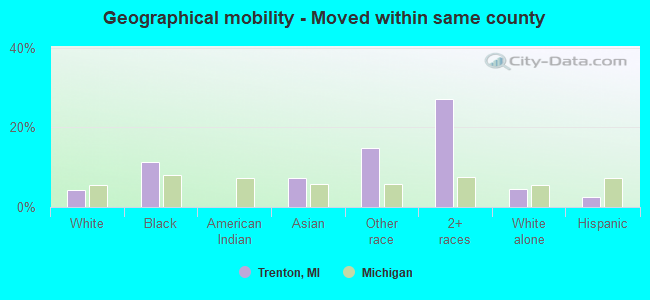
- Moved within same county
- 6894.3%White / Caucasian
- 4611.3%Black or African American
- 127.4%Asian
- 1114.9%Other race
- 32327.1%Two or more races
- 7174.6%White alone, not Hispanic / Latino
- 232.5%Hispanic or Latino
-
- Moved within same state
- 1250.8%White / Caucasian
- 514.3%Two or more races
- 1070.7%White alone, not Hispanic / Latino
- 748.1%Hispanic or Latino
-
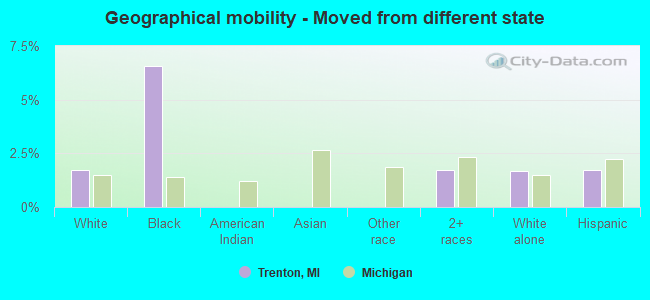
- Moved from different state
- 2761.7%White / Caucasian
- 276.6%Black or African American
- 211.7%Two or more races
- 2601.7%White alone, not Hispanic / Latino
- 161.7%Hispanic or Latino
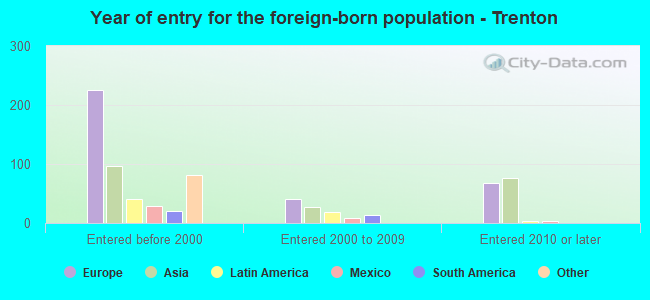
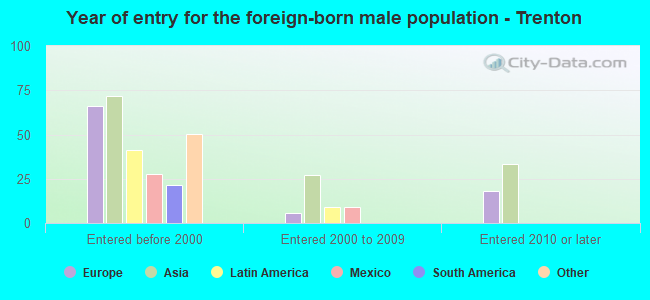
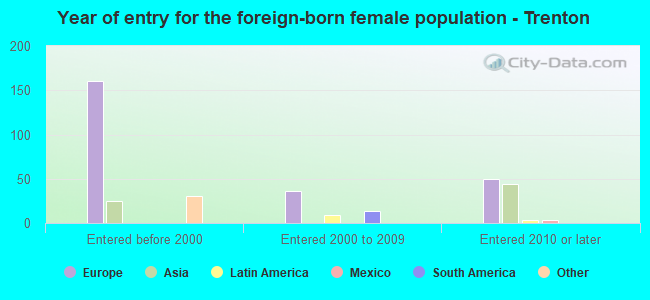
Children Nativity (place of birth) in Trenton
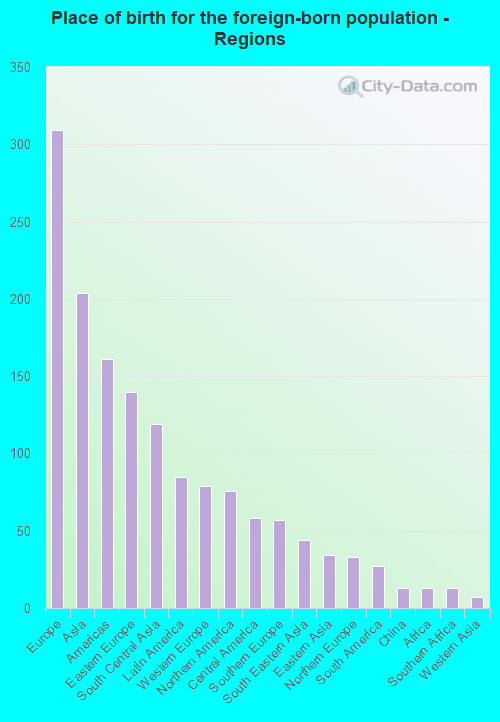
Place of birth for residents in Trenton
![Place of birth for the foreign-born population - Regions]()
- 309Europe
- 204Asia
- 161Americas
- 140Eastern Europe
- 119South Central Asia
- 85Latin America
- 79Western Europe
- 76Northern America
- 58Central America
- 57Southern Europe
- 44South Eastern Asia
- 34Eastern Asia
- 33Northern Europe
- 27South America
- 13China
- 13Africa
- 13Southern Africa
- 7Western Asia
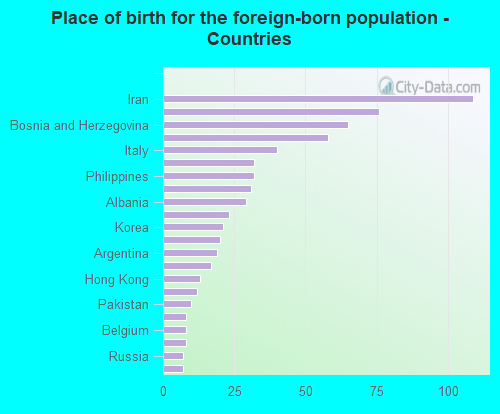
![Place of birth for the foreign-born population - Countries]()
- 109Iran
- 76Canada
- 65Bosnia and Herzegovina
- 58Mexico
- 40Italy
- 32Switzerland
- 32Philippines
- 31Germany
- 29Albania
- 23Scotland
- 21Korea
- 20Hungary
- 19Argentina
- 17Greece
- 13Hong Kong
- 12Vietnam
- 10Pakistan
- 8Austria
- 8Belgium
- 8Colombia
- 7Russia
- 7Jordan
Grandparents responsible for own grandchildren in Trenton
Zip codes: 48183.