Races in Tysons Corner, Virginia (VA) Detailed Stats
According to 2022 data, the most numerous races in Tysons Corner, VA are White alone (11,606 residents), Black alone (1,073 residents), and Hispanic (2,758 residents). 44.4% of Tysons Corner residents speak English at home. 47.1% of Tysons Corner, VA residents are foreign-born (32.2% born in Asia, 5.1% born in Latin America, 5.0% born in Europe), which is 74.5% greater than the foreign-born rate of 12.0% across the entire state of Virginia.
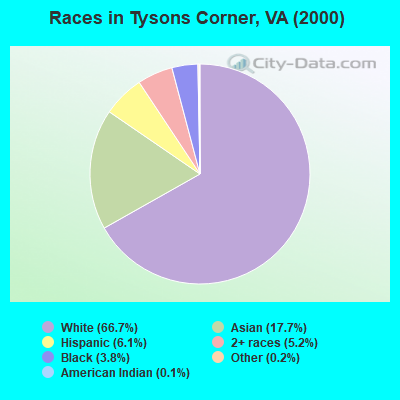
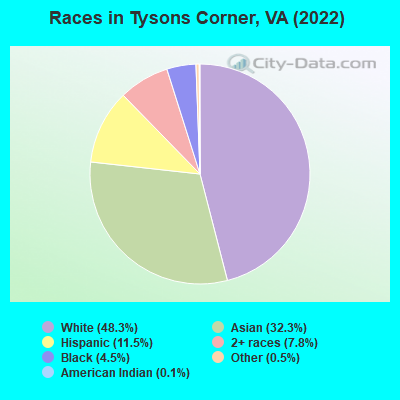
Race distribution in Tysons Corner
2000 2022
4,965,637 70.2% White alone 1,376,378 19.4% Black alone 329,540 4.7% Hispanic 259,277 3.7% Asian alone 114,022 1.6% Two or more races 18,596 0.3% American Indian alone 11,685 0.2% Other race alone 3,380 0.05% Native Hawaiian and Other
5,095,130 58.7% White alone 1,594,785 18.4% Black alone 905,750 10.4% Hispanic 602,881 6.9% Asian alone 406,047 4.7% Two or more races 60,419 0.7% Other race alone 11,738 0.1% American Indian alone 6,869 0.08% Native Hawaiian and Other
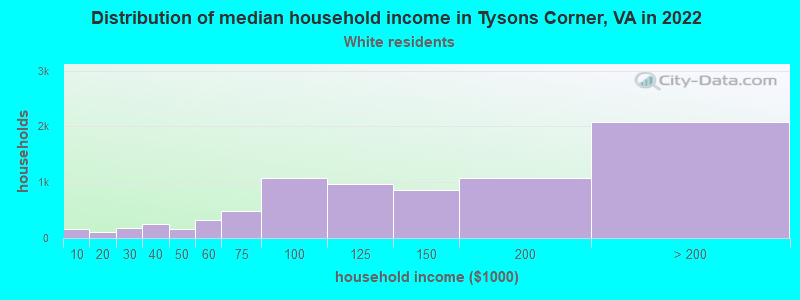
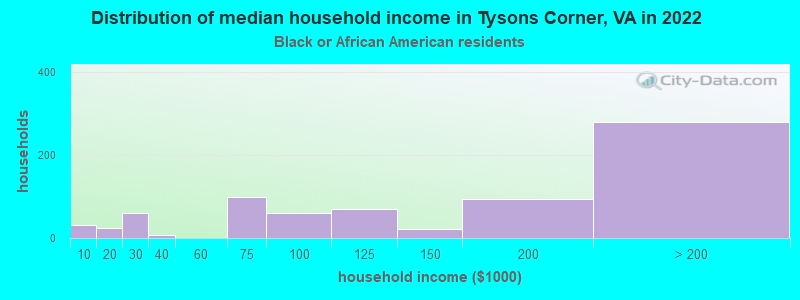
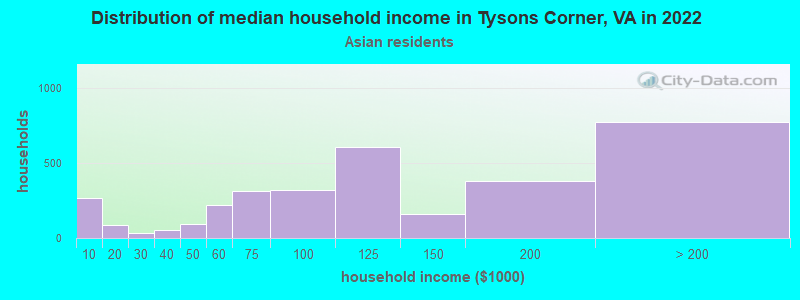
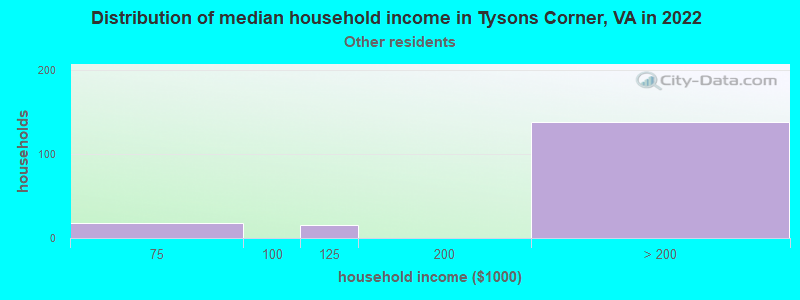
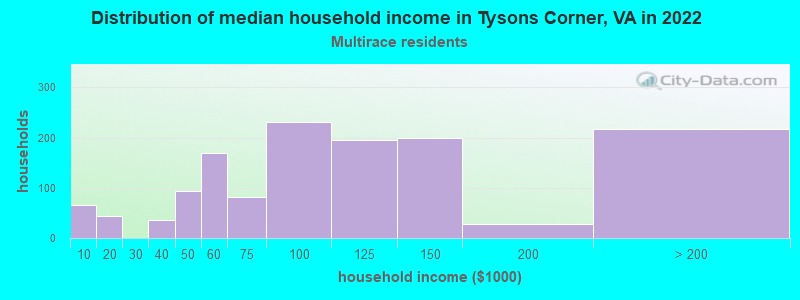
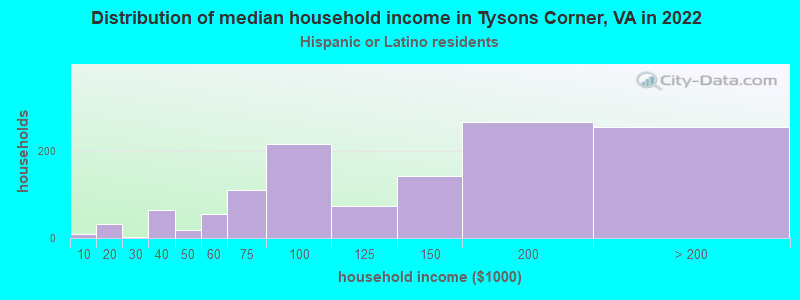
Income and house value in Tysons Corner Median household income in 2022 $138,403 White non-Hispanic householders$105,759 Black householders$65,541 American Indian and Alaska Native householders$122,274 Asian householdersover $200,000 Native Hawaiian and other Pacific Islander householders$187,693 Some other race householders$125,276 Two or more races householders$137,220 Hispanic or Latino race householdersMedian 2022 house value over $1,000,000 White Non-Hispanic householders$928,883 Black or African American householders$656,344 American Indian or Alaska Native householders over $1,000,000 Asian householdersover $1,000,000 Native Hawaiian and other Pacific Islander householders$816,054 Two or more races householdersover $1,000,000 Hispanic or Latino householders
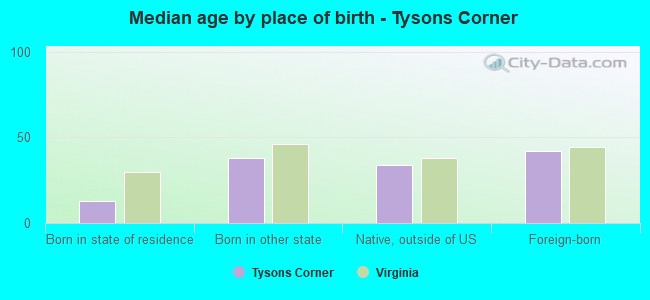
Median age by race in Tysons Corner
38.1 Median age for White residents38.0 38.4 35.8 Median age for Black or African American residents36.8 34.6 36.1 Median age for Asian residents35.1 37.4 20.8 Median age for Native Hawaiian / Pacific Islander residents5.9 31.2 29.3 Median age for Other race residents30.7 24.9 36.5 Median age for Two or more races residents37.7 35.6 38.2 Median age for White alone residents37.9 38.7 32.1 Median age for Hispanic or Latino residents29.4 32.4
Owner/renter occupied households by race in Tysons Corner
House owners and renters - White residents 2,992 45.0% Owner occupied3,656 55.0% Renter occupiedHouse owners and renters - Black or African American residents 168 32.3% Owner occupied352 67.7% Renter occupiedHouse owners and renters - American Indian / Alaska Native residents 35 100.0% Renter occupiedHouse owners and renters - Asian residents 1,404 44.8% Owner occupied1,729 55.2% Renter occupiedHouse owners and renters - Other race residents 25 48.1% Owner occupied26 51.9% Renter occupiedHouse owners and renters - Two or more races residents 191 18.2% Owner occupied860 81.8% Renter occupiedHouse owners and renters - White alone residents 2,820 47.4% Owner occupied3,135 52.6% Renter occupiedHouse owners and renters - Hispanic or Latino residents 264 27.8% Owner occupied684 72.2% Renter occupied
Language usage in Tysons Corner
English speakers - Total 44.4% of residents of Tysons Corner speak English at home.
8.2% of residents speak Spanish at home 1,096 60.3% Speak English very well721 39.7% Speak English less than very well50.6% of residents speak other language at home 7,877 69.9% Speak English very well3,397 30.1% Speak English less than very well
English speakers - Born in the United States 85.8% of residents of Tysons Corner speak English at home.
2.6% of residents speak Spanish at home 175 88.4% Speak English very well23 11.6% Speak English less than very well12.0% of residents speak other language at home 889 98.1% Speak English very well17 1.9% Speak English less than very well
English speakers - Native, born elsewhere 45.8% of residents of Tysons Corner speak English at home.
18.2% of residents speak Spanish at home 77 100.0% Speak English very well36.1% of residents speak other language at home 142 92.8% Speak English very well11 7.2% Speak English less than very well
English speakers - Foreign-born 11.3% of residents of Tysons Corner speak English at home.
10.5% of residents speak Spanish at home 566 45.4% Speak English very well680 54.6% Speak English less than very well79.4% of residents speak other language at home 6,122 65.0% Speak English very well3,303 35.0% Speak English less than very well
White (Caucasian) - Speak only English Native:
84.8% (6,810)Foreign-born:
10.9% (379)
White (Caucasian) - Speak another language Native:
13.5% (1,086)Foreign-born:
88.2% (3,079)
Black or African American - Speak only English Native:
99.0% (563)Foreign-born:
23.5% (116)
Black or African American - Speak another language Native:
2.9% (17)Foreign-born:
77.5% (382)
Asian - Speak only English Native:
37.5% (558)Foreign-born:
13.5% (756)
Asian - Speak another language Native:
60.8% (905)Foreign-born:
86.8% (4,877)
Other race - Speak only English Native:
34.3% (43)Foreign-born:
6.6% (16)
Other race - Speak another language Native:
64.8% (81)Foreign-born:
93.3% (227)
Two or more races - Speak only English Native:
74.1% (861)Foreign-born:
7.1% (149)
Two or more races - Speak another language Native:
31.7% (369)Foreign-born:
95.0% (2,003)
White alone - Speak only English Native:
88.0% (6,538)Foreign-born:
12.6% (455)
White alone - Speak another language Native:
11.6% (858)Foreign-born:
87.8% (3,184)
Hispanic or Latino - Speak only English Native:
45.8% (496)Foreign-born:
6.5% (84)
Hispanic or Latino - Speak another language Native:
54.1% (586)Foreign-born:
93.5% (1,216)
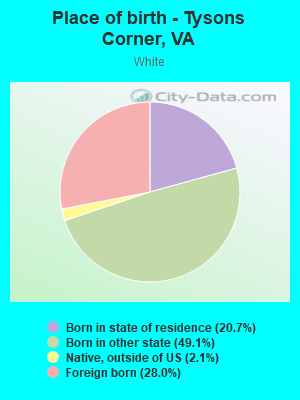
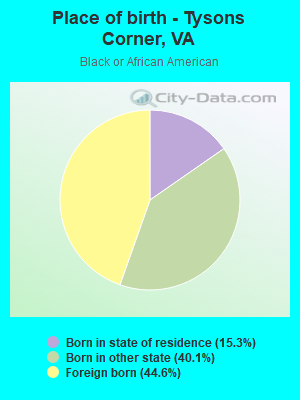
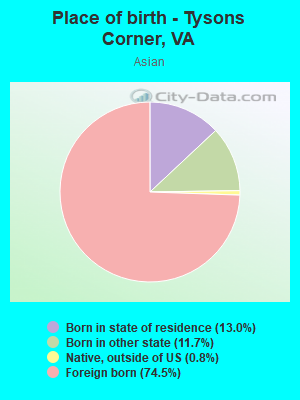
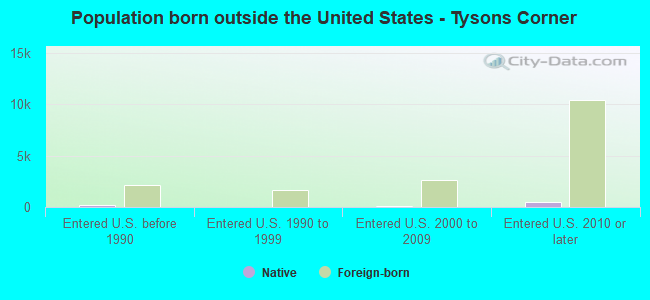
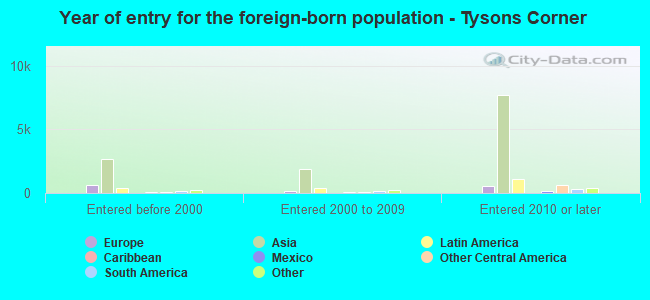
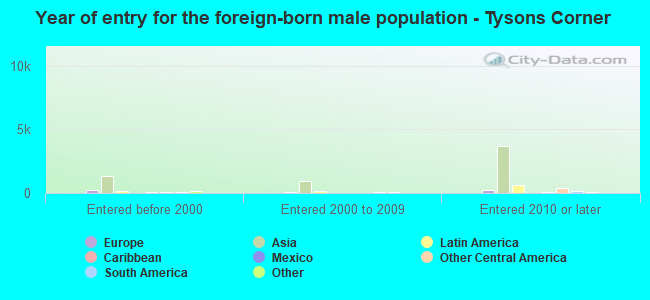
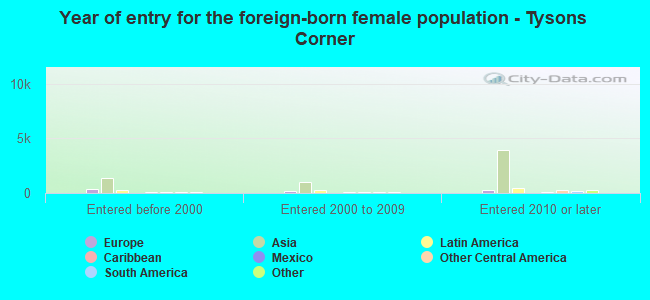
Foreign-born residents in Tysons Corner 11,315 residents are foreign born (32.2% Asia , 5.1% Latin America , 5.0% Europe ).
This city:
47.1%Virginia:
100.0%
Marital status for residents in Tysons Corner Marital status - White (Caucasian) population 15 years and over
Males 41.5% Never married46.7% Now married2.2% Separated1.3% Widowed8.2% DivorcedFemales 26.2% Never married49.0% Now married1.9% Separated6.5% Widowed16.5% DivorcedWomen who gave birth in the past 12 months Now married:
83.4% (148)Unmarried:
16.6% (29)
Women who did not give birth in the past 12 months Now married:
51.5% (1,581)Unmarried:
48.5% (1,492)
Marital status - Black or African American population 15 years and over
Males 50.1% Never married34.3% Now married4.0% Separated2.8% Widowed8.7% DivorcedFemales 44.4% Never married36.2% Now married4.8% Separated0.0% Widowed14.6% DivorcedWomen who gave birth in the past 12 months Now married:
3.1% (1)Unmarried:
96.9% (31)
Women who did not give birth in the past 12 months Now married:
33.7% (88)Unmarried:
66.3% (172)
Marital status - Asian population 15 years and over
Males 32.6% Never married63.3% Now married0.3% Separated0.4% Widowed3.5% DivorcedFemales 25.5% Never married58.5% Now married2.2% Separated6.1% Widowed7.7% DivorcedWomen who gave birth in the past 12 months Now married:
93.0% (121)Unmarried:
7.0% (9)
Women who did not give birth in the past 12 months Now married:
67.0% (1,397)Unmarried:
33.0% (688)
Marital status - Other race population 15 years and over
Males 52.6% Never married47.4% Now married0.0% Separated0.0% Widowed0.0% DivorcedFemales 50.5% Never married41.7% Now married0.0% Separated0.0% Widowed7.8% DivorcedWomen who did not give birth in the past 12 months Now married:
28.6% (35)Unmarried:
71.4% (86)
Marital status - Two or more races population 15 years and over
Males 47.7% Never married48.1% Now married0.0% Separated0.0% Widowed4.1% DivorcedFemales 52.7% Never married30.6% Now married0.0% Separated8.9% Widowed7.8% DivorcedWomen who gave birth in the past 12 months Now married:
100.0% (20)Unmarried:
0.0% (0)
Women who did not give birth in the past 12 months Now married:
33.3% (268)Unmarried:
66.7% (537)
Marital status - White alone, not Hispanic / Latino population 15 years and over
Males 41.5% Never married47.0% Now married1.8% Separated1.5% Widowed8.1% DivorcedFemales 25.6% Never married48.1% Now married2.1% Separated7.3% Widowed16.9% DivorcedWomen who gave birth in the past 12 months Now married:
90.0% (139)Unmarried:
10.0% (15)
Women who did not give birth in the past 12 months Now married:
51.7% (1,394)Unmarried:
48.3% (1,302)
Marital status - Hispanic or Latino population 15 years and over
Males 42.6% Never married44.8% Now married5.0% Separated0.0% Widowed7.6% DivorcedFemales 31.1% Never married55.4% Now married0.1% Separated0.9% Widowed12.5% DivorcedWomen who gave birth in the past 12 months Now married:
46.7% (16)Unmarried:
53.3% (18)
Women who did not give birth in the past 12 months Now married:
49.1% (312)Unmarried:
50.9% (323)
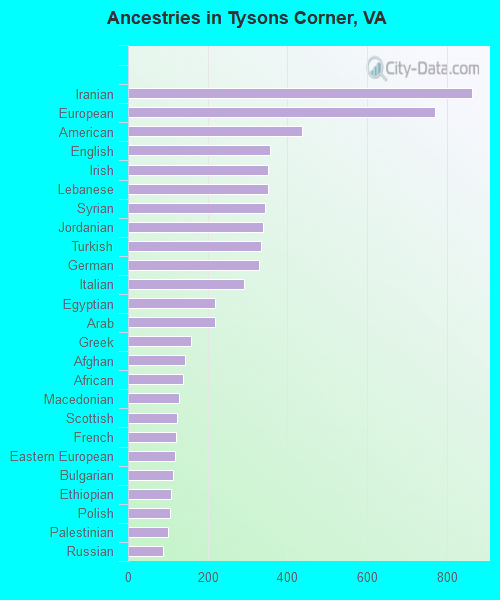
Ancestries in Tysons Corner
863 5.7% Iranian770 5.0% European436 2.9% American356 2.3% English352 2.3% Irish351 2.3% Lebanese344 2.3% Syrian339 2.2% Jordanian335 2.2% Turkish329 2.2% German291 1.9% Italian218 1.4% Egyptian218 1.4% Arab159 1.0% Greek144 0.9% Afghan137 0.9% African129 0.8% Macedonian122 0.8% Scottish121 0.8% French117 0.8% Eastern European112 0.7% Bulgarian109 0.7% Ethiopian106 0.7% Polish101 0.7% Palestinian87 0.6% Russian73 0.5% Romanian53 0.3% Scotch-Irish52 0.3% Scandinavian46 0.3% Jamaican45 0.3% Portuguese43 0.3% Moroccan40 0.3% British38 0.2% Dutch35 0.2% Yugoslavian32 0.2% Hungarian27 0.2% Brazilian26 0.2% Canadian24 0.2% Armenian24 0.2% Sudanese21 0.1% Ukrainian19 0.1% Albanian19 0.1% Czech19 0.1% South African18 0.1% Slovak17 0.1% Norwegian14 0.09% Northern European13 0.09% Serbian12 0.08% Somali6 0.04% Croatian5 0.03% Finnish3 0.02% Latvian
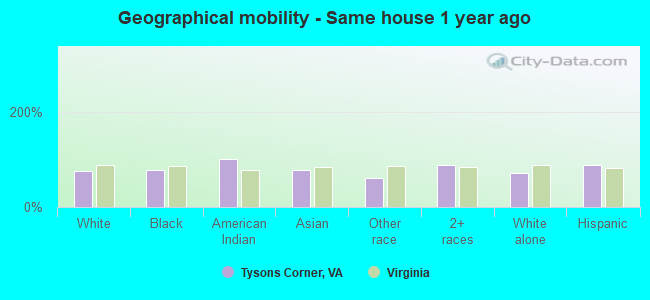
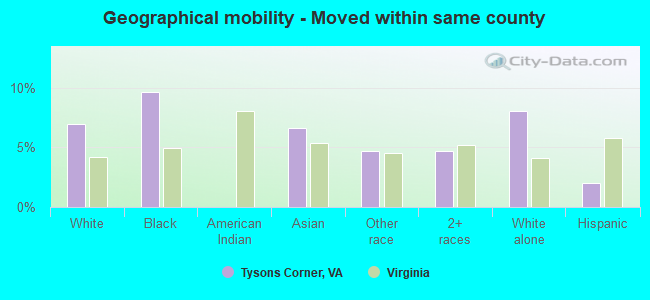
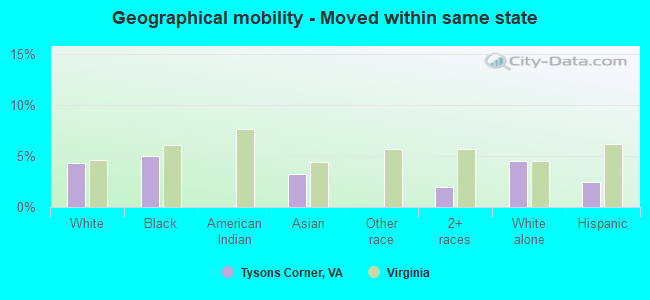
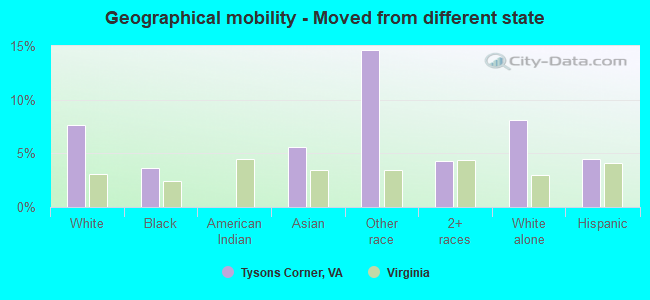
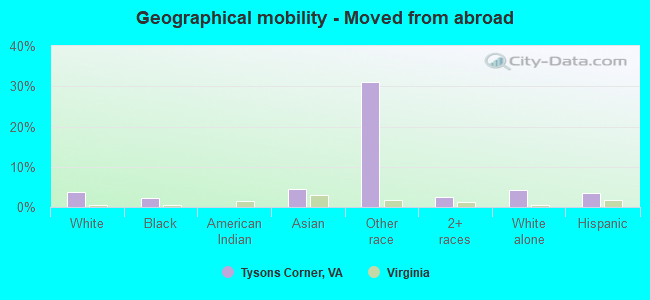
Geographical mobility in Tysons Corner Same house 1 year ago 9,787 75.1% White (Caucasian)795 76.9% Black or African American34 100.0% American Indian / Alaska Native5,931 76.8% Asian250 60.5% Other race2,473 87.8% Two or more races8,305 72.4% White alone, not Hispanic / Latino2,381 89.4% Hispanic or LatinoMoved within same county 903 6.9% White / Caucasian100 9.7% Black or African American512 6.6% Asian19 4.7% Other race133 4.7% Two or more races918 8.0% White alone, not Hispanic / Latino54 2.0% Hispanic or LatinoMoved within same state 561 4.3% White / Caucasian52 5.0% Black or African American251 3.3% Asian54 1.9% Two or more races513 4.5% White alone, not Hispanic / Latino65 2.4% Hispanic or LatinoMoved from different state 992 7.6% White / Caucasian37 3.6% Black or African American430 5.6% Asian61 14.7% Other race122 4.3% Two or more races933 8.1% White alone, not Hispanic / Latino119 4.5% Hispanic or LatinoMoved from abroad 495 3.8% White23 2.2% Black or African American343 4.4% Asian128 31.1% Other race67 2.4% Two or more races487 4.3% White alone, not Hispanic / Latino91 3.4% Hispanic or Latino
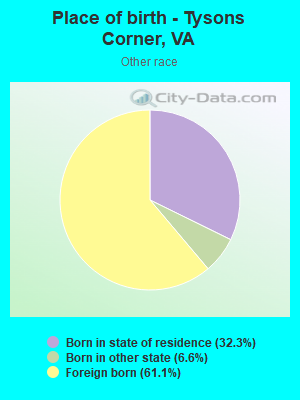
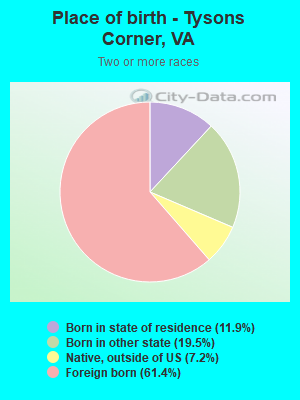
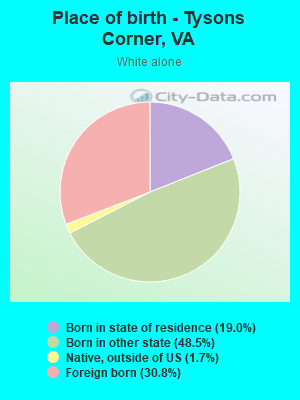
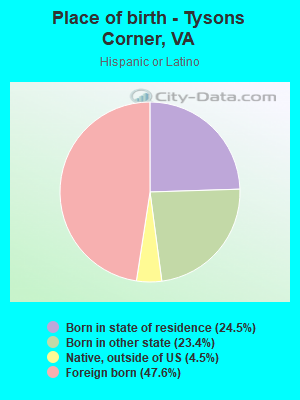
Children Nativity (place of birth) in Tysons Corner
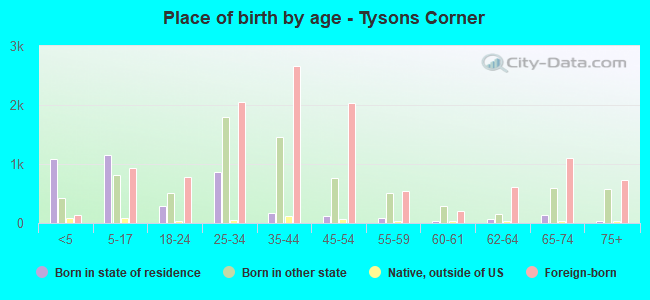
Children under 6 years - Living with two parents Both parents native 518 100.0% NativeBoth parents foreign-born 714 72.6% Native269 27.4% Foreign-bornOne native, one foreign-born parent 174 97.9% Native4 2.1% Foreign-bornChildren under 6 years - Living with one parent Native parent 107 100.0% NativeForeign-born parent 167 100.0% NativeChildren 6 to 17 years - Living with two parents Both parents native 275 100.0% NativeBoth parents foreign-born 699 50.0% Native699 50.0% Foreign-bornOne native, one foreign-born parent 234 95.2% Native12 4.8% Foreign-bornChildren 6 to 17 years - Living with one parent Native parent 124 100.0% NativeForeign-born parent 544 56.4% Native420 43.6% Foreign-born
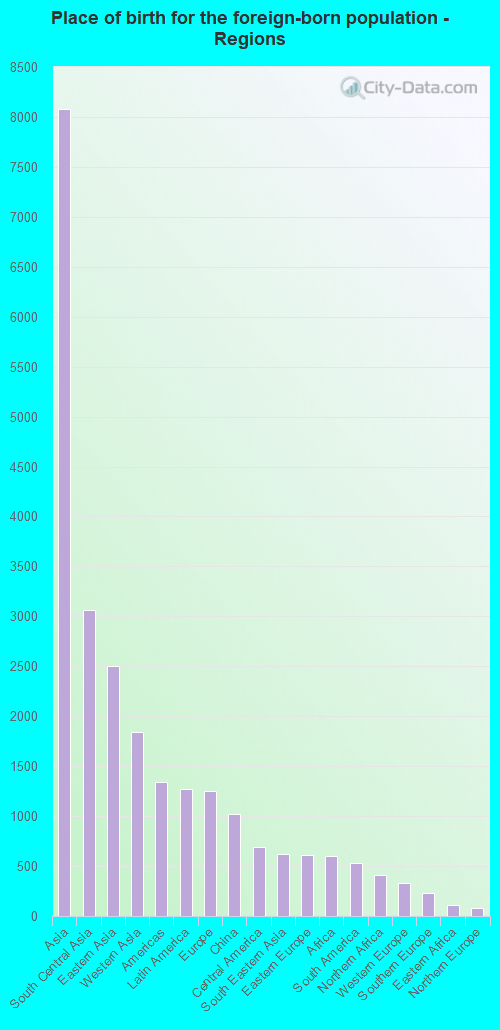
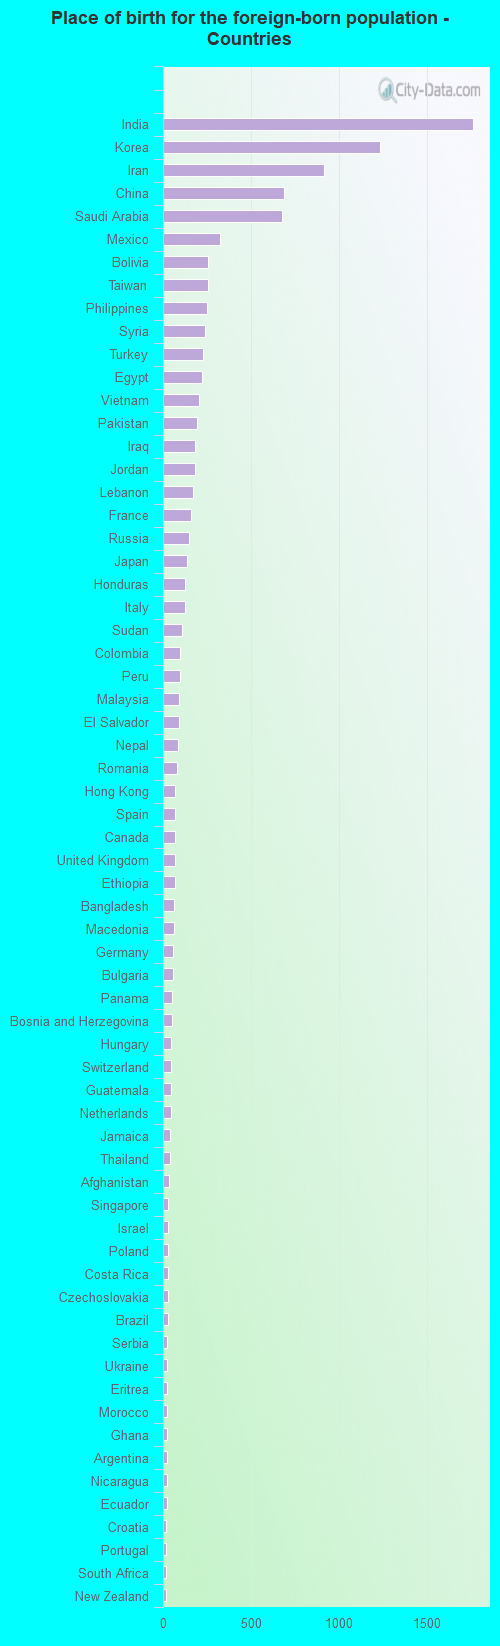
Place of birth for residents in Tysons Corner 8,080 Asia3,065 South Central Asia2,507 Eastern Asia1,847 Western Asia1,344 Americas1,276 Latin America1,253 Europe1,017 China687 Central America621 South Eastern Asia615 Eastern Europe600 Africa531 South America411 Northern Africa329 Western Europe227 Southern Europe107 Eastern Africa81 Northern Europe67 Northern America58 Caribbean35 Oceania33 Western Africa19 Southern Africa19 Australia and New Zealand Subregion8 Middle Africa1,767 India1,235 Korea919 Iran688 China678 Saudi Arabia323 Mexico258 Bolivia258 Taiwan249 Philippines238 Syria227 Turkey220 Egypt207 Vietnam191 Pakistan184 Iraq180 Jordan172 Lebanon160 France149 Russia138 Japan126 Honduras123 Italy107 Sudan98 Colombia94 Peru89 Malaysia89 El Salvador86 Nepal77 Romania70 Hong Kong68 Spain67 Canada67 United Kingdom66 Ethiopia65 Bangladesh63 Macedonia59 Germany56 Bulgaria51 Panama50 Bosnia and Herzegovina47 Hungary45 Switzerland45 Guatemala44 Netherlands40 Jamaica39 Thailand34 Afghanistan31 Singapore30 Israel30 Poland29 Costa Rica28 Czechoslovakia27 Brazil24 Serbia23 Ukraine22 Eritrea22 Morocco22 Ghana22 Argentina20 Nicaragua20 Ecuador19 Croatia19 Portugal19 South Africa19 New Zealand16 Fiji15 Greece15 Kuwait14 Austria13 Sweden11 Nigeria10 Chile9 Trinidad and Tobago8 Latvia8 Dominican Republic8 Moldova5 Belgium4 Cambodia
Grandparents responsible for own grandchildren in Tysons Corner
Grandparents (30 to 59 years) White / Caucasian 10 100.0% Not responsible for grandchildrenBlack or African American 7 100.0% Responsible for grandchildrenAsian 40 100.0% Not responsible for grandchildrenWhite alone, not Hispanic / Latino 15 100.0% Not responsible for grandchildrenGrandparents (60 years and over) White / Caucasian 26 25.0% Responsible for grandchildren79 75.0% Not responsible for grandchildrenBlack or African American 11 100.0% Responsible for grandchildrenAsian 62 100.0% Not responsible for grandchildrenWhite alone, not Hispanic / Latino 32 28.4% Responsible for grandchildren81 71.6% Not responsible for grandchildren