Races in Upper Christiana, Delaware (DE) Detailed Stats
Ancestries, Foreign-born residents, place of birth
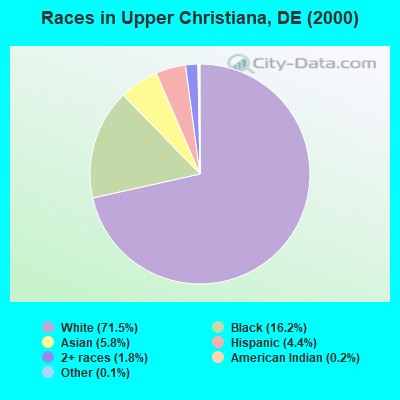
Race distribution in Upper Christiana

- 17,52671.5%White alone
- 3,97616.2%Black alone
- 1,4155.8%Asian alone
- 1,0694.4%Hispanic
- 4491.8%Two or more races
- 600.2%American Indian alone
- 320.1%Other race alone
- 20.01%Native Hawaiian and Other
Pacific Islander alone
2000
2022
-
- 567,97372.5%White alone
- 148,43518.9%Black alone
- 37,2774.8%Hispanic
- 16,1102.1%Asian alone
- 10,2221.3%Two or more races
- 2,3240.3%American Indian alone
- 1,0250.1%Other race alone
- 2340.03%Native Hawaiian and Other
Pacific Islander alone

-
- 599,34758.9%White alone
- 220,01021.6%Black alone
- 105,30010.3%Hispanic
- 46,0164.5%Two or more races
- 41,3504.1%Asian alone
- 5,0970.5%Other race alone
- 1,2760.1%American Indian alone

Income and house value in Upper Christiana
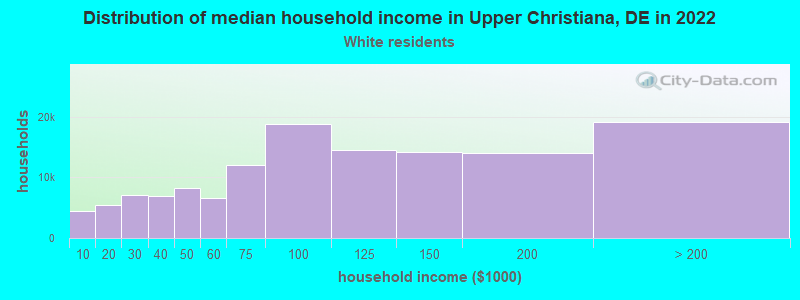
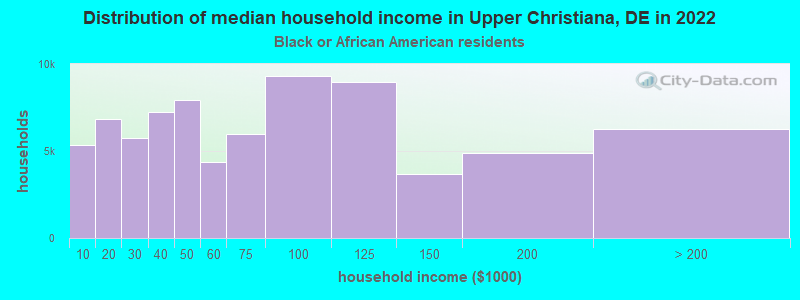
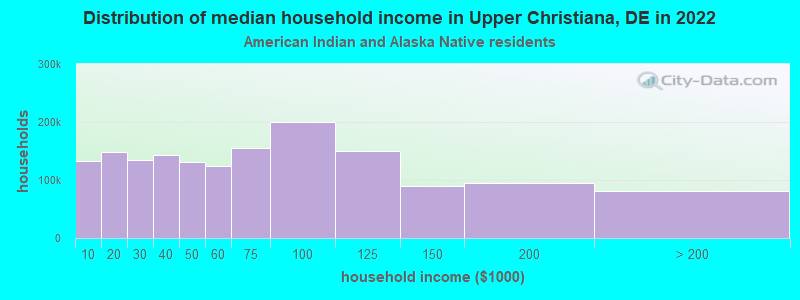
- Median household income in 2022
- $93,357White non-Hispanic householders
- $86,429Black householders
- $81,877American Indian and Alaska Native householders
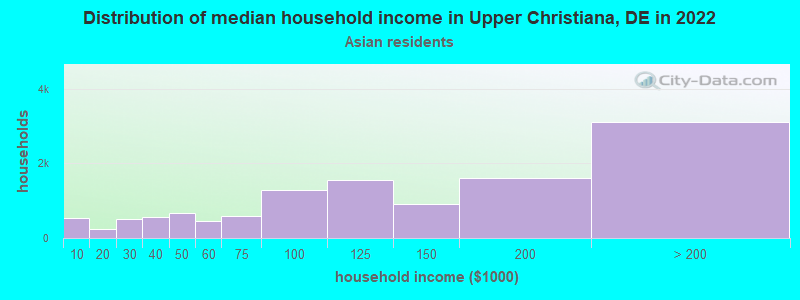
- $107,006Asian householders
- $60,810Some other race householders
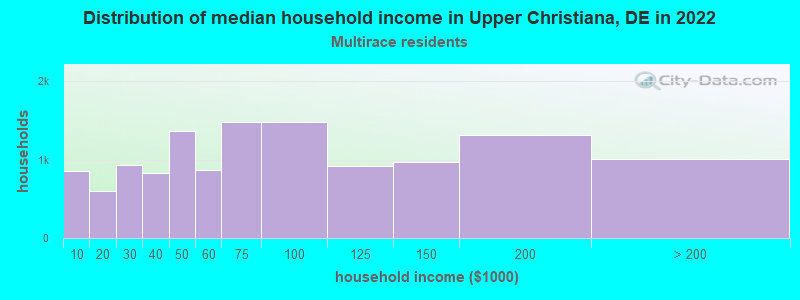
- $55,648Two or more races householders
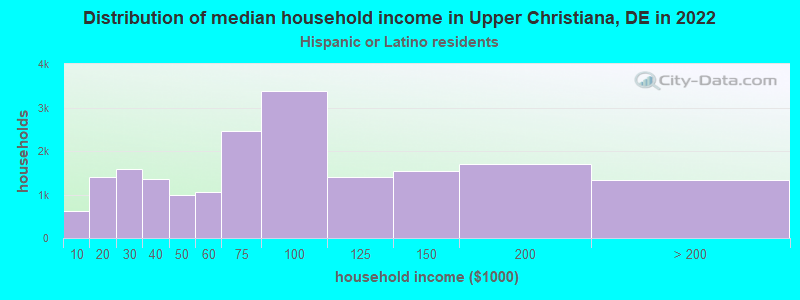
- $75,585Hispanic or Latino race householders
- Median 2022 house value
- $312,226White Non-Hispanic householders
- $325,173Black or African American householders
- $136,941American Indian or Alaska Native householders
- $316,707Asian householders
- $272,886Some other race householders
- $337,871Two or more races householders
- $284,837Hispanic or Latino householders
Household income for White non-Hispanic householders
Household income for Black householders
Household income for American Indian and Alaska Native householders
Household income for Asian householders
Household income for Two or more races householders
Household income for Hispanic or Latino race householders
Zip code: 19713