Races in Village Park, Hawaii (HI) Detailed Stats
Ancestries, Foreign-born residents, place of birth

Recent posts about races in Village Park, Hawaii on our local forum with over 2,400,000 registered users:
 | 150,000.00 Downpayment Available - Where should I look for a house on Oahu? (15 replies) |
| Living near Kaiser Permanente. Need advice quick! (14 replies) |
26.6% of Village Park, HI residents are foreign-born (24.9% born in Asia), which is 32.2% greater than the foreign-born rate of 18.0% across the entire state of Hawaii.
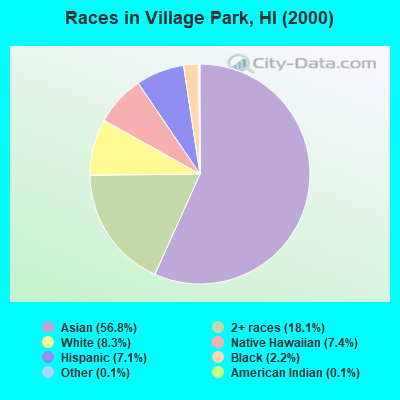
Race distribution in Village Park

- 5,46356.8%Asian alone
- 1,73818.1%Two or more races
- 8028.3%White alone
- 7097.4%Native Hawaiian and Other
Pacific Islander alone - 6827.1%Hispanic
- 2092.2%Black alone
- 120.1%Other race alone
- 100.1%American Indian alone
2000
2022
-
- 494,14940.8%Asian alone
- 277,09122.9%White alone
- 218,70018.1%Two or more races
- 108,4419.0%Native Hawaiian and Other
Pacific Islander alone - 87,6997.2%Hispanic
- 20,8291.7%Black alone
- 2,0890.2%Other race alone
- 2,5390.2%American Indian alone

-
- 498,12534.6%Asian alone
- 318,57422.1%Two or more races
- 297,93720.7%White alone
- 160,10311.1%Hispanic
- 134,5679.3%Native Hawaiian and Other
Pacific Islander alone - 23,6821.6%Black alone
- 5,3780.4%Other race alone
- 1,8300.1%American Indian alone

Income and house value in Village Park
- Median household income in 2022
- $130,992White non-Hispanic householders
- $96,739Black householders
- $130,449Asian householders
- $103,968Native Hawaiian and other Pacific Islander householders
- $86,515Some other race householders
- $149,446Two or more races householders
- $93,812Hispanic or Latino race householders
- Median 2022 house value
- $740,745White Non-Hispanic householders
- $862,398Black or African American householders
- $744,885Asian householders
- $922,906Native Hawaiian and other Pacific Islander householders
- $691,065Two or more races householders
- $728,643Hispanic or Latino householders
Household income for White non-Hispanic householders

Household income for Black householders

Household income for Asian householders

Household income for Native Hawaiian and other Pacific Islander householders

Household income for Two or more races householders

Household income for Hispanic or Latino race householders

Foreign-born residents in Village Park
2,557 residents are foreign born (24.9% Asia).
| This city: | 26.6% |
| Hawaii: | 17.5% |
Ancestries in Village Park

- 9,44787.4%Other
- 2792.6%German
- 2522.3%Portuguese
- 2302.1%Irish
- 940.9%English
- 830.8%Italian
- 800.7%Norwegian
- 700.6%United States
- 640.6%French
- 530.5%Scotch-Irish
- 380.4%Polish
- 350.3%Scottish
- 230.2%Dutch
- 180.2%French Canadian
- 180.2%Hungarian
- 110.1%Welsh
- 100.09%Swedish
- 70.06%Subsaharan African

Zip codes: 96797.