Races in Waccamaw, South Carolina (SC) Detailed Stats
Ancestries, Foreign-born residents, place of birth
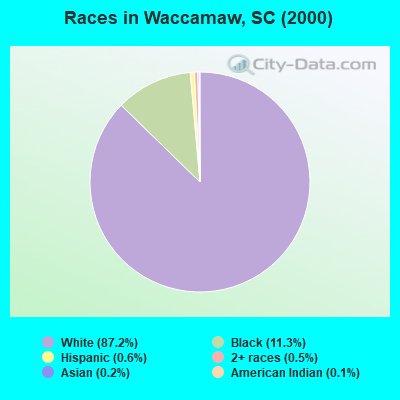
Race distribution in Waccamaw

- 14,51687.2%White alone
- 1,87911.3%Black alone
- 1010.6%Hispanic
- 770.5%Two or more races
- 400.2%Asian alone
- 220.1%American Indian alone
- 70.04%Native Hawaiian and Other
Pacific Islander alone - 40.02%Other race alone
2000
2022
-
- 2,652,29166.1%White alone
- 1,178,48629.4%Black alone
- 95,0762.4%Hispanic
- 35,5680.9%Asian alone
- 33,2900.8%Two or more races
- 12,7650.3%American Indian alone
- 3,2660.08%Other race alone
- 1,2700.03%Native Hawaiian and Other
Pacific Islander alone

-
- 3,301,73962.5%White alone
- 1,313,29024.9%Black alone
- 343,7836.5%Hispanic
- 190,5083.6%Two or more races
- 89,8881.7%Asian alone
- 29,3900.6%Other race alone
- 12,1120.2%American Indian alone
- 1,9240.04%Native Hawaiian and Other
Pacific Islander alone

Income and house value in Waccamaw
- Median household income in 2022
- $90,433White non-Hispanic householders
- $39,595Black householders
- over $200,000American Indian and Alaska Native householders
- $142,363Some other race householders
- $54,216Two or more races householders
- $27,627Hispanic or Latino race householders
- Median 2022 house value
- $726,482White Non-Hispanic householders
- $275,607Black or African American householders
- $474,639American Indian or Alaska Native householders
- $352,184Two or more races householders
- $280,558Hispanic or Latino householders
Household income for White non-Hispanic householders

Household income for Black householders

Household income for American Indian and Alaska Native householders

Household income for Two or more races householders

Household income for Hispanic or Latino race householders

Zip code: 29585