Races in Walnut Park, California (CA) Detailed Stats
Data:
Races - White alone (%)
Races - White alone (% change since 2000)
Races - Black alone (%)
Races - Black alone (% change since 2000)
Races - American Indian alone (%)
Races - American Indian alone (% change since 2000)
Races - Asian alone (%)
Races - Asian alone (% change since 2000)
Races - Hispanic (%)
Races - Hispanic (% change since 2000)
Races - Native Hawaiian and Other Pacific Islander alone (%)
Races - Native Hawaiian and Other Pacific Islander alone (% change since 2000)
Races - Two or more races(%)
Races - Two or more races(% change since 2000)
Races - Other race alone (%)
Races - Other race alone (% change since 2000)
Racial diversity
Place of birth - Born in state of residence (%)
Place of birth - Born in state of residence (%) - White
Place of birth - Born in state of residence (%) - Black or African American
Place of birth - Born in state of residence (%) - Asian
Place of birth - Born in state of residence (%) - Hispanic or Latino
Place of birth - Born in state of residence (%) - American Indian and Alaska Native
Place of birth - Born in state of residence (%) - Multirace
Place of birth - Born in state of residence (%) - Other Race
Place of birth - Born in other state (%)
Place of birth - Born in other state (%) - White
Place of birth - Born in other state (%) - Black or African American
Place of birth - Born in other state (%) - Asian
Place of birth - Born in other state (%) - Hispanic or Latino
Place of birth - Born in other state (%) - American Indian and Alaska Native
Place of birth - Born in other state (%) - Multirace
Place of birth - Born in other state (%) - Other Race
Place of birth - Native, outside of US (%)
Place of birth - Native, outside of US (%) - White
Place of birth - Native, outside of US (%) - Black or African American
Place of birth - Native, outside of US (%) - Asian
Place of birth - Native, outside of US (%) - Hispanic or Latino
Place of birth - Native, outside of US (%) - American Indian and Alaska Native
Place of birth - Native, outside of US (%) - Multirace
Place of birth - Native, outside of US (%) - Other Race
Place of birth - Foreign born (%)
Place of birth - Foreign born (%) - White
Place of birth - Foreign born (%) - Black or African American
Place of birth - Foreign born (%) - Asian
Place of birth - Foreign born (%) - Hispanic or Latino
Place of birth - Foreign born (%) - American Indian and Alaska Native
Place of birth - Foreign born (%) - Multirace
Place of birth - Foreign born (%) - Other Race
Residents speaking English at home (%)
Residents speaking English at home - Born in the United States (%)
Residents speaking English at home - Native, born elsewhere (%)
Residents speaking English at home - Foreign born (%)
Residents speaking Spanish at home (%)
Residents speaking Spanish at home - Born in the United States (%)
Residents speaking Spanish at home - Native, born elsewhere (%)
Residents speaking Spanish at home - Foreign born (%)
Residents speaking other language at home (%)
Residents speaking other language at home - Born in the United States (%)
Residents speaking other language at home - Native, born elsewhere (%)
Residents speaking other language at home - Foreign born (%)
Marital status - Never married (%)
Marital status - Now married (%)
Marital status - Separated (%)
Marital status - Widowed (%)
Marital status - Divorced (%)
Ancestries Reported - Arab (%)
Ancestries Reported - Czech (%)
Ancestries Reported - Danish (%)
Ancestries Reported - Dutch (%)
Ancestries Reported - English (%)
Ancestries Reported - French (%)
Ancestries Reported - French Canadian (%)
Ancestries Reported - German (%)
Ancestries Reported - Greek (%)
Ancestries Reported - Hungarian (%)
Ancestries Reported - Irish (%)
Ancestries Reported - Italian (%)
Ancestries Reported - Lithuanian (%)
Ancestries Reported - Norwegian (%)
Ancestries Reported - Polish (%)
Ancestries Reported - Portuguese (%)
Ancestries Reported - Russian (%)
Ancestries Reported - Scotch-Irish (%)
Ancestries Reported - Scottish (%)
Ancestries Reported - Slovak (%)
Ancestries Reported - Subsaharan African (%)
Ancestries Reported - Swedish (%)
Ancestries Reported - Swiss (%)
Ancestries Reported - Ukrainian (%)
Ancestries Reported - United States (%)
Ancestries Reported - Welsh (%)
Ancestries Reported - West Indian (%)
Ancestries Reported - Other (%)
Geographical mobility - Same house 1 year ago (%)
Geographical mobility - Same house 1 year ago (%) - White
Geographical mobility - Same house 1 year ago (%) - Black or African American
Geographical mobility - Same house 1 year ago (%) - Asian
Geographical mobility - Same house 1 year ago (%) - Hispanic or Latino
Geographical mobility - Same house 1 year ago (%) - American Indian and Alaska Native
Geographical mobility - Same house 1 year ago (%) - Multirace
Geographical mobility - Same house 1 year ago (%) - Other Race
Geographical mobility - Moved within same county (%)
Geographical mobility - Moved within same county (%) - White
Geographical mobility - Moved within same county (%) - Black or African American
Geographical mobility - Moved within same county (%) - Asian
Geographical mobility - Moved within same county (%) - Hispanic or Latino
Geographical mobility - Moved within same county (%) - American Indian and Alaska Native
Geographical mobility - Moved within same county (%) - Multirace
Geographical mobility - Moved within same county (%) - Other Race
Geographical mobility - Moved from different county within same state (%)
Geographical mobility - Moved from different county within same state (%) - White
Geographical mobility - Moved from different county within same state (%) - Black or African American
Geographical mobility - Moved from different county within same state (%) - Asian
Geographical mobility - Moved from different county within same state (%) - Hispanic or Latino
Geographical mobility - Moved from different county within same state (%) - American Indian and Alaska Native
Geographical mobility - Moved from different county within same state (%) - Multirace
Geographical mobility - Moved from different county within same state (%) - Other Race
Geographical mobility - Moved from different state (%)
Geographical mobility - Moved from different state (%) - White
Geographical mobility - Moved from different state (%) - Black or African American
Geographical mobility - Moved from different state (%) - Asian
Geographical mobility - Moved from different state (%) - Hispanic or Latino
Geographical mobility - Moved from different state (%) - American Indian and Alaska Native
Geographical mobility - Moved from different state (%) - Multirace
Geographical mobility - Moved from different state (%) - Other Race
Geographical mobility - Moved from abroad (%)
Geographical mobility - Moved from abroad (%) - White
Geographical mobility - Moved from abroad (%) - Black or African American
Geographical mobility - Moved from abroad (%) - Asian
Geographical mobility - Moved from abroad (%) - Hispanic or Latino
Geographical mobility - Moved from abroad (%) - American Indian and Alaska Native
Geographical mobility - Moved from abroad (%) - Multirace
Geographical mobility - Moved from abroad (%) - Other Race
Place of birth for the foreign-born population - Ireland (%)
Place of birth for the foreign-born population - Denmark (%)
Place of birth for the foreign-born population - Norway (%)
Place of birth for the foreign-born population - Sweden (%)
Place of birth for the foreign-born population - United Kingdom (%)
Place of birth for the foreign-born population - England (%)
Place of birth for the foreign-born population - Scotland (%)
Place of birth for the foreign-born population - Other Northern Europe (%)
Place of birth for the foreign-born population - Austria (%)
Place of birth for the foreign-born population - Belgium (%)
Place of birth for the foreign-born population - France (%)
Place of birth for the foreign-born population - Germany (%)
Place of birth for the foreign-born population - Netherlands (%)
Place of birth for the foreign-born population - Switzerland (%)
Place of birth for the foreign-born population - Other Western Europe (%)
Place of birth for the foreign-born population - Greece (%)
Place of birth for the foreign-born population - Italy (%)
Place of birth for the foreign-born population - Portugal (%)
Place of birth for the foreign-born population - Spain (%)
Place of birth for the foreign-born population - Other Southern Europe (%)
Place of birth for the foreign-born population - Albania (%)
Place of birth for the foreign-born population - Belarus (%)
Place of birth for the foreign-born population - Bosnia and Herzegovina (%)
Place of birth for the foreign-born population - Bulgaria (%)
Place of birth for the foreign-born population - Croatia (%)
Place of birth for the foreign-born population - Czechoslovakia (%)
Place of birth for the foreign-born population - Hungary (%)
Place of birth for the foreign-born population - Latvia (%)
Place of birth for the foreign-born population - Lithuania (%)
Place of birth for the foreign-born population - North Macedonia (Macedonia) (%)
Place of birth for the foreign-born population - Moldova (%)
Place of birth for the foreign-born population - Poland (%)
Place of birth for the foreign-born population - Romania (%)
Place of birth for the foreign-born population - Russia (%)
Place of birth for the foreign-born population - Serbia (%)
Place of birth for the foreign-born population - Ukraine (%)
Place of birth for the foreign-born population - Other Eastern Europe (%)
Place of birth for the foreign-born population - China (%)
Place of birth for the foreign-born population - Hong Kong (%)
Place of birth for the foreign-born population - Taiwan (%)
Place of birth for the foreign-born population - Japan (%)
Place of birth for the foreign-born population - Korea (%)
Place of birth for the foreign-born population - Other Eastern Asia (%)
Place of birth for the foreign-born population - Afghanistan (%)
Place of birth for the foreign-born population - Bangladesh (%)
Place of birth for the foreign-born population - India (%)
Place of birth for the foreign-born population - Iran (%)
Place of birth for the foreign-born population - Kazakhstan (%)
Place of birth for the foreign-born population - Nepal (%)
Place of birth for the foreign-born population - Pakistan (%)
Place of birth for the foreign-born population - Sri Lanka (%)
Place of birth for the foreign-born population - Uzbekistan (%)
Place of birth for the foreign-born population - Other South Central Asia (%)
Place of birth for the foreign-born population - Burma (%)
Place of birth for the foreign-born population - Cambodia (%)
Place of birth for the foreign-born population - Indonesia (%)
Place of birth for the foreign-born population - Laos (%)
Place of birth for the foreign-born population - Malaysia (%)
Place of birth for the foreign-born population - Philippines (%)
Place of birth for the foreign-born population - Singapore (%)
Place of birth for the foreign-born population - Thailand (%)
Place of birth for the foreign-born population - Vietnam (%)
Place of birth for the foreign-born population - Other South Eastern Asia (%)
Place of birth for the foreign-born population - Armenia (%)
Place of birth for the foreign-born population - Iraq (%)
Place of birth for the foreign-born population - Israel (%)
Place of birth for the foreign-born population - Jordan (%)
Place of birth for the foreign-born population - Kuwait (%)
Place of birth for the foreign-born population - Lebanon (%)
Place of birth for the foreign-born population - Saudi Arabia (%)
Place of birth for the foreign-born population - Syria (%)
Place of birth for the foreign-born population - Turkey (%)
Place of birth for the foreign-born population - Yemen (%)
Place of birth for the foreign-born population - Other Western Asia (%)
Place of birth for the foreign-born population - Eritrea (%)
Place of birth for the foreign-born population - Ethiopia (%)
Place of birth for the foreign-born population - Kenya (%)
Place of birth for the foreign-born population - Somalia (%)
Place of birth for the foreign-born population - Uganda (%)
Place of birth for the foreign-born population - Zimbabwe (%)
Place of birth for the foreign-born population - Other Eastern Africa (%)
Place of birth for the foreign-born population - Cameroon (%)
Place of birth for the foreign-born population - Congo (%)
Place of birth for the foreign-born population - Democratic Republic of Congo (Zaire) (%)
Place of birth for the foreign-born population - Other Middle Africa (%)
Place of birth for the foreign-born population - Egypt (%)
Place of birth for the foreign-born population - Morocco (%)
Place of birth for the foreign-born population - Sudan (%)
Place of birth for the foreign-born population - Other Northern Africa (%)
Place of birth for the foreign-born population - South Africa (%)
Place of birth for the foreign-born population - Other Southern Africa (%)
Place of birth for the foreign-born population - Cabo Verde (%)
Place of birth for the foreign-born population - Ghana (%)
Place of birth for the foreign-born population - Liberia (%)
Place of birth for the foreign-born population - Nigeria (%)
Place of birth for the foreign-born population - Senegal (%)
Place of birth for the foreign-born population - Sierra Leone (%)
Place of birth for the foreign-born population - Other Western Africa (%)
Place of birth for the foreign-born population - Australia (%)
Place of birth for the foreign-born population - New Zealand (%)
Place of birth for the foreign-born population - Fiji (%)
Place of birth for the foreign-born population - Micronesia (%)
Place of birth for the foreign-born population - Bahamas (%)
Place of birth for the foreign-born population - Barbados (%)
Place of birth for the foreign-born population - Cuba (%)
Place of birth for the foreign-born population - Dominica (%)
Place of birth for the foreign-born population - Dominican Republic (%)
Place of birth for the foreign-born population - Grenada (%)
Place of birth for the foreign-born population - Haiti (%)
Place of birth for the foreign-born population - Jamaica (%)
Place of birth for the foreign-born population - St. Vincent and the Grenadines (%)
Place of birth for the foreign-born population - Trinidad and Tobago (%)
Place of birth for the foreign-born population - West Indies (%)
Place of birth for the foreign-born population - Other Caribbean (%)
Place of birth for the foreign-born population - Belize (%)
Place of birth for the foreign-born population - Costa Rica (%)
Place of birth for the foreign-born population - El Salvador (%)
Place of birth for the foreign-born population - Guatemala (%)
Place of birth for the foreign-born population - Honduras (%)
Place of birth for the foreign-born population - Mexico (%)
Place of birth for the foreign-born population - Nicaragua (%)
Place of birth for the foreign-born population - Panama (%)
Place of birth for the foreign-born population - Other Central America (%)
Place of birth for the foreign-born population - Argentina (%)
Place of birth for the foreign-born population - Bolivia (%)
Place of birth for the foreign-born population - Brazil (%)
Place of birth for the foreign-born population - Chile (%)
Place of birth for the foreign-born population - Colombia (%)
Place of birth for the foreign-born population - Ecuador (%)
Place of birth for the foreign-born population - Guyana (%)
Place of birth for the foreign-born population - Peru (%)
Place of birth for the foreign-born population - Uruguay (%)
Place of birth for the foreign-born population - Venezuela (%)
Place of birth for the foreign-born population - Other South America (%)
Place of birth for the foreign-born population - Canada (%)
Place of birth for the foreign-born population - Other Northern America (%)
Place of birth for the foreign-born population - Other (%)
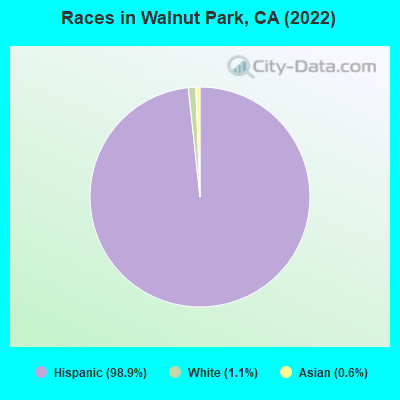
According to 2022 data, the most numerous races in Walnut Park, CA are Hispanic (15,773 residents), White alone (172 residents), and Asian alone (141 residents). 6.2% of Walnut Park residents speak English at home. 48.6% of Walnut Park, CA residents are foreign-born (47.4% born in Latin America), which is 46.5% greater than the foreign-born rate of 26.0% across the entire state of California.
Race distribution in Walnut Park
2000 2022
15,816,790 46.7% White alone 10,966,556 32.4% Hispanic 3,648,860 10.8% Asian alone 2,181,926 6.4% Black alone 903,115 2.7% Two or more races 178,984 0.5% American Indian alone 103,736 0.3% Native Hawaiian and Other 71,681 0.2% Other race alone
15,732,184 40.3% Hispanic 13,160,426 33.7% White alone 5,957,867 15.3% Asian alone 2,025,218 5.2% Black alone 1,663,222 4.3% Two or more races 251,618 0.6% Other race alone 135,777 0.3% Native Hawaiian and Other 103,030 0.3% American Indian alone
Income and house value in Walnut Park Median household income in 2022 $51,686 White non-Hispanic householders$145,416 Black householders$61,412 American Indian and Alaska Native householders$88,323 Asian householders$149,179 Native Hawaiian and other Pacific Islander householders$91,109 Some other race householders$117,390 Two or more races householders$71,153 Hispanic or Latino race householdersMedian 2022 house value $593,883 White Non-Hispanic householders$674,868 Black or African American householders$503,901 American Indian or Alaska Native householders $404,920 Asian householders$305,940 Native Hawaiian and other Pacific Islander householders$591,724 Some other race householders$626,277 Two or more races householders$598,562 Hispanic or Latino householders
Median age by race in Walnut Park
38.1 Median age for White residents38.1 38.0 6.7 Median age for Black or African American residents41.4 Median age for American Indian / Alaska Native residents33.2 Median age for Asian residents36.8 22.4 60.8 Median age for Native Hawaiian / Pacific Islander residents37.8 Median age for Other race residents35.8 39.0 21.0 Median age for Two or more races residents63.2 17.9 38.8 Median age for White alone residents39.2 34.9 38.0 Median age for Hispanic or Latino residents37.2 38.1
Owner/renter occupied households by race in Walnut Park
House owners and renters - White residents 1,294 52.9% Owner occupied1,150 47.1% Renter occupiedHouse owners and renters - Black or African American residents 7 56.1% Owner occupied6 43.9% Renter occupiedHouse owners and renters - American Indian / Alaska Native residents 19 100.0% Renter occupiedHouse owners and renters - Asian residents 44 82.2% Owner occupied10 17.8% Renter occupiedHouse owners and renters - Other race residents 689 66.1% Owner occupied354 33.9% Renter occupiedHouse owners and renters - Two or more races residents 55 100.0% Owner occupiedHouse owners and renters - White alone residents 41 100.0% Owner occupiedHouse owners and renters - Hispanic or Latino residents 2,226 56.1% Owner occupied1,743 43.9% Renter occupied
Language usage in Walnut Park
English speakers - Total 6.2% of residents of Walnut Park speak English at home.
90.8% of residents speak Spanish at home 7,204 52.0% Speak English very well6,641 48.0% Speak English less than very well1.0% of residents speak other language at home 127 83.6% Speak English very well25 16.4% Speak English less than very well
English speakers - Born in the United States 40.6% of residents of Walnut Park speak English at home.
59.4% of residents speak Spanish at home 135 83.9% Speak English very well26 16.1% Speak English less than very well
English speakers - Native, born elsewhere 22.4% of residents of Walnut Park speak English at home.
20.4% of residents speak Spanish at home 10 100.0% Speak English very well51.0% of residents speak other language at home 25 100.0% Speak English very well
English speakers - Foreign-born 1.3% of residents of Walnut Park speak English at home.
93.5% of residents speak Spanish at home 1,259 17.9% Speak English very well5,781 82.1% Speak English less than very well0.9% of residents speak other language at home 41 62.1% Speak English very well25 37.9% Speak English less than very well
White (Caucasian) - Speak only English Native:
11.8% (548)Foreign-born:
1.8% (68)
White (Caucasian) - Speak another language Native:
69.4% (3,221)Foreign-born:
93.6% (3,552)
American Indian / Alaska Native - Speak another language Native:
92.4% (29)Foreign-born:
99.6% (27)
Asian - Speak another language Native:
96.1% (59)Foreign-born:
98.8% (72)
Other race - Speak only English Native:
10.2% (240)Foreign-born:
1.1% (20)
Other race - Speak another language Native:
86.7% (2,040)Foreign-born:
97.7% (1,837)
White alone - Speak only English Native:
58.7% (86)Foreign-born:
33.9% (6)
White alone - Speak another language Native:
43.1% (63)Foreign-born:
65.7% (11)
Hispanic or Latino - Speak only English Native:
10.6% (835)Foreign-born:
1.5% (103)
Hispanic or Latino - Speak another language Native:
86.6% (6,858)Foreign-born:
97.6% (6,928)
Foreign-born residents in Walnut Park 7,700 residents are foreign born (47.4% Latin America ).
This city:
48.6%California:
100.0%
Marital status for residents in Walnut Park Marital status - White (Caucasian) population 15 years and over
Males 50.4% Never married40.8% Now married2.8% Separated1.5% Widowed4.5% DivorcedFemales 43.7% Never married40.6% Now married2.1% Separated8.2% Widowed5.5% DivorcedWomen who gave birth in the past 12 months Now married:
78.3% (79)Unmarried:
21.7% (22)
Women who did not give birth in the past 12 months Now married:
36.0% (785)Unmarried:
64.0% (1,397)
Marital status - Black or African American population 15 years and over
Males 0.0% Never married100.0% Now married0.0% Separated0.0% Widowed0.0% DivorcedFemales 0.0% Never married100.0% Now married0.0% Separated0.0% Widowed0.0% DivorcedWomen who did not give birth in the past 12 months Now married:
100.0% (6)Unmarried:
0.0% (0)
Marital status - American Indian / Alaska Native population 15 years and over
Males 100.0% Never married0.0% Now married0.0% Separated0.0% Widowed0.0% DivorcedFemales 40.9% Never married0.0% Now married0.0% Separated59.1% Widowed0.0% DivorcedWomen who did not give birth in the past 12 months Now married:
0.0% (0)Unmarried:
100.0% (13)
Marital status - Asian population 15 years and over
Males 0.0% Never married100.0% Now married0.0% Separated0.0% Widowed0.0% DivorcedFemales 63.2% Never married36.8% Now married0.0% Separated0.0% Widowed0.0% DivorcedWomen who did not give birth in the past 12 months Now married:
31.4% (22)Unmarried:
68.6% (48)
Marital status - Other race population 15 years and over
Males 45.4% Never married39.6% Now married4.2% Separated3.3% Widowed7.5% DivorcedFemales 44.9% Never married40.1% Now married3.1% Separated4.6% Widowed7.2% DivorcedWomen who gave birth in the past 12 months Now married:
100.0% (22)Unmarried:
0.0% (0)
Women who did not give birth in the past 12 months Now married:
31.1% (331)Unmarried:
68.9% (732)
Marital status - Two or more races population 15 years and over
Males 37.8% Never married62.2% Now married0.0% Separated0.0% Widowed0.0% DivorcedFemales 60.0% Never married40.0% Now married0.0% Separated0.0% Widowed0.0% DivorcedWomen who did not give birth in the past 12 months Now married:
0.0% (0)Unmarried:
100.0% (18)
Marital status - White alone, not Hispanic / Latino population 15 years and over
Males 34.0% Never married48.5% Now married0.0% Separated4.9% Widowed12.6% DivorcedFemales 20.8% Never married56.3% Now married0.0% Separated22.9% Widowed0.0% DivorcedWomen who did not give birth in the past 12 months Now married:
72.2% (12)Unmarried:
27.8% (5)
Marital status - Hispanic or Latino population 15 years and over
Males 49.3% Never married40.7% Now married3.3% Separated1.9% Widowed4.9% DivorcedFemales 44.3% Never married40.1% Now married2.4% Separated7.3% Widowed5.9% DivorcedWomen who gave birth in the past 12 months Now married:
81.2% (121)Unmarried:
18.8% (28)
Women who did not give birth in the past 12 months Now married:
34.4% (1,296)Unmarried:
65.6% (2,473)
Ancestries in Walnut Park
66 0.5% American8 0.06% Irish5 0.04% Italian4 0.03% British4 0.03% French Canadian4 0.03% Greek3 0.02% Scotch-Irish
Children Nativity (place of birth) in Walnut Park
Children under 6 years - Living with two parents Both parents native 165 100.0% NativeBoth parents foreign-born 124 100.0% NativeOne native, one foreign-born parent 161 100.0% NativeChildren under 6 years - Living with one parent Native parent 192 100.0% NativeForeign-born parent 178 100.0% NativeChildren 6 to 17 years - Living with two parents Both parents native 405 100.0% NativeBoth parents foreign-born 617 96.3% Native23 3.7% Foreign-bornOne native, one foreign-born parent 226 100.0% NativeChildren 6 to 17 years - Living with one parent Native parent 400 100.0% NativeForeign-born parent 708 52.9% Native630 47.1% Foreign-born
Grandparents responsible for own grandchildren in Walnut Park
Grandparents (30 to 59 years) White / Caucasian 6 4.4% Responsible for grandchildren126 95.6% Not responsible for grandchildrenOther race 9 23.0% Responsible for grandchildren30 77.0% Not responsible for grandchildrenHispanic or Latino 16 7.0% Responsible for grandchildren220 93.0% Not responsible for grandchildrenGrandparents (60 years and over) White / Caucasian 26 8.2% Responsible for grandchildren292 91.8% Not responsible for grandchildrenOther race 139 100.0% Not responsible for grandchildrenHispanic or Latino 37 7.0% Responsible for grandchildren490 93.0% Not responsible for grandchildren