Races in Warminster Heights, Pennsylvania (PA) Detailed Stats
Data:
Races - White alone (%)
Races - White alone (% change since 2000)
Races - Black alone (%)
Races - Black alone (% change since 2000)
Races - American Indian alone (%)
Races - American Indian alone (% change since 2000)
Races - Asian alone (%)
Races - Asian alone (% change since 2000)
Races - Hispanic (%)
Races - Hispanic (% change since 2000)
Races - Native Hawaiian and Other Pacific Islander alone (%)
Races - Native Hawaiian and Other Pacific Islander alone (% change since 2000)
Races - Two or more races(%)
Races - Two or more races(% change since 2000)
Races - Other race alone (%)
Races - Other race alone (% change since 2000)
Racial diversity
Place of birth - Born in state of residence (%)
Place of birth - Born in state of residence (%) - White
Place of birth - Born in state of residence (%) - Black or African American
Place of birth - Born in state of residence (%) - Asian
Place of birth - Born in state of residence (%) - Hispanic or Latino
Place of birth - Born in state of residence (%) - American Indian and Alaska Native
Place of birth - Born in state of residence (%) - Multirace
Place of birth - Born in state of residence (%) - Other Race
Place of birth - Born in other state (%)
Place of birth - Born in other state (%) - White
Place of birth - Born in other state (%) - Black or African American
Place of birth - Born in other state (%) - Asian
Place of birth - Born in other state (%) - Hispanic or Latino
Place of birth - Born in other state (%) - American Indian and Alaska Native
Place of birth - Born in other state (%) - Multirace
Place of birth - Born in other state (%) - Other Race
Place of birth - Native, outside of US (%)
Place of birth - Native, outside of US (%) - White
Place of birth - Native, outside of US (%) - Black or African American
Place of birth - Native, outside of US (%) - Asian
Place of birth - Native, outside of US (%) - Hispanic or Latino
Place of birth - Native, outside of US (%) - American Indian and Alaska Native
Place of birth - Native, outside of US (%) - Multirace
Place of birth - Native, outside of US (%) - Other Race
Place of birth - Foreign born (%)
Place of birth - Foreign born (%) - White
Place of birth - Foreign born (%) - Black or African American
Place of birth - Foreign born (%) - Asian
Place of birth - Foreign born (%) - Hispanic or Latino
Place of birth - Foreign born (%) - American Indian and Alaska Native
Place of birth - Foreign born (%) - Multirace
Place of birth - Foreign born (%) - Other Race
Residents speaking English at home (%)
Residents speaking English at home - Born in the United States (%)
Residents speaking English at home - Native, born elsewhere (%)
Residents speaking English at home - Foreign born (%)
Residents speaking Spanish at home (%)
Residents speaking Spanish at home - Born in the United States (%)
Residents speaking Spanish at home - Native, born elsewhere (%)
Residents speaking Spanish at home - Foreign born (%)
Residents speaking other language at home (%)
Residents speaking other language at home - Born in the United States (%)
Residents speaking other language at home - Native, born elsewhere (%)
Residents speaking other language at home - Foreign born (%)
Marital status - Never married (%)
Marital status - Now married (%)
Marital status - Separated (%)
Marital status - Widowed (%)
Marital status - Divorced (%)
Ancestries Reported - Arab (%)
Ancestries Reported - Czech (%)
Ancestries Reported - Danish (%)
Ancestries Reported - Dutch (%)
Ancestries Reported - English (%)
Ancestries Reported - French (%)
Ancestries Reported - French Canadian (%)
Ancestries Reported - German (%)
Ancestries Reported - Greek (%)
Ancestries Reported - Hungarian (%)
Ancestries Reported - Irish (%)
Ancestries Reported - Italian (%)
Ancestries Reported - Lithuanian (%)
Ancestries Reported - Norwegian (%)
Ancestries Reported - Polish (%)
Ancestries Reported - Portuguese (%)
Ancestries Reported - Russian (%)
Ancestries Reported - Scotch-Irish (%)
Ancestries Reported - Scottish (%)
Ancestries Reported - Slovak (%)
Ancestries Reported - Subsaharan African (%)
Ancestries Reported - Swedish (%)
Ancestries Reported - Swiss (%)
Ancestries Reported - Ukrainian (%)
Ancestries Reported - United States (%)
Ancestries Reported - Welsh (%)
Ancestries Reported - West Indian (%)
Ancestries Reported - Other (%)
Geographical mobility - Same house 1 year ago (%)
Geographical mobility - Same house 1 year ago (%) - White
Geographical mobility - Same house 1 year ago (%) - Black or African American
Geographical mobility - Same house 1 year ago (%) - Asian
Geographical mobility - Same house 1 year ago (%) - Hispanic or Latino
Geographical mobility - Same house 1 year ago (%) - American Indian and Alaska Native
Geographical mobility - Same house 1 year ago (%) - Multirace
Geographical mobility - Same house 1 year ago (%) - Other Race
Geographical mobility - Moved within same county (%)
Geographical mobility - Moved within same county (%) - White
Geographical mobility - Moved within same county (%) - Black or African American
Geographical mobility - Moved within same county (%) - Asian
Geographical mobility - Moved within same county (%) - Hispanic or Latino
Geographical mobility - Moved within same county (%) - American Indian and Alaska Native
Geographical mobility - Moved within same county (%) - Multirace
Geographical mobility - Moved within same county (%) - Other Race
Geographical mobility - Moved from different county within same state (%)
Geographical mobility - Moved from different county within same state (%) - White
Geographical mobility - Moved from different county within same state (%) - Black or African American
Geographical mobility - Moved from different county within same state (%) - Asian
Geographical mobility - Moved from different county within same state (%) - Hispanic or Latino
Geographical mobility - Moved from different county within same state (%) - American Indian and Alaska Native
Geographical mobility - Moved from different county within same state (%) - Multirace
Geographical mobility - Moved from different county within same state (%) - Other Race
Geographical mobility - Moved from different state (%)
Geographical mobility - Moved from different state (%) - White
Geographical mobility - Moved from different state (%) - Black or African American
Geographical mobility - Moved from different state (%) - Asian
Geographical mobility - Moved from different state (%) - Hispanic or Latino
Geographical mobility - Moved from different state (%) - American Indian and Alaska Native
Geographical mobility - Moved from different state (%) - Multirace
Geographical mobility - Moved from different state (%) - Other Race
Geographical mobility - Moved from abroad (%)
Geographical mobility - Moved from abroad (%) - White
Geographical mobility - Moved from abroad (%) - Black or African American
Geographical mobility - Moved from abroad (%) - Asian
Geographical mobility - Moved from abroad (%) - Hispanic or Latino
Geographical mobility - Moved from abroad (%) - American Indian and Alaska Native
Geographical mobility - Moved from abroad (%) - Multirace
Geographical mobility - Moved from abroad (%) - Other Race
Place of birth for the foreign-born population - Ireland (%)
Place of birth for the foreign-born population - Denmark (%)
Place of birth for the foreign-born population - Norway (%)
Place of birth for the foreign-born population - Sweden (%)
Place of birth for the foreign-born population - United Kingdom (%)
Place of birth for the foreign-born population - England (%)
Place of birth for the foreign-born population - Scotland (%)
Place of birth for the foreign-born population - Other Northern Europe (%)
Place of birth for the foreign-born population - Austria (%)
Place of birth for the foreign-born population - Belgium (%)
Place of birth for the foreign-born population - France (%)
Place of birth for the foreign-born population - Germany (%)
Place of birth for the foreign-born population - Netherlands (%)
Place of birth for the foreign-born population - Switzerland (%)
Place of birth for the foreign-born population - Other Western Europe (%)
Place of birth for the foreign-born population - Greece (%)
Place of birth for the foreign-born population - Italy (%)
Place of birth for the foreign-born population - Portugal (%)
Place of birth for the foreign-born population - Spain (%)
Place of birth for the foreign-born population - Other Southern Europe (%)
Place of birth for the foreign-born population - Albania (%)
Place of birth for the foreign-born population - Belarus (%)
Place of birth for the foreign-born population - Bosnia and Herzegovina (%)
Place of birth for the foreign-born population - Bulgaria (%)
Place of birth for the foreign-born population - Croatia (%)
Place of birth for the foreign-born population - Czechoslovakia (%)
Place of birth for the foreign-born population - Hungary (%)
Place of birth for the foreign-born population - Latvia (%)
Place of birth for the foreign-born population - Lithuania (%)
Place of birth for the foreign-born population - North Macedonia (Macedonia) (%)
Place of birth for the foreign-born population - Moldova (%)
Place of birth for the foreign-born population - Poland (%)
Place of birth for the foreign-born population - Romania (%)
Place of birth for the foreign-born population - Russia (%)
Place of birth for the foreign-born population - Serbia (%)
Place of birth for the foreign-born population - Ukraine (%)
Place of birth for the foreign-born population - Other Eastern Europe (%)
Place of birth for the foreign-born population - China (%)
Place of birth for the foreign-born population - Hong Kong (%)
Place of birth for the foreign-born population - Taiwan (%)
Place of birth for the foreign-born population - Japan (%)
Place of birth for the foreign-born population - Korea (%)
Place of birth for the foreign-born population - Other Eastern Asia (%)
Place of birth for the foreign-born population - Afghanistan (%)
Place of birth for the foreign-born population - Bangladesh (%)
Place of birth for the foreign-born population - India (%)
Place of birth for the foreign-born population - Iran (%)
Place of birth for the foreign-born population - Kazakhstan (%)
Place of birth for the foreign-born population - Nepal (%)
Place of birth for the foreign-born population - Pakistan (%)
Place of birth for the foreign-born population - Sri Lanka (%)
Place of birth for the foreign-born population - Uzbekistan (%)
Place of birth for the foreign-born population - Other South Central Asia (%)
Place of birth for the foreign-born population - Burma (%)
Place of birth for the foreign-born population - Cambodia (%)
Place of birth for the foreign-born population - Indonesia (%)
Place of birth for the foreign-born population - Laos (%)
Place of birth for the foreign-born population - Malaysia (%)
Place of birth for the foreign-born population - Philippines (%)
Place of birth for the foreign-born population - Singapore (%)
Place of birth for the foreign-born population - Thailand (%)
Place of birth for the foreign-born population - Vietnam (%)
Place of birth for the foreign-born population - Other South Eastern Asia (%)
Place of birth for the foreign-born population - Armenia (%)
Place of birth for the foreign-born population - Iraq (%)
Place of birth for the foreign-born population - Israel (%)
Place of birth for the foreign-born population - Jordan (%)
Place of birth for the foreign-born population - Kuwait (%)
Place of birth for the foreign-born population - Lebanon (%)
Place of birth for the foreign-born population - Saudi Arabia (%)
Place of birth for the foreign-born population - Syria (%)
Place of birth for the foreign-born population - Turkey (%)
Place of birth for the foreign-born population - Yemen (%)
Place of birth for the foreign-born population - Other Western Asia (%)
Place of birth for the foreign-born population - Eritrea (%)
Place of birth for the foreign-born population - Ethiopia (%)
Place of birth for the foreign-born population - Kenya (%)
Place of birth for the foreign-born population - Somalia (%)
Place of birth for the foreign-born population - Uganda (%)
Place of birth for the foreign-born population - Zimbabwe (%)
Place of birth for the foreign-born population - Other Eastern Africa (%)
Place of birth for the foreign-born population - Cameroon (%)
Place of birth for the foreign-born population - Congo (%)
Place of birth for the foreign-born population - Democratic Republic of Congo (Zaire) (%)
Place of birth for the foreign-born population - Other Middle Africa (%)
Place of birth for the foreign-born population - Egypt (%)
Place of birth for the foreign-born population - Morocco (%)
Place of birth for the foreign-born population - Sudan (%)
Place of birth for the foreign-born population - Other Northern Africa (%)
Place of birth for the foreign-born population - South Africa (%)
Place of birth for the foreign-born population - Other Southern Africa (%)
Place of birth for the foreign-born population - Cabo Verde (%)
Place of birth for the foreign-born population - Ghana (%)
Place of birth for the foreign-born population - Liberia (%)
Place of birth for the foreign-born population - Nigeria (%)
Place of birth for the foreign-born population - Senegal (%)
Place of birth for the foreign-born population - Sierra Leone (%)
Place of birth for the foreign-born population - Other Western Africa (%)
Place of birth for the foreign-born population - Australia (%)
Place of birth for the foreign-born population - New Zealand (%)
Place of birth for the foreign-born population - Fiji (%)
Place of birth for the foreign-born population - Micronesia (%)
Place of birth for the foreign-born population - Bahamas (%)
Place of birth for the foreign-born population - Barbados (%)
Place of birth for the foreign-born population - Cuba (%)
Place of birth for the foreign-born population - Dominica (%)
Place of birth for the foreign-born population - Dominican Republic (%)
Place of birth for the foreign-born population - Grenada (%)
Place of birth for the foreign-born population - Haiti (%)
Place of birth for the foreign-born population - Jamaica (%)
Place of birth for the foreign-born population - St. Vincent and the Grenadines (%)
Place of birth for the foreign-born population - Trinidad and Tobago (%)
Place of birth for the foreign-born population - West Indies (%)
Place of birth for the foreign-born population - Other Caribbean (%)
Place of birth for the foreign-born population - Belize (%)
Place of birth for the foreign-born population - Costa Rica (%)
Place of birth for the foreign-born population - El Salvador (%)
Place of birth for the foreign-born population - Guatemala (%)
Place of birth for the foreign-born population - Honduras (%)
Place of birth for the foreign-born population - Mexico (%)
Place of birth for the foreign-born population - Nicaragua (%)
Place of birth for the foreign-born population - Panama (%)
Place of birth for the foreign-born population - Other Central America (%)
Place of birth for the foreign-born population - Argentina (%)
Place of birth for the foreign-born population - Bolivia (%)
Place of birth for the foreign-born population - Brazil (%)
Place of birth for the foreign-born population - Chile (%)
Place of birth for the foreign-born population - Colombia (%)
Place of birth for the foreign-born population - Ecuador (%)
Place of birth for the foreign-born population - Guyana (%)
Place of birth for the foreign-born population - Peru (%)
Place of birth for the foreign-born population - Uruguay (%)
Place of birth for the foreign-born population - Venezuela (%)
Place of birth for the foreign-born population - Other South America (%)
Place of birth for the foreign-born population - Canada (%)
Place of birth for the foreign-born population - Other Northern America (%)
Place of birth for the foreign-born population - Other (%)
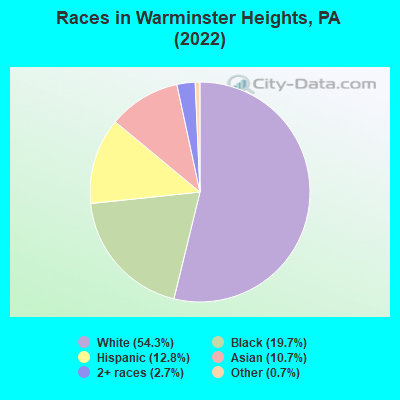
According to 2022 data, the most numerous races in Warminster Heights, PA are White alone (2,108 residents), Black alone (766 residents), and Hispanic (497 residents). 72.5% of Warminster Heights residents speak English at home. 21.6% of Warminster Heights, PA residents are foreign-born (6.3% born in Asia, 5.9% born in Africa, 5.3% born in Europe, 3.2% born in Latin America), which is 67.6% greater than the foreign-born rate of 7.0% across the entire state of Pennsylvania.
Race distribution in Warminster Heights
2000 2022
10,322,455 84.1% White alone 1,202,437 9.8% Black alone 394,088 3.2% Hispanic 218,296 1.8% Asian alone 113,097 0.9% Two or more races 13,086 0.1% Other race alone 14,904 0.1% American Indian alone 2,691 0.02% Native Hawaiian and Other
9,487,228 73.1% White alone 1,311,581 10.1% Black alone 1,115,997 8.6% Hispanic 493,942 3.8% Two or more races 487,124 3.8% Asian alone 63,582 0.5% Other race alone 10,130 0.08% American Indian alone 2,424 0.02% Native Hawaiian and Other
Income and house value in Warminster Heights Median household income in 2022 $64,916 White non-Hispanic householders$50,059 Black householders$33,965 Asian householders$92,425 Some other race householders$63,489 Hispanic or Latino race householdersMedian 2022 house value $368,274 White Non-Hispanic householders$260,817 Black or African American householders$277,248 Some other race householders$717,247 Two or more races householders$296,810 Hispanic or Latino householders
Median age by race in Warminster Heights
49.8 Median age for White residents48.8 50.2 32.0 Median age for Black or African American residents12.7 39.7 -674,382,715.4 Median age for American Indian / Alaska Native residents-668,138,336.3 -858,283,432.3 43.0 Median age for Asian residents47.2 42.5 -680,432,644.4 Median age for Native Hawaiian / Pacific Islander residents-649,523,808.9 -747,474,746.7 34.9 Median age for Other race residents32.1 37.2 48.8 Median age for Two or more races residents31.6 48.6 50.9 Median age for White alone residents49.6 53.2 35.1 Median age for Hispanic or Latino residents26.8 34.0
Owner/renter occupied households by race in Warminster Heights
House owners and renters - White residents 330 28.6% Owner occupied822 71.4% Renter occupiedHouse owners and renters - Black or African American residents 15 4.6% Owner occupied307 95.4% Renter occupiedHouse owners and renters - Asian residents 29 12.6% Owner occupied202 87.4% Renter occupiedHouse owners and renters - Other race residents 52 59.1% Owner occupied36 40.9% Renter occupiedHouse owners and renters - Two or more races residents 63 100.0% Renter occupiedHouse owners and renters - White alone residents 332 29.5% Owner occupied794 70.5% Renter occupiedHouse owners and renters - Hispanic or Latino residents 50 31.4% Owner occupied109 68.6% Renter occupied
Language usage in Warminster Heights
English speakers - Total 72.5% of residents of Warminster Heights speak English at home.
8.3% of residents speak Spanish at home 219 74.0% Speak English very well77 26.0% Speak English less than very well20.0% of residents speak other language at home 366 51.0% Speak English very well351 49.0% Speak English less than very well
English speakers - Born in the United States 89.9% of residents of Warminster Heights speak English at home.
9.7% of residents speak Spanish at home 46 100.0% Speak English very well
English speakers - Native, born elsewhere 9.0% of residents of Warminster Heights speak English at home.
62.0% of residents speak Spanish at home 37 59.7% Speak English very well25 40.3% Speak English less than very well
English speakers - Foreign-born 17.0% of residents of Warminster Heights speak English at home.
5.4% of residents speak Spanish at home 11 24.4% Speak English very well34 75.6% Speak English less than very well78.3% of residents speak other language at home 300 45.9% Speak English very well354 54.1% Speak English less than very well
White (Caucasian) - Speak only English Native:
97.2% (1,826)Foreign-born:
11.9% (32)
White (Caucasian) - Speak another language Native:
2.6% (50)Foreign-born:
88.7% (241)
Black or African American - Speak only English Native:
94.2% (376)Foreign-born:
13.5% (24)
Black or African American - Speak another language Native:
5.5% (22)Foreign-born:
100.0% (176)
Asian - Speak only English Native:
62.7% (96)Foreign-born:
9.5% (26)
Asian - Speak another language Native:
38.4% (59)Foreign-born:
90.3% (248)
Other race - Speak only English Native:
19.1% (47)Foreign-born:
100.0% (49)
Other race - Speak another language Native:
94.9% (236)Foreign-born:
27.0% (13)
Two or more races - Speak only English Native:
78.9% (115)Foreign-born:
87.6% (30)
White alone - Speak only English Native:
98.1% (1,711)Foreign-born:
12.7% (33)
White alone - Speak another language Native:
2.0% (34)Foreign-born:
88.7% (227)
Hispanic or Latino - Speak only English Native:
42.9% (181)Foreign-born:
30.9% (20)
Hispanic or Latino - Speak another language Native:
58.5% (247)Foreign-born:
73.4% (48)
Foreign-born residents in Warminster Heights 838 residents are foreign born (6.3% Asia , 5.9% Africa , 5.3% Europe , 3.2% Latin America ).
This city:
21.6%Pennsylvania:
7.3%
Marital status for residents in Warminster Heights Marital status - White (Caucasian) population 15 years and over
Males 33.7% Never married53.2% Now married0.0% Separated1.2% Widowed11.9% DivorcedFemales 27.2% Never married31.7% Now married3.4% Separated14.7% Widowed23.1% DivorcedWomen who gave birth in the past 12 months Now married:
100.0% (28)Unmarried:
0.0% (0)
Women who did not give birth in the past 12 months Now married:
29.5% (145)Unmarried:
70.5% (348)
Marital status - Black or African American population 15 years and over
Males 16.9% Never married61.0% Now married22.1% Separated0.0% Widowed0.0% DivorcedFemales 54.6% Never married24.8% Now married0.0% Separated8.4% Widowed12.2% DivorcedWomen who gave birth in the past 12 months Now married:
100.0% (55)Unmarried:
0.0% (0)
Women who did not give birth in the past 12 months Now married:
17.6% (25)Unmarried:
82.4% (117)
Marital status - Asian population 15 years and over
Males 35.9% Never married63.1% Now married0.0% Separated1.0% Widowed0.0% DivorcedFemales 30.2% Never married61.5% Now married0.0% Separated8.3% Widowed0.0% DivorcedWomen who did not give birth in the past 12 months Now married:
59.7% (81)Unmarried:
40.3% (55)
Marital status - Other race population 15 years and over
Males 53.7% Never married46.2% Now married0.0% Separated0.0% Widowed0.0% DivorcedFemales 38.8% Never married39.6% Now married0.0% Separated6.0% Widowed15.7% DivorcedWomen who did not give birth in the past 12 months Now married:
46.9% (60)Unmarried:
53.1% (68)
Marital status - Two or more races population 15 years and over
Males 88.7% Never married11.3% Now married0.0% Separated0.0% Widowed0.0% DivorcedFemales 34.6% Never married22.2% Now married0.0% Separated0.0% Widowed43.2% DivorcedWomen who did not give birth in the past 12 months Now married:
39.1% (22)Unmarried:
60.9% (34)
Marital status - White alone, not Hispanic / Latino population 15 years and over
Males 29.1% Never married56.9% Now married0.0% Separated1.3% Widowed12.7% DivorcedFemales 25.5% Never married32.5% Now married3.4% Separated15.0% Widowed23.6% DivorcedWomen who gave birth in the past 12 months Now married:
100.0% (28)Unmarried:
0.0% (0)
Women who did not give birth in the past 12 months Now married:
31.1% (147)Unmarried:
68.9% (326)
Marital status - Hispanic or Latino population 15 years and over
Males 73.4% Never married26.6% Now married0.0% Separated0.0% Widowed0.0% DivorcedFemales 50.2% Never married30.3% Now married0.0% Separated0.0% Widowed19.4% DivorcedWomen who did not give birth in the past 12 months Now married:
33.6% (55)Unmarried:
66.4% (108)
Ancestries in Warminster Heights
211 9.9% Irish135 6.4% African133 6.3% German111 5.2% American93 4.4% English86 4.0% Moroccan80 3.8% Ukrainian63 3.0% Ghanaian50 2.4% Polish42 2.0% Haitian34 1.6% Italian27 1.3% Jamaican17 0.8% Latvian15 0.7% Greek13 0.6% European13 0.6% Scottish10 0.5% Albanian10 0.5% West Indian9 0.4% French9 0.4% Pennsylvania German9 0.4% Russian9 0.4% Serbian9 0.4% Trinidadian and Tobagonian
Children Nativity (place of birth) in Warminster Heights
Children under 6 years - Living with two parents Both parents foreign-born 216 100.0% NativeOne native, one foreign-born parent 11 100.0% NativeChildren under 6 years - Living with one parent Native parent 76 100.0% NativeForeign-born parent 18 100.0% NativeChildren 6 to 17 years - Living with two parents Both parents native 110 100.0% NativeBoth parents foreign-born 28 100.0% NativeChildren 6 to 17 years - Living with one parent Native parent 225 100.0% NativeForeign-born parent 29 48.7% Native30 51.3% Foreign-born
Grandparents responsible for own grandchildren in Warminster Heights
Grandparents (30 to 59 years) Two or more races 18 100.0% Responsible for grandchildren
Grandparents (60 years and over)