Races in Warren South, Pennsylvania (PA) Detailed Stats
Ancestries, Foreign-born residents, place of birth

Discuss Warren South, Pennsylvania races on our local forum with over 2,400,000 registered users
2.4% of Warren South, PA residents are foreign-born (1.4% born in Europe, 0.7% born in Asia, 0.4% born in North America), which is 188.9% less than the foreign-born rate of 7.0% across the entire state of Pennsylvania.
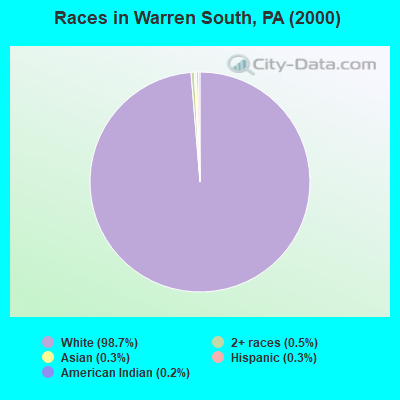
Race distribution in Warren South

- 1,62998.7%White alone
- 80.5%Two or more races
- 50.3%Hispanic
- 50.3%Asian alone
- 30.2%American Indian alone
- 10.06%Black alone
2000
2022
-
- 10,322,45584.1%White alone
- 1,202,4379.8%Black alone
- 394,0883.2%Hispanic
- 218,2961.8%Asian alone
- 113,0970.9%Two or more races
- 13,0860.1%Other race alone
- 14,9040.1%American Indian alone
- 2,6910.02%Native Hawaiian and Other
Pacific Islander alone

-
- 9,487,22873.1%White alone
- 1,311,58110.1%Black alone
- 1,115,9978.6%Hispanic
- 493,9423.8%Two or more races
- 487,1243.8%Asian alone
- 63,5820.5%Other race alone
- 10,1300.08%American Indian alone
- 2,4240.02%Native Hawaiian and Other
Pacific Islander alone

Income and house value in Warren South
- Median household income in 2022
- $76,121White non-Hispanic householders
- $114,879Two or more races householders
- Median 2022 house value
- $168,431White Non-Hispanic householders
- $190,942Two or more races householders
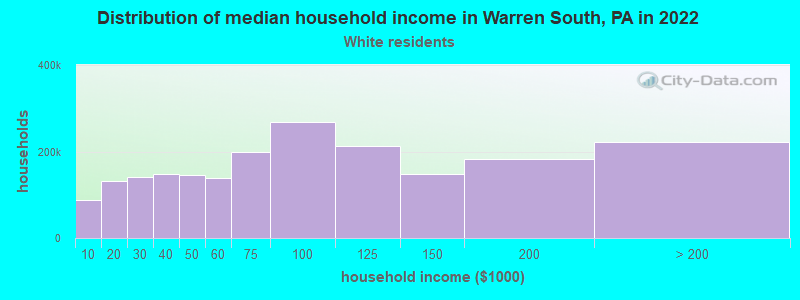
Household income for White non-Hispanic householders
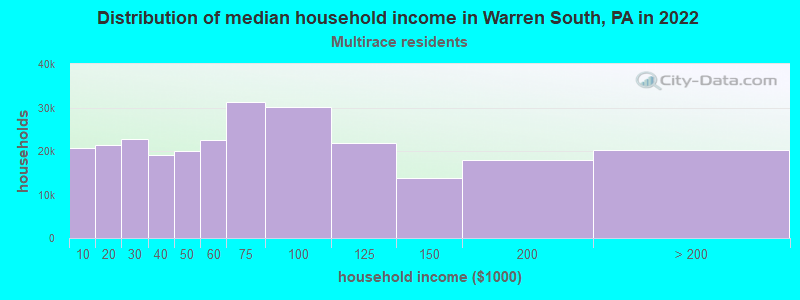
Household income for Two or more races householders
Foreign-born residents in Warren South
40 residents are foreign born (1.4% Europe, 0.7% Asia, 0.4% North America).
| This city: | 2.4% |
| Pennsylvania: | 4.1% |
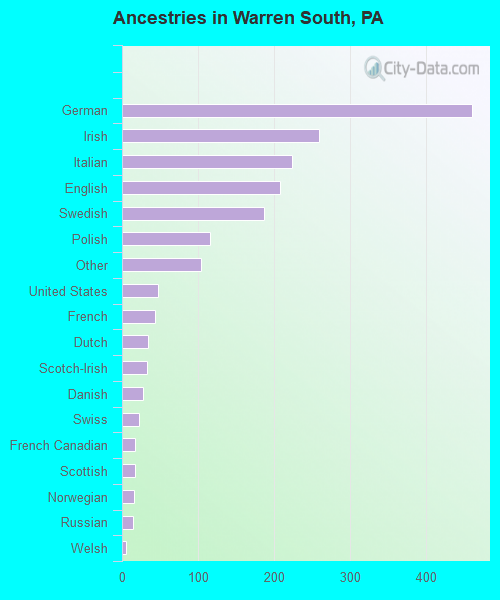
Ancestries in Warren South

- 46024.9%German
- 25914.0%Irish
- 22412.1%Italian
- 20811.3%English
- 18710.1%Swedish
- 1166.3%Polish
- 1045.6%Other
- 482.6%United States
- 442.4%French
- 341.8%Dutch
- 331.8%Scotch-Irish
- 281.5%Danish
- 231.2%Swiss
- 170.9%French Canadian
- 170.9%Scottish
- 160.9%Norwegian
- 150.8%Russian
- 50.3%Welsh
- 40.2%Greek
- 40.2%Ukrainian
Zip codes: 16365.