Races in Wayne, Michigan (MI) Detailed Stats Ancestries, Foreign-born residents, place of birth
Data:
Races - White alone (%)
Races - White alone (% change since 2000)
Races - Black alone (%)
Races - Black alone (% change since 2000)
Races - American Indian alone (%)
Races - American Indian alone (% change since 2000)
Races - Asian alone (%)
Races - Asian alone (% change since 2000)
Races - Hispanic (%)
Races - Hispanic (% change since 2000)
Races - Native Hawaiian and Other Pacific Islander alone (%)
Races - Native Hawaiian and Other Pacific Islander alone (% change since 2000)
Races - Two or more races(%)
Races - Two or more races(% change since 2000)
Races - Other race alone (%)
Races - Other race alone (% change since 2000)
Racial diversity
Place of birth - Born in state of residence (%)
Place of birth - Born in state of residence (%) - White
Place of birth - Born in state of residence (%) - Black or African American
Place of birth - Born in state of residence (%) - Asian
Place of birth - Born in state of residence (%) - Hispanic or Latino
Place of birth - Born in state of residence (%) - American Indian and Alaska Native
Place of birth - Born in state of residence (%) - Multirace
Place of birth - Born in state of residence (%) - Other Race
Place of birth - Born in other state (%)
Place of birth - Born in other state (%) - White
Place of birth - Born in other state (%) - Black or African American
Place of birth - Born in other state (%) - Asian
Place of birth - Born in other state (%) - Hispanic or Latino
Place of birth - Born in other state (%) - American Indian and Alaska Native
Place of birth - Born in other state (%) - Multirace
Place of birth - Born in other state (%) - Other Race
Place of birth - Native, outside of US (%)
Place of birth - Native, outside of US (%) - White
Place of birth - Native, outside of US (%) - Black or African American
Place of birth - Native, outside of US (%) - Asian
Place of birth - Native, outside of US (%) - Hispanic or Latino
Place of birth - Native, outside of US (%) - American Indian and Alaska Native
Place of birth - Native, outside of US (%) - Multirace
Place of birth - Native, outside of US (%) - Other Race
Place of birth - Foreign born (%)
Place of birth - Foreign born (%) - White
Place of birth - Foreign born (%) - Black or African American
Place of birth - Foreign born (%) - Asian
Place of birth - Foreign born (%) - Hispanic or Latino
Place of birth - Foreign born (%) - American Indian and Alaska Native
Place of birth - Foreign born (%) - Multirace
Place of birth - Foreign born (%) - Other Race
Residents speaking English at home (%)
Residents speaking English at home - Born in the United States (%)
Residents speaking English at home - Native, born elsewhere (%)
Residents speaking English at home - Foreign born (%)
Residents speaking Spanish at home (%)
Residents speaking Spanish at home - Born in the United States (%)
Residents speaking Spanish at home - Native, born elsewhere (%)
Residents speaking Spanish at home - Foreign born (%)
Residents speaking other language at home (%)
Residents speaking other language at home - Born in the United States (%)
Residents speaking other language at home - Native, born elsewhere (%)
Residents speaking other language at home - Foreign born (%)
Marital status - Never married (%)
Marital status - Now married (%)
Marital status - Separated (%)
Marital status - Widowed (%)
Marital status - Divorced (%)
Ancestries Reported - Arab (%)
Ancestries Reported - Czech (%)
Ancestries Reported - Danish (%)
Ancestries Reported - Dutch (%)
Ancestries Reported - English (%)
Ancestries Reported - French (%)
Ancestries Reported - French Canadian (%)
Ancestries Reported - German (%)
Ancestries Reported - Greek (%)
Ancestries Reported - Hungarian (%)
Ancestries Reported - Irish (%)
Ancestries Reported - Italian (%)
Ancestries Reported - Lithuanian (%)
Ancestries Reported - Norwegian (%)
Ancestries Reported - Polish (%)
Ancestries Reported - Portuguese (%)
Ancestries Reported - Russian (%)
Ancestries Reported - Scotch-Irish (%)
Ancestries Reported - Scottish (%)
Ancestries Reported - Slovak (%)
Ancestries Reported - Subsaharan African (%)
Ancestries Reported - Swedish (%)
Ancestries Reported - Swiss (%)
Ancestries Reported - Ukrainian (%)
Ancestries Reported - United States (%)
Ancestries Reported - Welsh (%)
Ancestries Reported - West Indian (%)
Ancestries Reported - Other (%)
Geographical mobility - Same house 1 year ago (%)
Geographical mobility - Same house 1 year ago (%) - White
Geographical mobility - Same house 1 year ago (%) - Black or African American
Geographical mobility - Same house 1 year ago (%) - Asian
Geographical mobility - Same house 1 year ago (%) - Hispanic or Latino
Geographical mobility - Same house 1 year ago (%) - American Indian and Alaska Native
Geographical mobility - Same house 1 year ago (%) - Multirace
Geographical mobility - Same house 1 year ago (%) - Other Race
Geographical mobility - Moved within same county (%)
Geographical mobility - Moved within same county (%) - White
Geographical mobility - Moved within same county (%) - Black or African American
Geographical mobility - Moved within same county (%) - Asian
Geographical mobility - Moved within same county (%) - Hispanic or Latino
Geographical mobility - Moved within same county (%) - American Indian and Alaska Native
Geographical mobility - Moved within same county (%) - Multirace
Geographical mobility - Moved within same county (%) - Other Race
Geographical mobility - Moved from different county within same state (%)
Geographical mobility - Moved from different county within same state (%) - White
Geographical mobility - Moved from different county within same state (%) - Black or African American
Geographical mobility - Moved from different county within same state (%) - Asian
Geographical mobility - Moved from different county within same state (%) - Hispanic or Latino
Geographical mobility - Moved from different county within same state (%) - American Indian and Alaska Native
Geographical mobility - Moved from different county within same state (%) - Multirace
Geographical mobility - Moved from different county within same state (%) - Other Race
Geographical mobility - Moved from different state (%)
Geographical mobility - Moved from different state (%) - White
Geographical mobility - Moved from different state (%) - Black or African American
Geographical mobility - Moved from different state (%) - Asian
Geographical mobility - Moved from different state (%) - Hispanic or Latino
Geographical mobility - Moved from different state (%) - American Indian and Alaska Native
Geographical mobility - Moved from different state (%) - Multirace
Geographical mobility - Moved from different state (%) - Other Race
Geographical mobility - Moved from abroad (%)
Geographical mobility - Moved from abroad (%) - White
Geographical mobility - Moved from abroad (%) - Black or African American
Geographical mobility - Moved from abroad (%) - Asian
Geographical mobility - Moved from abroad (%) - Hispanic or Latino
Geographical mobility - Moved from abroad (%) - American Indian and Alaska Native
Geographical mobility - Moved from abroad (%) - Multirace
Geographical mobility - Moved from abroad (%) - Other Race
Place of birth for the foreign-born population - Ireland (%)
Place of birth for the foreign-born population - Denmark (%)
Place of birth for the foreign-born population - Norway (%)
Place of birth for the foreign-born population - Sweden (%)
Place of birth for the foreign-born population - United Kingdom (%)
Place of birth for the foreign-born population - England (%)
Place of birth for the foreign-born population - Scotland (%)
Place of birth for the foreign-born population - Other Northern Europe (%)
Place of birth for the foreign-born population - Austria (%)
Place of birth for the foreign-born population - Belgium (%)
Place of birth for the foreign-born population - France (%)
Place of birth for the foreign-born population - Germany (%)
Place of birth for the foreign-born population - Netherlands (%)
Place of birth for the foreign-born population - Switzerland (%)
Place of birth for the foreign-born population - Other Western Europe (%)
Place of birth for the foreign-born population - Greece (%)
Place of birth for the foreign-born population - Italy (%)
Place of birth for the foreign-born population - Portugal (%)
Place of birth for the foreign-born population - Spain (%)
Place of birth for the foreign-born population - Other Southern Europe (%)
Place of birth for the foreign-born population - Albania (%)
Place of birth for the foreign-born population - Belarus (%)
Place of birth for the foreign-born population - Bosnia and Herzegovina (%)
Place of birth for the foreign-born population - Bulgaria (%)
Place of birth for the foreign-born population - Croatia (%)
Place of birth for the foreign-born population - Czechoslovakia (%)
Place of birth for the foreign-born population - Hungary (%)
Place of birth for the foreign-born population - Latvia (%)
Place of birth for the foreign-born population - Lithuania (%)
Place of birth for the foreign-born population - North Macedonia (Macedonia) (%)
Place of birth for the foreign-born population - Moldova (%)
Place of birth for the foreign-born population - Poland (%)
Place of birth for the foreign-born population - Romania (%)
Place of birth for the foreign-born population - Russia (%)
Place of birth for the foreign-born population - Serbia (%)
Place of birth for the foreign-born population - Ukraine (%)
Place of birth for the foreign-born population - Other Eastern Europe (%)
Place of birth for the foreign-born population - China (%)
Place of birth for the foreign-born population - Hong Kong (%)
Place of birth for the foreign-born population - Taiwan (%)
Place of birth for the foreign-born population - Japan (%)
Place of birth for the foreign-born population - Korea (%)
Place of birth for the foreign-born population - Other Eastern Asia (%)
Place of birth for the foreign-born population - Afghanistan (%)
Place of birth for the foreign-born population - Bangladesh (%)
Place of birth for the foreign-born population - India (%)
Place of birth for the foreign-born population - Iran (%)
Place of birth for the foreign-born population - Kazakhstan (%)
Place of birth for the foreign-born population - Nepal (%)
Place of birth for the foreign-born population - Pakistan (%)
Place of birth for the foreign-born population - Sri Lanka (%)
Place of birth for the foreign-born population - Uzbekistan (%)
Place of birth for the foreign-born population - Other South Central Asia (%)
Place of birth for the foreign-born population - Burma (%)
Place of birth for the foreign-born population - Cambodia (%)
Place of birth for the foreign-born population - Indonesia (%)
Place of birth for the foreign-born population - Laos (%)
Place of birth for the foreign-born population - Malaysia (%)
Place of birth for the foreign-born population - Philippines (%)
Place of birth for the foreign-born population - Singapore (%)
Place of birth for the foreign-born population - Thailand (%)
Place of birth for the foreign-born population - Vietnam (%)
Place of birth for the foreign-born population - Other South Eastern Asia (%)
Place of birth for the foreign-born population - Armenia (%)
Place of birth for the foreign-born population - Iraq (%)
Place of birth for the foreign-born population - Israel (%)
Place of birth for the foreign-born population - Jordan (%)
Place of birth for the foreign-born population - Kuwait (%)
Place of birth for the foreign-born population - Lebanon (%)
Place of birth for the foreign-born population - Saudi Arabia (%)
Place of birth for the foreign-born population - Syria (%)
Place of birth for the foreign-born population - Turkey (%)
Place of birth for the foreign-born population - Yemen (%)
Place of birth for the foreign-born population - Other Western Asia (%)
Place of birth for the foreign-born population - Eritrea (%)
Place of birth for the foreign-born population - Ethiopia (%)
Place of birth for the foreign-born population - Kenya (%)
Place of birth for the foreign-born population - Somalia (%)
Place of birth for the foreign-born population - Uganda (%)
Place of birth for the foreign-born population - Zimbabwe (%)
Place of birth for the foreign-born population - Other Eastern Africa (%)
Place of birth for the foreign-born population - Cameroon (%)
Place of birth for the foreign-born population - Congo (%)
Place of birth for the foreign-born population - Democratic Republic of Congo (Zaire) (%)
Place of birth for the foreign-born population - Other Middle Africa (%)
Place of birth for the foreign-born population - Egypt (%)
Place of birth for the foreign-born population - Morocco (%)
Place of birth for the foreign-born population - Sudan (%)
Place of birth for the foreign-born population - Other Northern Africa (%)
Place of birth for the foreign-born population - South Africa (%)
Place of birth for the foreign-born population - Other Southern Africa (%)
Place of birth for the foreign-born population - Cabo Verde (%)
Place of birth for the foreign-born population - Ghana (%)
Place of birth for the foreign-born population - Liberia (%)
Place of birth for the foreign-born population - Nigeria (%)
Place of birth for the foreign-born population - Senegal (%)
Place of birth for the foreign-born population - Sierra Leone (%)
Place of birth for the foreign-born population - Other Western Africa (%)
Place of birth for the foreign-born population - Australia (%)
Place of birth for the foreign-born population - New Zealand (%)
Place of birth for the foreign-born population - Fiji (%)
Place of birth for the foreign-born population - Micronesia (%)
Place of birth for the foreign-born population - Bahamas (%)
Place of birth for the foreign-born population - Barbados (%)
Place of birth for the foreign-born population - Cuba (%)
Place of birth for the foreign-born population - Dominica (%)
Place of birth for the foreign-born population - Dominican Republic (%)
Place of birth for the foreign-born population - Grenada (%)
Place of birth for the foreign-born population - Haiti (%)
Place of birth for the foreign-born population - Jamaica (%)
Place of birth for the foreign-born population - St. Vincent and the Grenadines (%)
Place of birth for the foreign-born population - Trinidad and Tobago (%)
Place of birth for the foreign-born population - West Indies (%)
Place of birth for the foreign-born population - Other Caribbean (%)
Place of birth for the foreign-born population - Belize (%)
Place of birth for the foreign-born population - Costa Rica (%)
Place of birth for the foreign-born population - El Salvador (%)
Place of birth for the foreign-born population - Guatemala (%)
Place of birth for the foreign-born population - Honduras (%)
Place of birth for the foreign-born population - Mexico (%)
Place of birth for the foreign-born population - Nicaragua (%)
Place of birth for the foreign-born population - Panama (%)
Place of birth for the foreign-born population - Other Central America (%)
Place of birth for the foreign-born population - Argentina (%)
Place of birth for the foreign-born population - Bolivia (%)
Place of birth for the foreign-born population - Brazil (%)
Place of birth for the foreign-born population - Chile (%)
Place of birth for the foreign-born population - Colombia (%)
Place of birth for the foreign-born population - Ecuador (%)
Place of birth for the foreign-born population - Guyana (%)
Place of birth for the foreign-born population - Peru (%)
Place of birth for the foreign-born population - Uruguay (%)
Place of birth for the foreign-born population - Venezuela (%)
Place of birth for the foreign-born population - Other South America (%)
Place of birth for the foreign-born population - Canada (%)
Place of birth for the foreign-born population - Other Northern America (%)
Place of birth for the foreign-born population - Other (%)
Latest news about races in Wayne, MI collected exclusively by city-data.com from local newspapers, TV, and radio stations
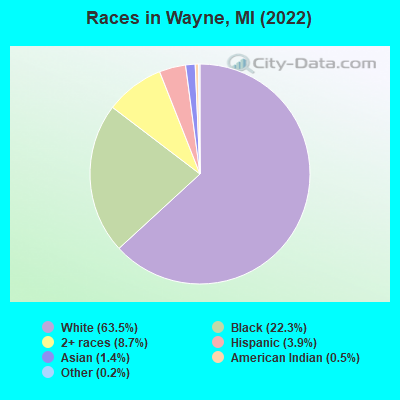
According to 2022 data, the most numerous races in Wayne, MI are White alone (11,009 residents), Black alone (3,866 residents), and Hispanic (683 residents). 93.0% of Wayne residents speak English at home. 5.8% of Wayne, MI residents are foreign-born (1.9% born in Africa, 1.5% born in Asia, 1.0% born in Europe, 0.9% born in Latin America), which is 4.3% less than the foreign-born rate of 6.0% across the entire state of Michigan.
Race distribution in Wayne
2000
2022
7,806,691 78.6% White alone
1,402,047 14.1% Black alone
323,877 3.3% Hispanic
175,311 1.8% Asian alone
163,487 1.6% Two or more races
53,421 0.5% American Indian alone
11,465 0.1% Other race alone
2,145 0.02% Native Hawaiian and Other Pacific Islander alone
7,289,051 72.6% White alone
1,310,464 13.1% Black alone
572,405 5.7% Hispanic
450,031 4.5% Two or more races
335,732 3.3% Asian alone
45,217 0.5% Other race alone
29,011 0.3% American Indian alone
2,207 0.02% Native Hawaiian and Other Pacific Islander alone
Income and house value in Wayne Median household income in 2022 $59,347 White non-Hispanic householders
$38,758 Black householders
$42,589 American Indian and Alaska Native householders
$36,793 Two or more races householders
$59,559 Hispanic or Latino race householders
Median 2022 house value $138,409 White Non-Hispanic householders
$251,493 Black or African American householders
$103,071 American Indian or Alaska Native householders
$155,195 Asian householders
$176,104 Some other race householders
$145,477 Two or more races householders
$156,226 Hispanic or Latino householders
Median age by race in Wayne
44.2 Median age for White residents44.2 Males44.3 Females38.0 Median age for Black or African American residents29.3 Males42.6 Females74.5 Median age for American Indian / Alaska Native residents-795,074,757.3 Males72.1 Females60.8 Median age for Asian residents29.4 Males72.1 Females-934,108,526.2 Median age for Native Hawaiian / Pacific Islander residents-674,772,035.8 Males-699,588,476.7 Females49.6 Median age for Other race residents29.2 Males55.4 Females18.7 Median age for Two or more races residents20.4 Males12.9 Females44.2 Median age for White alone residents44.2 Males44.8 Females31.7 Median age for Hispanic or Latino residents25.1 Males42.9 Females
Owner/renter occupied households by race in Wayne
House owners and renters - White residents 3,468 74.7% Owner occupied1,177 25.3% Renter occupiedHouse owners and renters - Black or African American residents 398 23.2% Owner occupied1,314 76.8% Renter occupiedHouse owners and renters - American Indian / Alaska Native residents 145 100.0% Owner occupiedHouse owners and renters - Asian residents 24 21.2% Owner occupied89 78.8% Renter occupiedHouse owners and renters - Other race residents 66 65.9% Owner occupied34 34.1% Renter occupiedHouse owners and renters - Two or more races residents 313 69.4% Owner occupied138 30.6% Renter occupiedHouse owners and renters - White alone residents 3,435 74.1% Owner occupied1,198 25.9% Renter occupiedHouse owners and renters - Hispanic or Latino residents 166 69.8% Owner occupied72 30.2% Renter occupied
Language usage in Wayne
English speakers - Total 93.0% of residents of Wayne speak English at home.
1.9% of residents speak Spanish at home 134 42.4% Speak English very well182 57.6% Speak English less than very well5.2% of residents speak other language at home 381 44.4% Speak English very well478 55.6% Speak English less than very well
English speakers - Born in the United States 91.9% of residents of Wayne speak English at home.
4.0% of residents speak Spanish at home 26 29.5% Speak English very well62 70.5% Speak English less than very well4.6% of residents speak other language at home 102 100.0% Speak English very well
All residents speak only English at home
English speakers - Foreign-born 16.3% of residents of Wayne speak English at home.
14.9% of residents speak Spanish at home 55 36.2% Speak English very well97 63.8% Speak English less than very well69.3% of residents speak other language at home 255 36.0% Speak English very well453 64.0% Speak English less than very well
White (Caucasian) - Speak only English Native:
99.8% (10,254)Foreign-born:
20.3% (80)
White (Caucasian) - Speak another language Native:
1.3% (129)Foreign-born:
79.8% (315)
Black or African American - Speak only English Native:
98.1% (3,246)Foreign-born:
18.6% (48)
Black or African American - Speak another language Native:
1.6% (52)Foreign-born:
79.7% (205)
American Indian / Alaska Native - Speak another language Native:
16.7% (26)Foreign-born:
100.0% (32)
Asian - Speak only English Native:
26.3% (12)Foreign-born:
18.8% (37)
Asian - Speak another language Native:
75.8% (35)Foreign-born:
82.0% (160)
Other race - Speak another language Native:
25.3% (24)Foreign-born:
100.0% (88)
Two or more races - Speak another language Native:
0.8% (13)Foreign-born:
100.0% (9)
White alone - Speak only English Native:
99.9% (10,223)Foreign-born:
23.1% (82)
White alone - Speak another language Native:
0.7% (72)Foreign-born:
76.6% (271)
Hispanic or Latino - Speak another language Native:
27.1% (136)Foreign-born:
100.0% (153)
Foreign-born residents in Wayne 997 residents are foreign born (1.9% Africa , 1.5% Asia , 1.0% Europe , 0.9% Latin America ).
This city:
5.8%Michigan:
6.9%
Marital status for residents in Wayne Marital status - White (Caucasian) population 15 years and over
Males 38.4% Never married42.8% Now married0.8% Separated2.5% Widowed15.5% DivorcedFemales 32.7% Never married40.1% Now married0.4% Separated7.6% Widowed19.2% DivorcedWomen who gave birth in the past 12 months Now married:
28.1% (17)Unmarried:
71.9% (43)
Women who did not give birth in the past 12 months Now married:
33.0% (773)Unmarried:
67.0% (1,566)
Marital status - Black or African American population 15 years and over
Males 43.0% Never married46.4% Now married0.1% Separated1.4% Widowed9.2% DivorcedFemales 50.4% Never married24.4% Now married0.5% Separated6.3% Widowed18.4% DivorcedWomen who gave birth in the past 12 months Now married:
35.1% (25)Unmarried:
64.9% (46)
Women who did not give birth in the past 12 months Now married:
30.1% (309)Unmarried:
69.9% (718)
Marital status - American Indian / Alaska Native population 15 years and over
Males 0.0% Never married100.0% Now married0.0% Separated0.0% Widowed0.0% DivorcedFemales 6.5% Never married93.5% Now married0.0% Separated0.0% Widowed0.0% DivorcedWomen who did not give birth in the past 12 months Now married:
69.7% (24)Unmarried:
30.3% (10)
Marital status - Asian population 15 years and over
Males 51.7% Never married48.3% Now married0.0% Separated0.0% Widowed0.0% DivorcedFemales 0.0% Never married61.0% Now married0.0% Separated19.9% Widowed19.1% DivorcedWomen who did not give birth in the past 12 months Now married:
100.0% (29)Unmarried:
0.0% (0)
Marital status - Other race population 15 years and over
Males 63.8% Never married36.2% Now married0.0% Separated0.0% Widowed0.0% DivorcedFemales 24.7% Never married18.0% Now married0.0% Separated20.2% Widowed37.1% DivorcedWomen who did not give birth in the past 12 months Now married:
42.1% (17)Unmarried:
57.9% (24)
Marital status - Two or more races population 15 years and over
Males 57.0% Never married8.3% Now married0.0% Separated1.5% Widowed33.2% DivorcedFemales 53.7% Never married31.3% Now married0.0% Separated0.0% Widowed14.9% DivorcedWomen who did not give birth in the past 12 months Now married:
19.9% (39)Unmarried:
80.1% (158)
Marital status - White alone, not Hispanic / Latino population 15 years and over
Males 38.4% Never married42.8% Now married0.8% Separated2.4% Widowed15.6% DivorcedFemales 32.4% Never married40.2% Now married0.4% Separated7.4% Widowed19.6% DivorcedWomen who gave birth in the past 12 months Now married:
28.1% (17)Unmarried:
71.9% (44)
Women who did not give birth in the past 12 months Now married:
32.7% (758)Unmarried:
67.3% (1,562)
Marital status - Hispanic or Latino population 15 years and over
Males 45.4% Never married45.9% Now married0.0% Separated2.0% Widowed6.6% DivorcedFemales 42.5% Never married34.4% Now married0.0% Separated11.6% Widowed11.6% DivorcedWomen who did not give birth in the past 12 months Now married:
41.3% (88)Unmarried:
58.7% (125)
Ancestries in Wayne
1,062 13.0% American
627 7.7% Polish
601 7.4% African
565 6.9% German
278 3.4% European
270 3.3% Irish
221 2.7% English
181 2.2% Italian
137 1.7% Senegalese
132 1.6% Albanian
113 1.4% Scottish
112 1.4% French Canadian
61 0.7% Eastern European
58 0.7% Nigerian
55 0.7% Canadian
52 0.6% Hungarian
37 0.5% Lebanese
30 0.4% French
28 0.3% Greek
22 0.3% Dutch
21 0.3% Finnish
19 0.2% Iranian
18 0.2% Norwegian
17 0.2% Scotch-Irish
12 0.1% Northern European
11 0.1% Romanian
9 0.1% Czech
7 0.09% Slovak
7 0.09% Swedish
5 0.06% Jordanian
4 0.05% British
4 0.05% Armenian
3 0.04% Russian
Children Nativity (place of birth) in Wayne
Children under 6 years - Living with two parents Both parents native 264 100.0% NativeBoth parents foreign-born 131 81.8% Native29 18.2% Foreign-bornOne native, one foreign-born parent 39 100.0% NativeChildren under 6 years - Living with one parent Native parent 636 100.0% NativeChildren 6 to 17 years - Living with two parents Both parents native 663 99.8% Native2 0.2% Foreign-bornBoth parents foreign-born 16 32.2% Native34 67.8% Foreign-bornOne native, one foreign-born parent 52 100.0% NativeChildren 6 to 17 years - Living with one parent Native parent 1,669 100.0% NativeForeign-born parent 2 51.4% Native2 48.6% Foreign-born
Grandparents responsible for own grandchildren in Wayne
Grandparents (30 to 59 years) White / Caucasian 38 70.1% Responsible for grandchildren16 29.9% Not responsible for grandchildrenWhite alone, not Hispanic / Latino 38 68.9% Responsible for grandchildren17 31.1% Not responsible for grandchildrenGrandparents (60 years and over) White / Caucasian 119 51.2% Responsible for grandchildren113 48.8% Not responsible for grandchildrenWhite alone, not Hispanic / Latino 111 48.5% Responsible for grandchildren118 51.5% Not responsible for grandchildren