Races in Weiser, Idaho (ID) Detailed Stats
Data:
Races - White alone (%)
Races - White alone (% change since 2000)
Races - Black alone (%)
Races - Black alone (% change since 2000)
Races - American Indian alone (%)
Races - American Indian alone (% change since 2000)
Races - Asian alone (%)
Races - Asian alone (% change since 2000)
Races - Hispanic (%)
Races - Hispanic (% change since 2000)
Races - Native Hawaiian and Other Pacific Islander alone (%)
Races - Native Hawaiian and Other Pacific Islander alone (% change since 2000)
Races - Two or more races(%)
Races - Two or more races(% change since 2000)
Races - Other race alone (%)
Races - Other race alone (% change since 2000)
Racial diversity
Place of birth - Born in state of residence (%)
Place of birth - Born in state of residence (%) - White
Place of birth - Born in state of residence (%) - Black or African American
Place of birth - Born in state of residence (%) - Asian
Place of birth - Born in state of residence (%) - Hispanic or Latino
Place of birth - Born in state of residence (%) - American Indian and Alaska Native
Place of birth - Born in state of residence (%) - Multirace
Place of birth - Born in state of residence (%) - Other Race
Place of birth - Born in other state (%)
Place of birth - Born in other state (%) - White
Place of birth - Born in other state (%) - Black or African American
Place of birth - Born in other state (%) - Asian
Place of birth - Born in other state (%) - Hispanic or Latino
Place of birth - Born in other state (%) - American Indian and Alaska Native
Place of birth - Born in other state (%) - Multirace
Place of birth - Born in other state (%) - Other Race
Place of birth - Native, outside of US (%)
Place of birth - Native, outside of US (%) - White
Place of birth - Native, outside of US (%) - Black or African American
Place of birth - Native, outside of US (%) - Asian
Place of birth - Native, outside of US (%) - Hispanic or Latino
Place of birth - Native, outside of US (%) - American Indian and Alaska Native
Place of birth - Native, outside of US (%) - Multirace
Place of birth - Native, outside of US (%) - Other Race
Place of birth - Foreign born (%)
Place of birth - Foreign born (%) - White
Place of birth - Foreign born (%) - Black or African American
Place of birth - Foreign born (%) - Asian
Place of birth - Foreign born (%) - Hispanic or Latino
Place of birth - Foreign born (%) - American Indian and Alaska Native
Place of birth - Foreign born (%) - Multirace
Place of birth - Foreign born (%) - Other Race
Residents speaking English at home (%)
Residents speaking English at home - Born in the United States (%)
Residents speaking English at home - Native, born elsewhere (%)
Residents speaking English at home - Foreign born (%)
Residents speaking Spanish at home (%)
Residents speaking Spanish at home - Born in the United States (%)
Residents speaking Spanish at home - Native, born elsewhere (%)
Residents speaking Spanish at home - Foreign born (%)
Residents speaking other language at home (%)
Residents speaking other language at home - Born in the United States (%)
Residents speaking other language at home - Native, born elsewhere (%)
Residents speaking other language at home - Foreign born (%)
Marital status - Never married (%)
Marital status - Now married (%)
Marital status - Separated (%)
Marital status - Widowed (%)
Marital status - Divorced (%)
Ancestries Reported - Arab (%)
Ancestries Reported - Czech (%)
Ancestries Reported - Danish (%)
Ancestries Reported - Dutch (%)
Ancestries Reported - English (%)
Ancestries Reported - French (%)
Ancestries Reported - French Canadian (%)
Ancestries Reported - German (%)
Ancestries Reported - Greek (%)
Ancestries Reported - Hungarian (%)
Ancestries Reported - Irish (%)
Ancestries Reported - Italian (%)
Ancestries Reported - Lithuanian (%)
Ancestries Reported - Norwegian (%)
Ancestries Reported - Polish (%)
Ancestries Reported - Portuguese (%)
Ancestries Reported - Russian (%)
Ancestries Reported - Scotch-Irish (%)
Ancestries Reported - Scottish (%)
Ancestries Reported - Slovak (%)
Ancestries Reported - Subsaharan African (%)
Ancestries Reported - Swedish (%)
Ancestries Reported - Swiss (%)
Ancestries Reported - Ukrainian (%)
Ancestries Reported - United States (%)
Ancestries Reported - Welsh (%)
Ancestries Reported - West Indian (%)
Ancestries Reported - Other (%)
Geographical mobility - Same house 1 year ago (%)
Geographical mobility - Same house 1 year ago (%) - White
Geographical mobility - Same house 1 year ago (%) - Black or African American
Geographical mobility - Same house 1 year ago (%) - Asian
Geographical mobility - Same house 1 year ago (%) - Hispanic or Latino
Geographical mobility - Same house 1 year ago (%) - American Indian and Alaska Native
Geographical mobility - Same house 1 year ago (%) - Multirace
Geographical mobility - Same house 1 year ago (%) - Other Race
Geographical mobility - Moved within same county (%)
Geographical mobility - Moved within same county (%) - White
Geographical mobility - Moved within same county (%) - Black or African American
Geographical mobility - Moved within same county (%) - Asian
Geographical mobility - Moved within same county (%) - Hispanic or Latino
Geographical mobility - Moved within same county (%) - American Indian and Alaska Native
Geographical mobility - Moved within same county (%) - Multirace
Geographical mobility - Moved within same county (%) - Other Race
Geographical mobility - Moved from different county within same state (%)
Geographical mobility - Moved from different county within same state (%) - White
Geographical mobility - Moved from different county within same state (%) - Black or African American
Geographical mobility - Moved from different county within same state (%) - Asian
Geographical mobility - Moved from different county within same state (%) - Hispanic or Latino
Geographical mobility - Moved from different county within same state (%) - American Indian and Alaska Native
Geographical mobility - Moved from different county within same state (%) - Multirace
Geographical mobility - Moved from different county within same state (%) - Other Race
Geographical mobility - Moved from different state (%)
Geographical mobility - Moved from different state (%) - White
Geographical mobility - Moved from different state (%) - Black or African American
Geographical mobility - Moved from different state (%) - Asian
Geographical mobility - Moved from different state (%) - Hispanic or Latino
Geographical mobility - Moved from different state (%) - American Indian and Alaska Native
Geographical mobility - Moved from different state (%) - Multirace
Geographical mobility - Moved from different state (%) - Other Race
Geographical mobility - Moved from abroad (%)
Geographical mobility - Moved from abroad (%) - White
Geographical mobility - Moved from abroad (%) - Black or African American
Geographical mobility - Moved from abroad (%) - Asian
Geographical mobility - Moved from abroad (%) - Hispanic or Latino
Geographical mobility - Moved from abroad (%) - American Indian and Alaska Native
Geographical mobility - Moved from abroad (%) - Multirace
Geographical mobility - Moved from abroad (%) - Other Race
Place of birth for the foreign-born population - Ireland (%)
Place of birth for the foreign-born population - Denmark (%)
Place of birth for the foreign-born population - Norway (%)
Place of birth for the foreign-born population - Sweden (%)
Place of birth for the foreign-born population - United Kingdom (%)
Place of birth for the foreign-born population - England (%)
Place of birth for the foreign-born population - Scotland (%)
Place of birth for the foreign-born population - Other Northern Europe (%)
Place of birth for the foreign-born population - Austria (%)
Place of birth for the foreign-born population - Belgium (%)
Place of birth for the foreign-born population - France (%)
Place of birth for the foreign-born population - Germany (%)
Place of birth for the foreign-born population - Netherlands (%)
Place of birth for the foreign-born population - Switzerland (%)
Place of birth for the foreign-born population - Other Western Europe (%)
Place of birth for the foreign-born population - Greece (%)
Place of birth for the foreign-born population - Italy (%)
Place of birth for the foreign-born population - Portugal (%)
Place of birth for the foreign-born population - Spain (%)
Place of birth for the foreign-born population - Other Southern Europe (%)
Place of birth for the foreign-born population - Albania (%)
Place of birth for the foreign-born population - Belarus (%)
Place of birth for the foreign-born population - Bosnia and Herzegovina (%)
Place of birth for the foreign-born population - Bulgaria (%)
Place of birth for the foreign-born population - Croatia (%)
Place of birth for the foreign-born population - Czechoslovakia (%)
Place of birth for the foreign-born population - Hungary (%)
Place of birth for the foreign-born population - Latvia (%)
Place of birth for the foreign-born population - Lithuania (%)
Place of birth for the foreign-born population - North Macedonia (Macedonia) (%)
Place of birth for the foreign-born population - Moldova (%)
Place of birth for the foreign-born population - Poland (%)
Place of birth for the foreign-born population - Romania (%)
Place of birth for the foreign-born population - Russia (%)
Place of birth for the foreign-born population - Serbia (%)
Place of birth for the foreign-born population - Ukraine (%)
Place of birth for the foreign-born population - Other Eastern Europe (%)
Place of birth for the foreign-born population - China (%)
Place of birth for the foreign-born population - Hong Kong (%)
Place of birth for the foreign-born population - Taiwan (%)
Place of birth for the foreign-born population - Japan (%)
Place of birth for the foreign-born population - Korea (%)
Place of birth for the foreign-born population - Other Eastern Asia (%)
Place of birth for the foreign-born population - Afghanistan (%)
Place of birth for the foreign-born population - Bangladesh (%)
Place of birth for the foreign-born population - India (%)
Place of birth for the foreign-born population - Iran (%)
Place of birth for the foreign-born population - Kazakhstan (%)
Place of birth for the foreign-born population - Nepal (%)
Place of birth for the foreign-born population - Pakistan (%)
Place of birth for the foreign-born population - Sri Lanka (%)
Place of birth for the foreign-born population - Uzbekistan (%)
Place of birth for the foreign-born population - Other South Central Asia (%)
Place of birth for the foreign-born population - Burma (%)
Place of birth for the foreign-born population - Cambodia (%)
Place of birth for the foreign-born population - Indonesia (%)
Place of birth for the foreign-born population - Laos (%)
Place of birth for the foreign-born population - Malaysia (%)
Place of birth for the foreign-born population - Philippines (%)
Place of birth for the foreign-born population - Singapore (%)
Place of birth for the foreign-born population - Thailand (%)
Place of birth for the foreign-born population - Vietnam (%)
Place of birth for the foreign-born population - Other South Eastern Asia (%)
Place of birth for the foreign-born population - Armenia (%)
Place of birth for the foreign-born population - Iraq (%)
Place of birth for the foreign-born population - Israel (%)
Place of birth for the foreign-born population - Jordan (%)
Place of birth for the foreign-born population - Kuwait (%)
Place of birth for the foreign-born population - Lebanon (%)
Place of birth for the foreign-born population - Saudi Arabia (%)
Place of birth for the foreign-born population - Syria (%)
Place of birth for the foreign-born population - Turkey (%)
Place of birth for the foreign-born population - Yemen (%)
Place of birth for the foreign-born population - Other Western Asia (%)
Place of birth for the foreign-born population - Eritrea (%)
Place of birth for the foreign-born population - Ethiopia (%)
Place of birth for the foreign-born population - Kenya (%)
Place of birth for the foreign-born population - Somalia (%)
Place of birth for the foreign-born population - Uganda (%)
Place of birth for the foreign-born population - Zimbabwe (%)
Place of birth for the foreign-born population - Other Eastern Africa (%)
Place of birth for the foreign-born population - Cameroon (%)
Place of birth for the foreign-born population - Congo (%)
Place of birth for the foreign-born population - Democratic Republic of Congo (Zaire) (%)
Place of birth for the foreign-born population - Other Middle Africa (%)
Place of birth for the foreign-born population - Egypt (%)
Place of birth for the foreign-born population - Morocco (%)
Place of birth for the foreign-born population - Sudan (%)
Place of birth for the foreign-born population - Other Northern Africa (%)
Place of birth for the foreign-born population - South Africa (%)
Place of birth for the foreign-born population - Other Southern Africa (%)
Place of birth for the foreign-born population - Cabo Verde (%)
Place of birth for the foreign-born population - Ghana (%)
Place of birth for the foreign-born population - Liberia (%)
Place of birth for the foreign-born population - Nigeria (%)
Place of birth for the foreign-born population - Senegal (%)
Place of birth for the foreign-born population - Sierra Leone (%)
Place of birth for the foreign-born population - Other Western Africa (%)
Place of birth for the foreign-born population - Australia (%)
Place of birth for the foreign-born population - New Zealand (%)
Place of birth for the foreign-born population - Fiji (%)
Place of birth for the foreign-born population - Micronesia (%)
Place of birth for the foreign-born population - Bahamas (%)
Place of birth for the foreign-born population - Barbados (%)
Place of birth for the foreign-born population - Cuba (%)
Place of birth for the foreign-born population - Dominica (%)
Place of birth for the foreign-born population - Dominican Republic (%)
Place of birth for the foreign-born population - Grenada (%)
Place of birth for the foreign-born population - Haiti (%)
Place of birth for the foreign-born population - Jamaica (%)
Place of birth for the foreign-born population - St. Vincent and the Grenadines (%)
Place of birth for the foreign-born population - Trinidad and Tobago (%)
Place of birth for the foreign-born population - West Indies (%)
Place of birth for the foreign-born population - Other Caribbean (%)
Place of birth for the foreign-born population - Belize (%)
Place of birth for the foreign-born population - Costa Rica (%)
Place of birth for the foreign-born population - El Salvador (%)
Place of birth for the foreign-born population - Guatemala (%)
Place of birth for the foreign-born population - Honduras (%)
Place of birth for the foreign-born population - Mexico (%)
Place of birth for the foreign-born population - Nicaragua (%)
Place of birth for the foreign-born population - Panama (%)
Place of birth for the foreign-born population - Other Central America (%)
Place of birth for the foreign-born population - Argentina (%)
Place of birth for the foreign-born population - Bolivia (%)
Place of birth for the foreign-born population - Brazil (%)
Place of birth for the foreign-born population - Chile (%)
Place of birth for the foreign-born population - Colombia (%)
Place of birth for the foreign-born population - Ecuador (%)
Place of birth for the foreign-born population - Guyana (%)
Place of birth for the foreign-born population - Peru (%)
Place of birth for the foreign-born population - Uruguay (%)
Place of birth for the foreign-born population - Venezuela (%)
Place of birth for the foreign-born population - Other South America (%)
Place of birth for the foreign-born population - Canada (%)
Place of birth for the foreign-born population - Other Northern America (%)
Place of birth for the foreign-born population - Other (%)
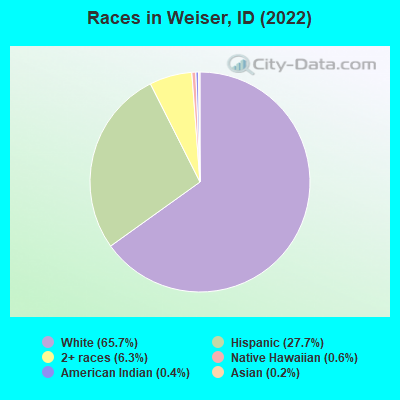
According to 2022 data, the most numerous races in Weiser, ID are White alone (3,904 residents), Hispanic (1,647 residents), and Two or more races (377 residents). 77.8% of Weiser residents speak English at home. 8.8% of Weiser, ID residents are foreign-born (7.4% born in Latin America), which is 43.0% greater than the foreign-born rate of 5.0% across the entire state of Idaho.
Race distribution in Weiser
2000 2022
1,139,291 88.0% White alone 101,690 7.9% Hispanic 18,261 1.4% Two or more races 15,789 1.2% American Indian alone 11,641 0.9% Asian alone 4,889 0.4% Black alone 1,192 0.09% Other race alone 1,200 0.09% Native Hawaiian and Other
1,531,219 79.0% White alone 261,921 13.5% Hispanic 81,112 4.2% Two or more races 25,174 1.3% Asian alone 15,825 0.8% American Indian alone 11,868 0.6% Black alone 8,752 0.5% Other race alone 3,162 0.2% Native Hawaiian and Other
Income and house value in Weiser Median household income in 2022 $43,308 White non-Hispanic householders$61,462 Two or more races householdersMedian 2022 house value $232,988 White Non-Hispanic householders$209,773 Black or African American householders $237,743 Asian householders$239,421 Some other race householders$182,922 Two or more races householders$248,371 Hispanic or Latino householders
Median age by race in Weiser
45.6 Median age for White residents43.6 46.0 -774,193,547.6 Median age for Black or African American residents-680,851,063.1 -869,696,968.8 -660,714,285.1 Median age for American Indian / Alaska Native residents-708,860,758.8 -601,489,757.3 -687,208,215.9 Median age for Asian residents-720,720,720.0 -642,796,248.3 -393,939,393.5 Median age for Native Hawaiian / Pacific Islander residents-355,119,825.4 -679,245,282.3 38.3 Median age for Other race residents40.1 38.5 36.7 Median age for Two or more races residents35.3 57.2 54.0 Median age for White alone residents54.0 51.6 29.5 Median age for Hispanic or Latino residents30.3 29.1
Owner/renter occupied households by race in Weiser
House owners and renters - White residents 1,182 64.0% Owner occupied664 36.0% Renter occupiedHouse owners and renters - American Indian / Alaska Native residents 19 100.0% Renter occupiedHouse owners and renters - Asian residents 10 100.0% Owner occupiedHouse owners and renters - Native Hawaiian / Pacific Islander residents 20 100.0% Owner occupiedHouse owners and renters - Other race residents 137 43.2% Owner occupied180 56.8% Renter occupiedHouse owners and renters - Two or more races residents 217 62.5% Owner occupied130 37.5% Renter occupiedHouse owners and renters - White alone residents 1,146 68.1% Owner occupied537 31.9% Renter occupiedHouse owners and renters - Hispanic or Latino residents 203 34.0% Owner occupied393 66.0% Renter occupied
Language usage in Weiser
English speakers - Total 77.8% of residents of Weiser speak English at home.
20.5% of residents speak Spanish at home 740 63.4% Speak English very well427 36.6% Speak English less than very well1.5% of residents speak other language at home 86 100.0% Speak English very well
English speakers - Born in the United States 82.3% of residents of Weiser speak English at home.
18.9% of residents speak Spanish at home 586 90.7% Speak English very well60 9.3% Speak English less than very well0.3% of residents speak other language at home 11 100.0% Speak English very well
English speakers - Native, born elsewhere 40.5% of residents of Weiser speak English at home.
32.4% of residents speak other language at home 12 100.0% Speak English very well
English speakers - Foreign-born 11.3% of residents of Weiser speak English at home.
75.7% of residents speak Spanish at home 49 11.6% Speak English very well372 88.4% Speak English less than very well9.2% of residents speak other language at home 51 100.0% Speak English very well
White (Caucasian) - Speak only English Native:
92.4% (3,809)Foreign-born:
41.6% (17)
White (Caucasian) - Speak another language Native:
6.7% (274)Foreign-born:
57.8% (23)
Asian - Speak only English Native:
100.0% (8)Foreign-born:
100.0% (6)
Other race - Speak only English Native:
34.3% (123)Foreign-born:
10.7% (44)
Other race - Speak another language Native:
64.4% (230)Foreign-born:
89.4% (371)
Two or more races - Speak another language Native:
41.0% (283)Foreign-born:
97.2% (135)
White alone - Speak only English Native:
94.1% (3,535)Foreign-born:
50.3% (18)
White alone - Speak another language Native:
5.9% (222)Foreign-born:
42.7% (15)
Hispanic or Latino - Speak only English Native:
49.8% (535)Foreign-born:
9.3% (43)
Hispanic or Latino - Speak another language Native:
49.9% (537)Foreign-born:
90.7% (423)
Foreign-born residents in Weiser 521 residents are foreign born (7.4% Latin America ).
Marital status for residents in Weiser Marital status - White (Caucasian) population 15 years and over
Males 22.3% Never married52.0% Now married3.4% Separated5.1% Widowed17.2% DivorcedFemales 24.0% Never married39.4% Now married4.8% Separated10.2% Widowed21.6% DivorcedWomen who gave birth in the past 12 months Now married:
38.5% (15)Unmarried:
61.5% (24)
Women who did not give birth in the past 12 months Now married:
39.3% (348)Unmarried:
60.7% (537)
Marital status - Asian population 15 years and over
Males 100.0% Never married0.0% Now married0.0% Separated0.0% Widowed0.0% DivorcedFemales 0.0% Never married100.0% Now married0.0% Separated0.0% Widowed0.0% DivorcedMarital status - Other race population 15 years and over
Males 44.5% Never married16.7% Now married19.2% Separated0.0% Widowed19.6% DivorcedFemales 62.4% Never married16.0% Now married0.0% Separated0.0% Widowed21.7% DivorcedWomen who did not give birth in the past 12 months Now married:
0.0% (0)Unmarried:
100.0% (176)
Marital status - Two or more races population 15 years and over
Males 21.5% Never married66.1% Now married0.0% Separated0.0% Widowed12.4% DivorcedFemales 24.6% Never married55.0% Now married0.0% Separated13.3% Widowed7.1% DivorcedWomen who did not give birth in the past 12 months Now married:
0.0% (0)Unmarried:
100.0% (89)
Marital status - White alone, not Hispanic / Latino population 15 years and over
Males 20.5% Never married51.9% Now married3.7% Separated5.5% Widowed18.5% DivorcedFemales 23.1% Never married41.5% Now married0.9% Separated11.0% Widowed23.4% DivorcedWomen who gave birth in the past 12 months Now married:
38.5% (16)Unmarried:
61.5% (25)
Women who did not give birth in the past 12 months Now married:
34.1% (257)Unmarried:
65.9% (496)
Marital status - Hispanic or Latino population 15 years and over
Males 44.4% Never married33.0% Now married10.3% Separated0.0% Widowed12.3% DivorcedFemales 46.3% Never married30.9% Now married13.0% Separated0.0% Widowed9.8% DivorcedWomen who did not give birth in the past 12 months Now married:
26.4% (101)Unmarried:
73.6% (282)
Ancestries in Weiser
344 14.2% English197 8.1% American172 7.1% Irish162 6.7% German131 5.4% European22 0.9% Dutch20 0.8% Scottish18 0.7% Yugoslavian12 0.5% Italian12 0.5% Welsh8 0.3% Russian8 0.3% Slovak7 0.3% Swedish6 0.2% Scotch-Irish5 0.2% Armenian5 0.2% British5 0.2% Northern European3 0.1% Norwegian
Children Nativity (place of birth) in Weiser
Children under 6 years - Living with two parents Both parents native 150 100.0% NativeChildren under 6 years - Living with one parent Native parent 193 100.0% NativeChildren 6 to 17 years - Living with two parents Both parents native 369 100.0% NativeChildren 6 to 17 years - Living with one parent Native parent 310 100.0% NativeForeign-born parent 190 51.6% Native178 48.4% Foreign-born
Grandparents responsible for own grandchildren in Weiser
Grandparents (30 to 59 years) White / Caucasian 18 62.5% Responsible for grandchildren11 37.5% Not responsible for grandchildrenWhite alone, not Hispanic / Latino 19 64.1% Responsible for grandchildren11 35.9% Not responsible for grandchildrenGrandparents (60 years and over) White / Caucasian 3 9.1% Responsible for grandchildren30 90.9% Not responsible for grandchildrenWhite alone, not Hispanic / Latino 3 8.8% Responsible for grandchildren31 91.2% Not responsible for grandchildren