Races in West Caldwell, New Jersey (NJ) Detailed Stats
Ancestries, Foreign-born residents, place of birth

Recent posts about races in West Caldwell, New Jersey on our local forum with over 2,400,000 registered users:

8.6% of West Caldwell, NJ residents are foreign-born (3.1% born in Europe, 2.8% born in Asia, 2.8% born in Latin America), which is 166.1% less than the foreign-born rate of 23.0% across the entire state of New Jersey.
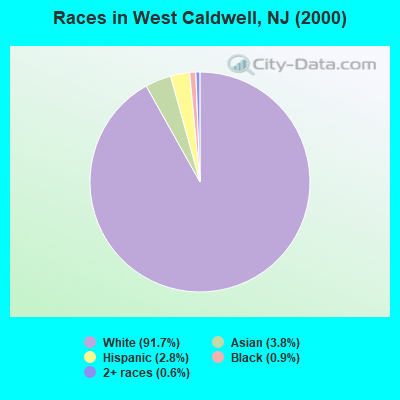
Race distribution in West Caldwell

- 10,30091.7%White alone
- 4323.8%Asian alone
- 3142.8%Hispanic
- 1000.9%Black alone
- 700.6%Two or more races
- 100.09%Other race alone
- 40.04%Native Hawaiian and Other
Pacific Islander alone - 30.03%American Indian alone
2000
2022
-
- 5,557,20966.0%White alone
- 1,117,19113.3%Hispanic
- 1,096,17113.0%Black alone
- 477,0125.7%Asian alone
- 133,6891.6%Two or more races
- 19,5650.2%Other race alone
- 11,3380.1%American Indian alone
- 2,1750.03%Native Hawaiian and Other
Pacific Islander alone

-
- 4,766,47651.5%White alone
- 2,028,47021.9%Hispanic
- 1,111,63212.0%Black alone
- 923,54610.0%Asian alone
- 332,2373.6%Two or more races
- 89,8471.0%Other race alone
- 8,5570.09%American Indian alone
- 9340.01%Native Hawaiian and Other
Pacific Islander alone

Income and house value in West Caldwell
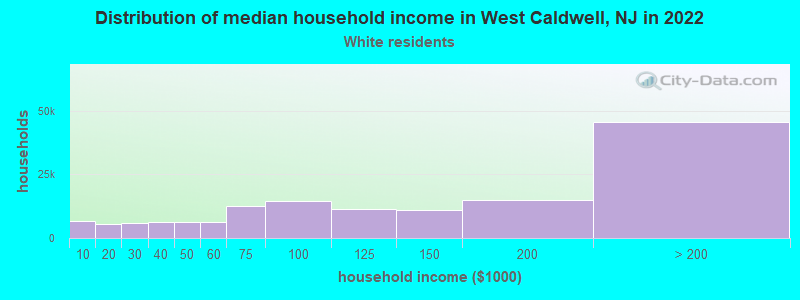
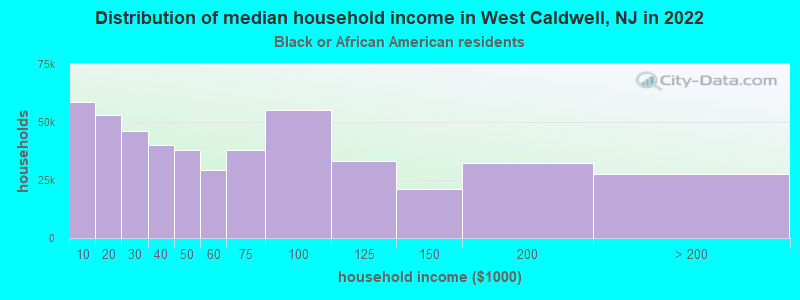
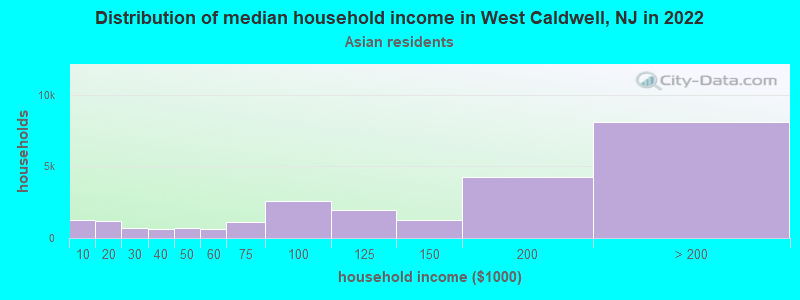
- Median household income in 2022
- $151,744White non-Hispanic householders
- $198,365Black householders
- over $200,000Asian householders
- $175,723Some other race householders
- $141,233Two or more races householders
- over $200,000Hispanic or Latino race householders
- Median 2022 house value
- $698,663White Non-Hispanic householders
- $852,348Black or African American householders
- $625,230Asian householders
- $426,174Some other race householders
- $305,009Two or more races householders
- $744,034Hispanic or Latino householders
Household income for White non-Hispanic householders
Household income for Black householders
Household income for Asian householders
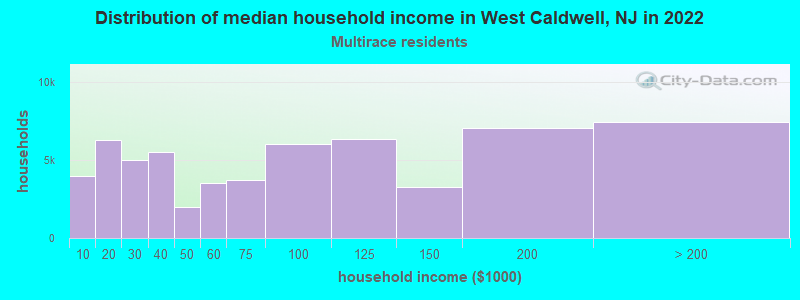
Household income for Two or more races householders
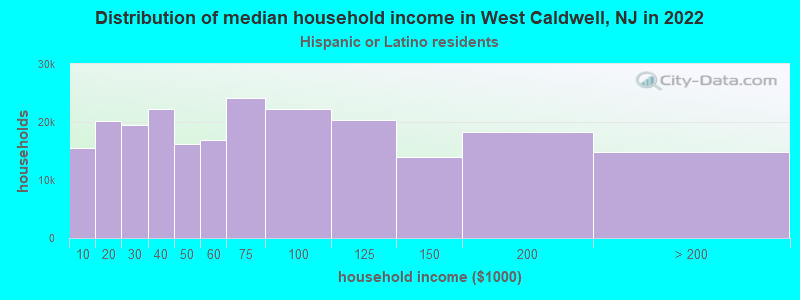
Household income for Hispanic or Latino race householders
Foreign-born residents in West Caldwell
971 residents are foreign born (3.1% Europe, 2.8% Asia, 2.8% Latin America).
| This city: | 8.6% |
| New Jersey: | 17.5% |
Ancestries in West Caldwell

- 3,95829.1%Italian
- 2,43817.9%Irish
- 1,69512.5%Other
- 1,61811.9%German
- 7545.5%English
- 6164.5%Polish
- 4673.4%United States
- 2571.9%Russian
- 2311.7%French
- 2051.5%Scottish
- 2011.5%Dutch
- 1631.2%Norwegian
- 1371.0%Hungarian
- 1331.0%Swedish
- 1110.8%Greek
- 950.7%Portuguese
- 900.7%Scotch-Irish
- 860.6%Slovak
- 650.5%Swiss
- 590.4%Czech
- 550.4%West Indian
- 500.4%Arab
- 450.3%Ukrainian
- 300.2%Welsh
- 190.1%Lithuanian
- 180.1%French Canadian
- 110.08%Danish
- 30.02%Subsaharan African

Zip codes: 07006.