Races in West Haverstraw, New York (NY) Detailed Stats
Data:
Races - White alone (%)
Races - White alone (% change since 2000)
Races - Black alone (%)
Races - Black alone (% change since 2000)
Races - American Indian alone (%)
Races - American Indian alone (% change since 2000)
Races - Asian alone (%)
Races - Asian alone (% change since 2000)
Races - Hispanic (%)
Races - Hispanic (% change since 2000)
Races - Native Hawaiian and Other Pacific Islander alone (%)
Races - Native Hawaiian and Other Pacific Islander alone (% change since 2000)
Races - Two or more races(%)
Races - Two or more races(% change since 2000)
Races - Other race alone (%)
Races - Other race alone (% change since 2000)
Racial diversity
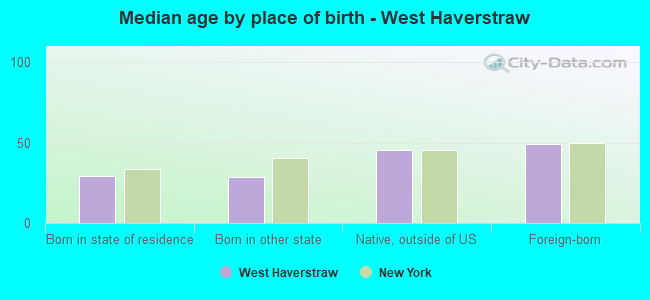
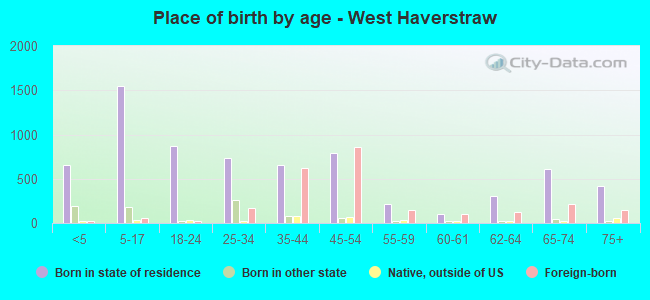
Place of birth - Born in state of residence (%)
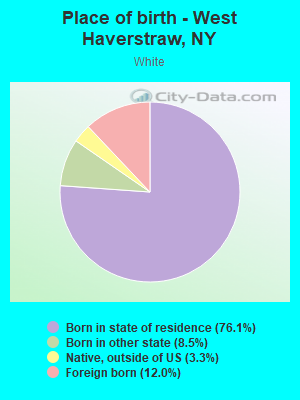
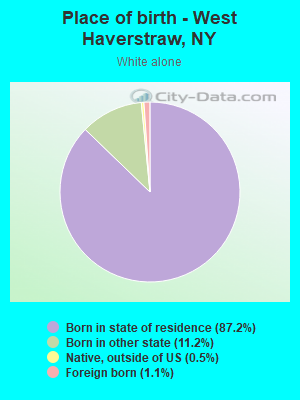
Place of birth - Born in state of residence (%) - White
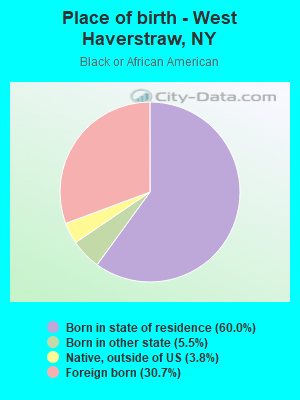
Place of birth - Born in state of residence (%) - Black or African American
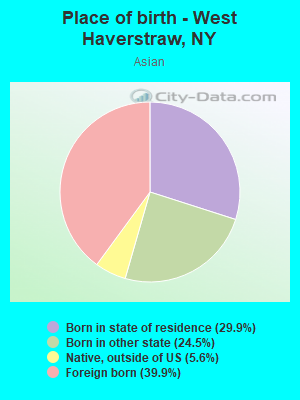
Place of birth - Born in state of residence (%) - Asian
Place of birth - Born in state of residence (%) - Hispanic or Latino
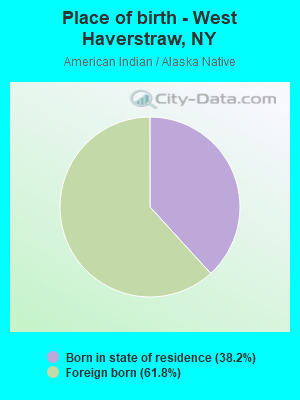
Place of birth - Born in state of residence (%) - American Indian and Alaska Native
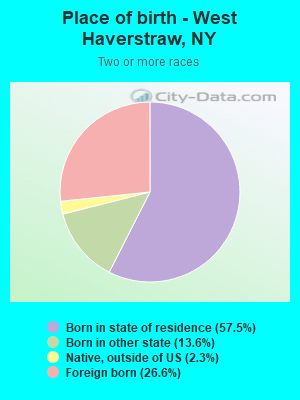
Place of birth - Born in state of residence (%) - Multirace
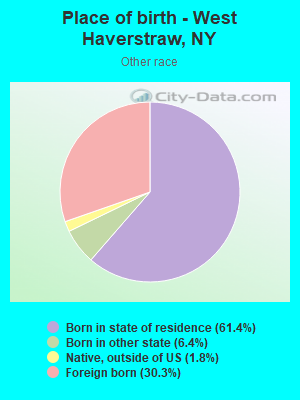
Place of birth - Born in state of residence (%) - Other Race
Place of birth - Born in other state (%)
Place of birth - Born in other state (%) - White
Place of birth - Born in other state (%) - Black or African American
Place of birth - Born in other state (%) - Asian
Place of birth - Born in other state (%) - Hispanic or Latino
Place of birth - Born in other state (%) - American Indian and Alaska Native
Place of birth - Born in other state (%) - Multirace
Place of birth - Born in other state (%) - Other Race
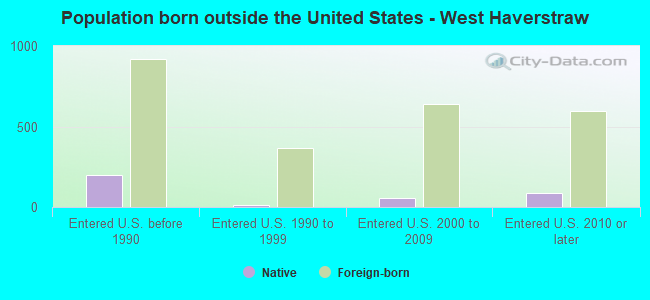
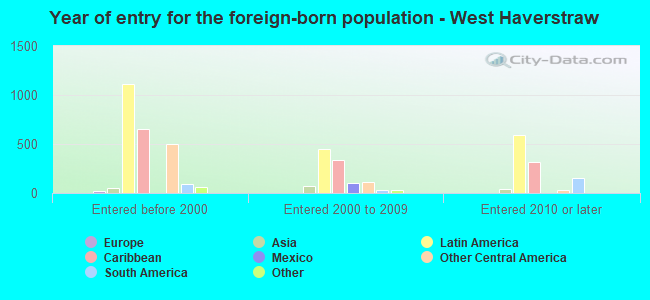
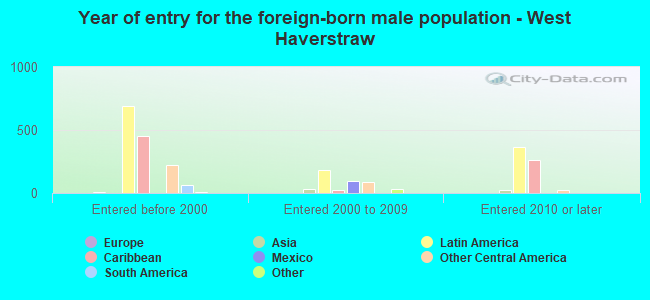
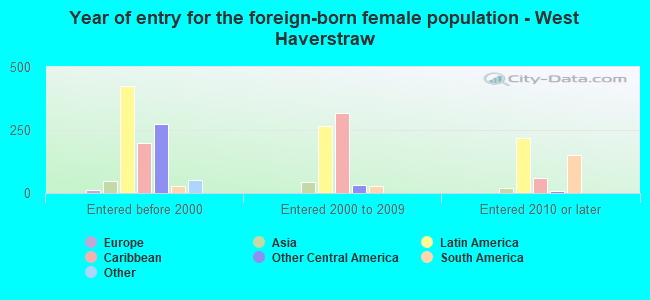
Place of birth - Native, outside of US (%)
Place of birth - Native, outside of US (%) - White
Place of birth - Native, outside of US (%) - Black or African American
Place of birth - Native, outside of US (%) - Asian
Place of birth - Native, outside of US (%) - Hispanic or Latino
Place of birth - Native, outside of US (%) - American Indian and Alaska Native
Place of birth - Native, outside of US (%) - Multirace
Place of birth - Native, outside of US (%) - Other Race
Place of birth - Foreign born (%)
Place of birth - Foreign born (%) - White
Place of birth - Foreign born (%) - Black or African American
Place of birth - Foreign born (%) - Asian
Place of birth - Foreign born (%) - Hispanic or Latino
Place of birth - Foreign born (%) - American Indian and Alaska Native
Place of birth - Foreign born (%) - Multirace
Place of birth - Foreign born (%) - Other Race
Residents speaking English at home (%)
Residents speaking English at home - Born in the United States (%)
Residents speaking English at home - Native, born elsewhere (%)
Residents speaking English at home - Foreign born (%)
Residents speaking Spanish at home (%)
Residents speaking Spanish at home - Born in the United States (%)
Residents speaking Spanish at home - Native, born elsewhere (%)
Residents speaking Spanish at home - Foreign born (%)
Residents speaking other language at home (%)
Residents speaking other language at home - Born in the United States (%)
Residents speaking other language at home - Native, born elsewhere (%)
Residents speaking other language at home - Foreign born (%)
Marital status - Never married (%)
Marital status - Now married (%)
Marital status - Separated (%)
Marital status - Widowed (%)
Marital status - Divorced (%)
Ancestries Reported - Arab (%)
Ancestries Reported - Czech (%)
Ancestries Reported - Danish (%)
Ancestries Reported - Dutch (%)
Ancestries Reported - English (%)
Ancestries Reported - French (%)
Ancestries Reported - French Canadian (%)
Ancestries Reported - German (%)
Ancestries Reported - Greek (%)
Ancestries Reported - Hungarian (%)
Ancestries Reported - Irish (%)
Ancestries Reported - Italian (%)
Ancestries Reported - Lithuanian (%)
Ancestries Reported - Norwegian (%)
Ancestries Reported - Polish (%)
Ancestries Reported - Portuguese (%)
Ancestries Reported - Russian (%)
Ancestries Reported - Scotch-Irish (%)
Ancestries Reported - Scottish (%)
Ancestries Reported - Slovak (%)
Ancestries Reported - Subsaharan African (%)
Ancestries Reported - Swedish (%)
Ancestries Reported - Swiss (%)
Ancestries Reported - Ukrainian (%)
Ancestries Reported - United States (%)
Ancestries Reported - Welsh (%)
Ancestries Reported - West Indian (%)
Ancestries Reported - Other (%)
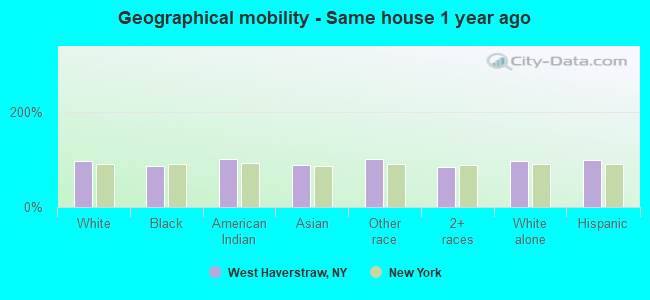
Geographical mobility - Same house 1 year ago (%)
Geographical mobility - Same house 1 year ago (%) - White
Geographical mobility - Same house 1 year ago (%) - Black or African American
Geographical mobility - Same house 1 year ago (%) - Asian
Geographical mobility - Same house 1 year ago (%) - Hispanic or Latino
Geographical mobility - Same house 1 year ago (%) - American Indian and Alaska Native
Geographical mobility - Same house 1 year ago (%) - Multirace
Geographical mobility - Same house 1 year ago (%) - Other Race
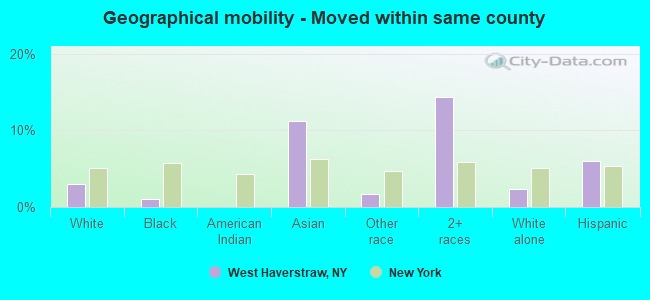
Geographical mobility - Moved within same county (%)
Geographical mobility - Moved within same county (%) - White
Geographical mobility - Moved within same county (%) - Black or African American
Geographical mobility - Moved within same county (%) - Asian
Geographical mobility - Moved within same county (%) - Hispanic or Latino
Geographical mobility - Moved within same county (%) - American Indian and Alaska Native
Geographical mobility - Moved within same county (%) - Multirace
Geographical mobility - Moved within same county (%) - Other Race
Geographical mobility - Moved from different county within same state (%)
Geographical mobility - Moved from different county within same state (%) - White
Geographical mobility - Moved from different county within same state (%) - Black or African American
Geographical mobility - Moved from different county within same state (%) - Asian
Geographical mobility - Moved from different county within same state (%) - Hispanic or Latino
Geographical mobility - Moved from different county within same state (%) - American Indian and Alaska Native
Geographical mobility - Moved from different county within same state (%) - Multirace
Geographical mobility - Moved from different county within same state (%) - Other Race
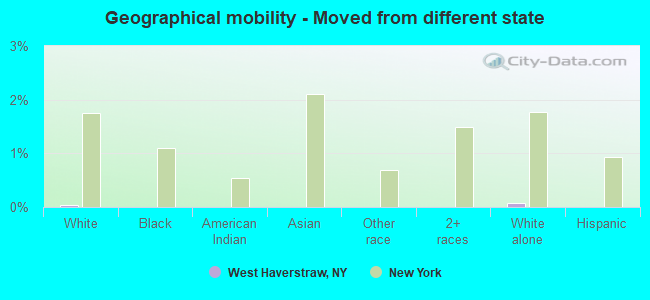
Geographical mobility - Moved from different state (%)
Geographical mobility - Moved from different state (%) - White
Geographical mobility - Moved from different state (%) - Black or African American
Geographical mobility - Moved from different state (%) - Asian
Geographical mobility - Moved from different state (%) - Hispanic or Latino
Geographical mobility - Moved from different state (%) - American Indian and Alaska Native
Geographical mobility - Moved from different state (%) - Multirace
Geographical mobility - Moved from different state (%) - Other Race
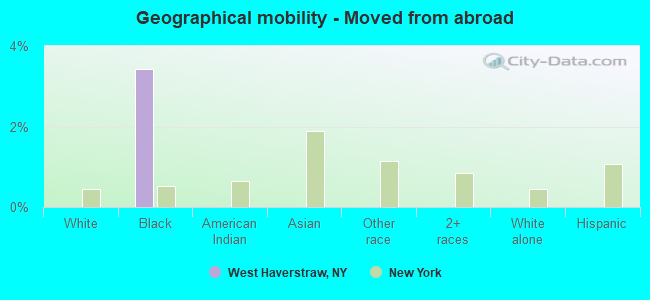
Geographical mobility - Moved from abroad (%)
Geographical mobility - Moved from abroad (%) - White
Geographical mobility - Moved from abroad (%) - Black or African American
Geographical mobility - Moved from abroad (%) - Asian
Geographical mobility - Moved from abroad (%) - Hispanic or Latino
Geographical mobility - Moved from abroad (%) - American Indian and Alaska Native
Geographical mobility - Moved from abroad (%) - Multirace
Geographical mobility - Moved from abroad (%) - Other Race
Place of birth for the foreign-born population - Ireland (%)
Place of birth for the foreign-born population - Denmark (%)
Place of birth for the foreign-born population - Norway (%)
Place of birth for the foreign-born population - Sweden (%)
Place of birth for the foreign-born population - United Kingdom (%)
Place of birth for the foreign-born population - England (%)
Place of birth for the foreign-born population - Scotland (%)
Place of birth for the foreign-born population - Other Northern Europe (%)
Place of birth for the foreign-born population - Austria (%)
Place of birth for the foreign-born population - Belgium (%)
Place of birth for the foreign-born population - France (%)
Place of birth for the foreign-born population - Germany (%)
Place of birth for the foreign-born population - Netherlands (%)
Place of birth for the foreign-born population - Switzerland (%)
Place of birth for the foreign-born population - Other Western Europe (%)
Place of birth for the foreign-born population - Greece (%)
Place of birth for the foreign-born population - Italy (%)
Place of birth for the foreign-born population - Portugal (%)
Place of birth for the foreign-born population - Spain (%)
Place of birth for the foreign-born population - Other Southern Europe (%)
Place of birth for the foreign-born population - Albania (%)
Place of birth for the foreign-born population - Belarus (%)
Place of birth for the foreign-born population - Bosnia and Herzegovina (%)
Place of birth for the foreign-born population - Bulgaria (%)
Place of birth for the foreign-born population - Croatia (%)
Place of birth for the foreign-born population - Czechoslovakia (%)
Place of birth for the foreign-born population - Hungary (%)
Place of birth for the foreign-born population - Latvia (%)
Place of birth for the foreign-born population - Lithuania (%)
Place of birth for the foreign-born population - North Macedonia (Macedonia) (%)
Place of birth for the foreign-born population - Moldova (%)
Place of birth for the foreign-born population - Poland (%)
Place of birth for the foreign-born population - Romania (%)
Place of birth for the foreign-born population - Russia (%)
Place of birth for the foreign-born population - Serbia (%)
Place of birth for the foreign-born population - Ukraine (%)
Place of birth for the foreign-born population - Other Eastern Europe (%)
Place of birth for the foreign-born population - China (%)
Place of birth for the foreign-born population - Hong Kong (%)
Place of birth for the foreign-born population - Taiwan (%)
Place of birth for the foreign-born population - Japan (%)
Place of birth for the foreign-born population - Korea (%)
Place of birth for the foreign-born population - Other Eastern Asia (%)
Place of birth for the foreign-born population - Afghanistan (%)
Place of birth for the foreign-born population - Bangladesh (%)
Place of birth for the foreign-born population - India (%)
Place of birth for the foreign-born population - Iran (%)
Place of birth for the foreign-born population - Kazakhstan (%)
Place of birth for the foreign-born population - Nepal (%)
Place of birth for the foreign-born population - Pakistan (%)
Place of birth for the foreign-born population - Sri Lanka (%)
Place of birth for the foreign-born population - Uzbekistan (%)
Place of birth for the foreign-born population - Other South Central Asia (%)
Place of birth for the foreign-born population - Burma (%)
Place of birth for the foreign-born population - Cambodia (%)
Place of birth for the foreign-born population - Indonesia (%)
Place of birth for the foreign-born population - Laos (%)
Place of birth for the foreign-born population - Malaysia (%)
Place of birth for the foreign-born population - Philippines (%)
Place of birth for the foreign-born population - Singapore (%)
Place of birth for the foreign-born population - Thailand (%)
Place of birth for the foreign-born population - Vietnam (%)
Place of birth for the foreign-born population - Other South Eastern Asia (%)
Place of birth for the foreign-born population - Armenia (%)
Place of birth for the foreign-born population - Iraq (%)
Place of birth for the foreign-born population - Israel (%)
Place of birth for the foreign-born population - Jordan (%)
Place of birth for the foreign-born population - Kuwait (%)
Place of birth for the foreign-born population - Lebanon (%)
Place of birth for the foreign-born population - Saudi Arabia (%)
Place of birth for the foreign-born population - Syria (%)
Place of birth for the foreign-born population - Turkey (%)
Place of birth for the foreign-born population - Yemen (%)
Place of birth for the foreign-born population - Other Western Asia (%)
Place of birth for the foreign-born population - Eritrea (%)
Place of birth for the foreign-born population - Ethiopia (%)
Place of birth for the foreign-born population - Kenya (%)
Place of birth for the foreign-born population - Somalia (%)
Place of birth for the foreign-born population - Uganda (%)
Place of birth for the foreign-born population - Zimbabwe (%)
Place of birth for the foreign-born population - Other Eastern Africa (%)
Place of birth for the foreign-born population - Cameroon (%)
Place of birth for the foreign-born population - Congo (%)
Place of birth for the foreign-born population - Democratic Republic of Congo (Zaire) (%)
Place of birth for the foreign-born population - Other Middle Africa (%)
Place of birth for the foreign-born population - Egypt (%)
Place of birth for the foreign-born population - Morocco (%)
Place of birth for the foreign-born population - Sudan (%)
Place of birth for the foreign-born population - Other Northern Africa (%)
Place of birth for the foreign-born population - South Africa (%)
Place of birth for the foreign-born population - Other Southern Africa (%)
Place of birth for the foreign-born population - Cabo Verde (%)
Place of birth for the foreign-born population - Ghana (%)
Place of birth for the foreign-born population - Liberia (%)
Place of birth for the foreign-born population - Nigeria (%)
Place of birth for the foreign-born population - Senegal (%)
Place of birth for the foreign-born population - Sierra Leone (%)
Place of birth for the foreign-born population - Other Western Africa (%)
Place of birth for the foreign-born population - Australia (%)
Place of birth for the foreign-born population - New Zealand (%)
Place of birth for the foreign-born population - Fiji (%)
Place of birth for the foreign-born population - Micronesia (%)
Place of birth for the foreign-born population - Bahamas (%)
Place of birth for the foreign-born population - Barbados (%)
Place of birth for the foreign-born population - Cuba (%)
Place of birth for the foreign-born population - Dominica (%)
Place of birth for the foreign-born population - Dominican Republic (%)
Place of birth for the foreign-born population - Grenada (%)
Place of birth for the foreign-born population - Haiti (%)
Place of birth for the foreign-born population - Jamaica (%)
Place of birth for the foreign-born population - St. Vincent and the Grenadines (%)
Place of birth for the foreign-born population - Trinidad and Tobago (%)
Place of birth for the foreign-born population - West Indies (%)
Place of birth for the foreign-born population - Other Caribbean (%)
Place of birth for the foreign-born population - Belize (%)
Place of birth for the foreign-born population - Costa Rica (%)
Place of birth for the foreign-born population - El Salvador (%)
Place of birth for the foreign-born population - Guatemala (%)
Place of birth for the foreign-born population - Honduras (%)
Place of birth for the foreign-born population - Mexico (%)
Place of birth for the foreign-born population - Nicaragua (%)
Place of birth for the foreign-born population - Panama (%)
Place of birth for the foreign-born population - Other Central America (%)
Place of birth for the foreign-born population - Argentina (%)
Place of birth for the foreign-born population - Bolivia (%)
Place of birth for the foreign-born population - Brazil (%)
Place of birth for the foreign-born population - Chile (%)
Place of birth for the foreign-born population - Colombia (%)
Place of birth for the foreign-born population - Ecuador (%)
Place of birth for the foreign-born population - Guyana (%)
Place of birth for the foreign-born population - Peru (%)
Place of birth for the foreign-born population - Uruguay (%)
Place of birth for the foreign-born population - Venezuela (%)
Place of birth for the foreign-born population - Other South America (%)
Place of birth for the foreign-born population - Canada (%)
Place of birth for the foreign-born population - Other Northern America (%)
Place of birth for the foreign-born population - Other (%)
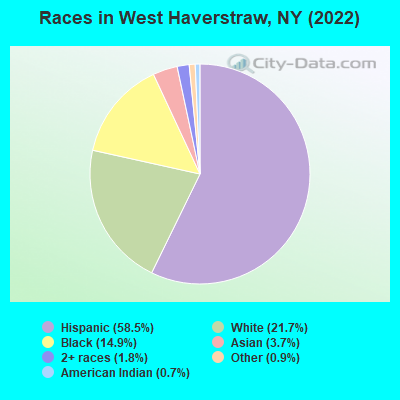
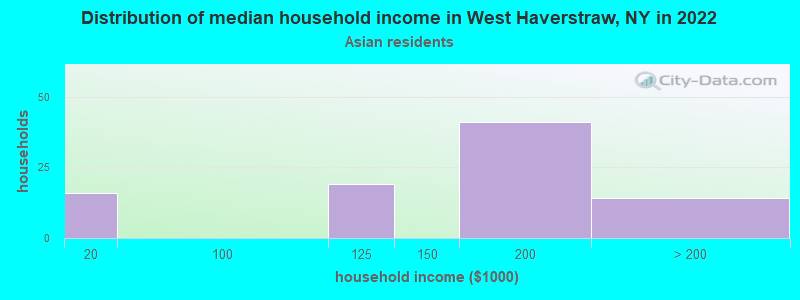
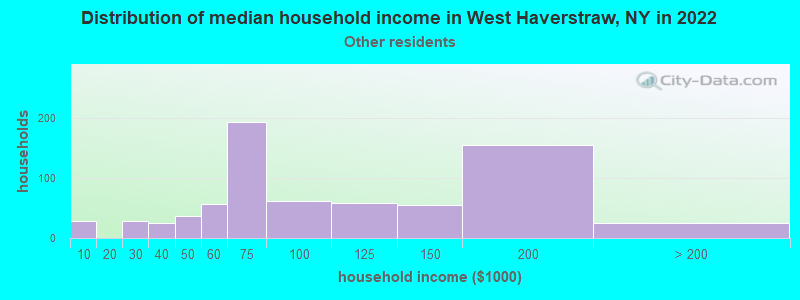
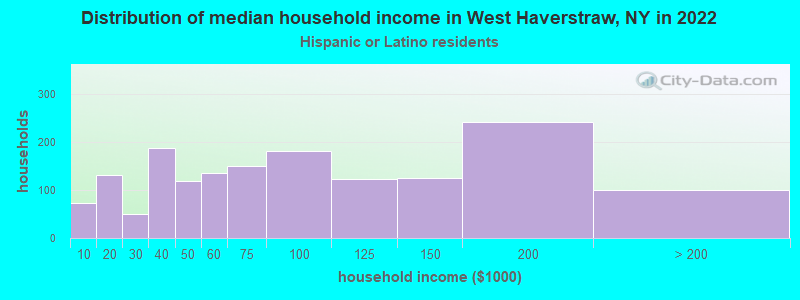
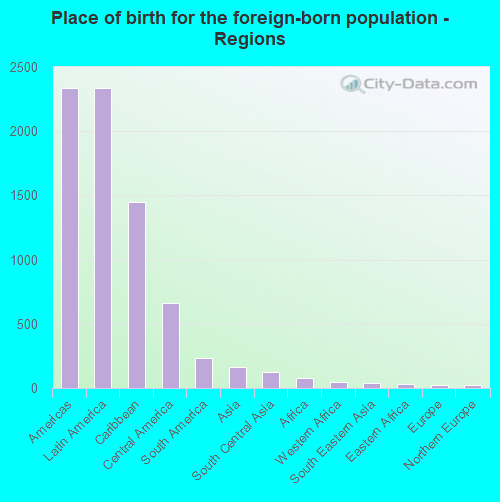
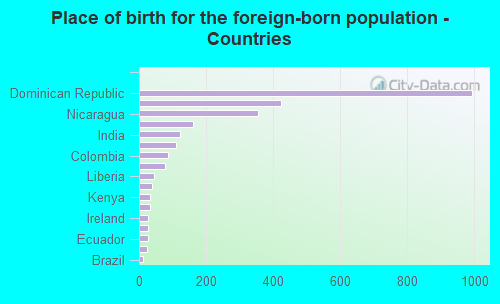
According to 2022 data, the most numerous races in West Haverstraw, NY are White alone (2,327 residents), Hispanic (6,257 residents), and Black alone (1,594 residents). 50.1% of West Haverstraw residents speak English at home. 24.4% of West Haverstraw, NY residents are foreign-born (22.2% born in Latin America), which is 9.7% greater than the foreign-born rate of 22.0% across the entire state of New York.
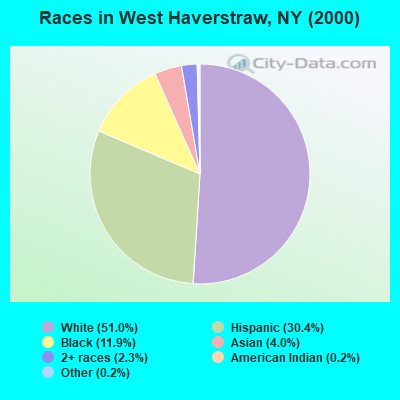
Race distribution in West Haverstraw
2000 2022
11,760,981 62.0% White alone 2,867,583 15.1% Hispanic 2,812,623 14.8% Black alone 1,035,926 5.5% Asian alone 366,116 1.9% Two or more races 75,499 0.4% Other race alone 52,499 0.3% American Indian alone 5,230 0.03% Native Hawaiian and Other
10,408,933 52.9% White alone 3,867,299 19.7% Hispanic 2,633,840 13.4% Black alone 1,776,286 9.0% Asian alone 732,670 3.7% Two or more races 216,110 1.1% Other race alone 35,082 0.2% American Indian alone 6,931 0.04% Native Hawaiian and Other
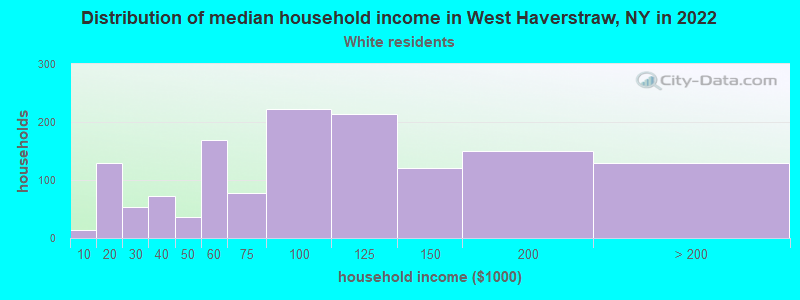
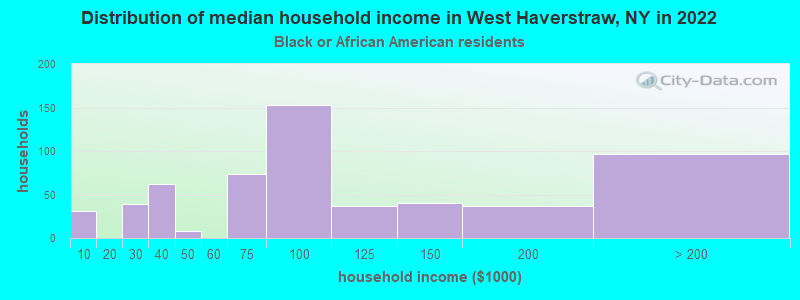
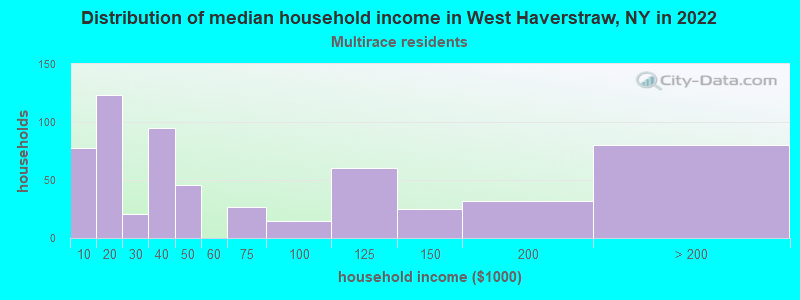
Income and house value in West Haverstraw Median household income in 2022 $93,667 White non-Hispanic householders$69,473 Black householders$145,936 Asian householders$73,788 Some other race householders$38,085 Two or more races householders$74,236 Hispanic or Latino race householdersMedian 2022 house value $347,422 White Non-Hispanic householders$346,991 Black or African American householders $281,903 Asian householders$299,145 Some other race householders$471,563 Two or more races householders$327,809 Hispanic or Latino householders
Median age by race in West Haverstraw
45.8 Median age for White residents39.5 50.2 46.5 Median age for Black or African American residents45.7 49.1 39.3 Median age for American Indian / Alaska Native residents-750,656,167.2 -644,444,443.8 35.2 Median age for Asian residents31.3 62.5 -463,937,621.4 Median age for Native Hawaiian / Pacific Islander residents-649,572,648.9 -666,666,666.0 32.6 Median age for Other race residents29.1 36.1 28.5 Median age for Two or more races residents24.3 36.9 51.2 Median age for White alone residents44.1 56.0 35.1 Median age for Hispanic or Latino residents31.6 38.8
Owner/renter occupied households by race in West Haverstraw
House owners and renters - White residents 1,127 79.0% Owner occupied300 21.0% Renter occupiedHouse owners and renters - Black or African American residents 293 54.8% Owner occupied242 45.2% Renter occupiedHouse owners and renters - American Indian / Alaska Native residents 52 100.0% Owner occupiedHouse owners and renters - Asian residents 71 90.1% Owner occupied8 9.9% Renter occupiedHouse owners and renters - Other race residents 320 53.6% Owner occupied277 46.4% Renter occupiedHouse owners and renters - Two or more races residents 288 34.1% Owner occupied556 65.9% Renter occupiedHouse owners and renters - White alone residents 906 86.6% Owner occupied140 13.4% Renter occupiedHouse owners and renters - Hispanic or Latino residents 750 45.2% Owner occupied910 54.8% Renter occupied
Language usage in West Haverstraw
English speakers - Total 50.1% of residents of West Haverstraw speak English at home.
36.1% of residents speak Spanish at home 1,691 47.6% Speak English very well1,860 52.4% Speak English less than very well11.6% of residents speak other language at home 949 83.2% Speak English very well192 16.8% Speak English less than very well
English speakers - Born in the United States 53.1% of residents of West Haverstraw speak English at home.
29.6% of residents speak Spanish at home 116 57.4% Speak English very well86 42.6% Speak English less than very well12.4% of residents speak other language at home 59 69.4% Speak English very well26 30.6% Speak English less than very well
English speakers - Native, born elsewhere 31.0% of residents of West Haverstraw speak English at home.
42.3% of residents speak Spanish at home 84 56.4% Speak English very well65 43.6% Speak English less than very well30.4% of residents speak other language at home 107 100.0% Speak English very well
English speakers - Foreign-born 4.6% of residents of West Haverstraw speak English at home.
73.9% of residents speak Spanish at home 374 19.8% Speak English very well1,513 80.2% Speak English less than very well22.8% of residents speak other language at home 438 75.4% Speak English very well143 24.6% Speak English less than very well
White (Caucasian) - Speak only English Native:
86.3% (3,031)Foreign-born:
2.3% (11)
White (Caucasian) - Speak another language Native:
14.8% (519)Foreign-born:
90.1% (445)
Black or African American - Speak only English Native:
68.5% (719)Foreign-born:
13.2% (67)
Black or African American - Speak another language Native:
31.8% (334)Foreign-born:
88.0% (449)
American Indian / Alaska Native - Speak another language Native:
100.0% (44)Foreign-born:
100.0% (72)
Asian - Speak another language Native:
91.1% (169)Foreign-born:
96.8% (166)
Other race - Speak only English Native:
41.0% (650)Foreign-born:
2.8% (23)
Other race - Speak another language Native:
59.1% (937)Foreign-born:
97.0% (784)
Two or more races - Speak another language Native:
49.2% (552)Foreign-born:
96.2% (592)
White alone - Speak only English Native:
96.8% (2,153)Foreign-born:
45.0% (11)
White alone - Speak another language Native:
3.1% (68)Foreign-born:
55.7% (14)
Hispanic or Latino - Speak another language Native:
43.3% (1,653)Foreign-born:
99.5% (1,859)
Foreign-born residents in West Haverstraw 2,609 residents are foreign born (22.2% Latin America ).
This city:
24.4%New York:
22.6%
Marital status for residents in West Haverstraw Marital status - White (Caucasian) population 15 years and over
Males 45.3% Never married44.7% Now married0.3% Separated2.1% Widowed7.5% DivorcedFemales 18.6% Never married44.1% Now married1.9% Separated20.3% Widowed15.1% DivorcedWomen who gave birth in the past 12 months Now married:
100.0% (28)Unmarried:
0.0% (0)
Women who did not give birth in the past 12 months Now married:
40.1% (340)Unmarried:
59.9% (508)
Marital status - Black or African American population 15 years and over
Males 49.3% Never married28.5% Now married1.5% Separated10.8% Widowed9.9% DivorcedFemales 41.1% Never married45.6% Now married0.0% Separated13.3% Widowed0.0% DivorcedWomen who did not give birth in the past 12 months Now married:
49.1% (116)Unmarried:
50.9% (120)
Marital status - American Indian / Alaska Native population 15 years and over
Males 0.0% Never married100.0% Now married0.0% Separated0.0% Widowed0.0% DivorcedFemales 0.0% Never married100.0% Now married0.0% Separated0.0% Widowed0.0% DivorcedWomen who gave birth in the past 12 months Now married:
100.0% (31)Unmarried:
0.0% (0)
Marital status - Asian population 15 years and over
Males 30.8% Never married69.2% Now married0.0% Separated0.0% Widowed0.0% DivorcedFemales 12.2% Never married54.5% Now married0.0% Separated33.3% Widowed0.0% DivorcedWomen who did not give birth in the past 12 months Now married:
64.3% (27)Unmarried:
35.7% (15)
Marital status - Other race population 15 years and over
Males 44.3% Never married47.8% Now married2.2% Separated3.2% Widowed2.5% DivorcedFemales 35.4% Never married58.9% Now married5.7% Separated0.0% Widowed0.0% DivorcedWomen who gave birth in the past 12 months Now married:
100.0% (44)Unmarried:
0.0% (0)
Women who did not give birth in the past 12 months Now married:
53.7% (342)Unmarried:
46.3% (295)
Marital status - Two or more races population 15 years and over
Males 29.3% Never married62.0% Now married0.0% Separated0.0% Widowed8.8% DivorcedFemales 65.8% Never married19.1% Now married0.0% Separated7.4% Widowed7.7% DivorcedWomen who gave birth in the past 12 months Now married:
0.0% (0)Unmarried:
100.0% (119)
Women who did not give birth in the past 12 months Now married:
11.5% (61)Unmarried:
88.5% (469)
Marital status - White alone, not Hispanic / Latino population 15 years and over
Males 44.0% Never married43.0% Now married0.6% Separated4.1% Widowed8.2% DivorcedFemales 8.3% Never married38.7% Now married0.8% Separated30.0% Widowed22.2% DivorcedWomen who gave birth in the past 12 months Now married:
100.0% (29)Unmarried:
0.0% (0)
Women who did not give birth in the past 12 months Now married:
29.8% (122)Unmarried:
70.2% (288)
Marital status - Hispanic or Latino population 15 years and over
Males 41.7% Never married50.8% Now married0.9% Separated1.3% Widowed5.3% DivorcedFemales 43.5% Never married48.4% Now married3.5% Separated2.8% Widowed1.7% DivorcedWomen who gave birth in the past 12 months Now married:
44.8% (67)Unmarried:
55.2% (83)
Women who did not give birth in the past 12 months Now married:
42.7% (633)Unmarried:
57.3% (850)
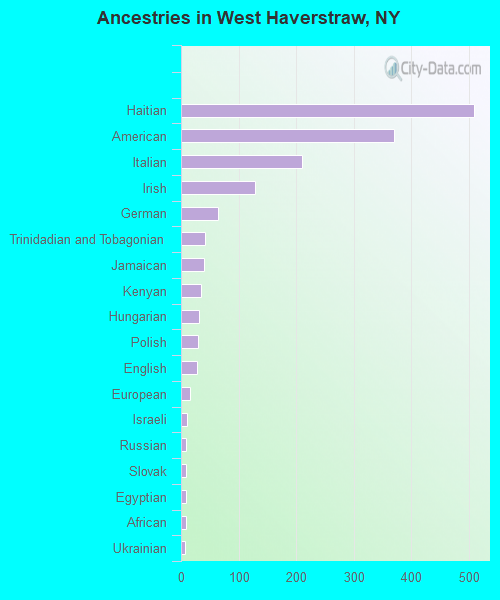
Ancestries in West Haverstraw
510 10.5% Haitian370 7.6% American210 4.3% Italian128 2.6% Irish64 1.3% German42 0.9% Trinidadian and Tobagonian40 0.8% Jamaican35 0.7% Kenyan32 0.7% Hungarian30 0.6% Polish27 0.6% English15 0.3% European11 0.2% Israeli9 0.2% Russian9 0.2% Slovak8 0.2% Egyptian8 0.2% African7 0.1% Ukrainian2 0.04% Slavic1 0.02% Pennsylvania German
Geographical mobility in West Haverstraw Same house 1 year ago 3,968 96.9% White (Caucasian)1,405 84.8% Black or African American114 100.0% American Indian / Alaska Native342 88.2% Asian2,650 100.0% Other race1,561 83.2% Two or more races2,207 96.8% White alone, not Hispanic / Latino5,941 98.5% Hispanic or LatinoMoved within same county 121 3.0% White / Caucasian17 1.0% Black or African American43 11.2% Asian44 1.7% Other race270 14.4% Two or more races54 2.4% White alone, not Hispanic / Latino362 6.0% Hispanic or LatinoMoved within same state 18 0.4% White / Caucasian247 14.9% Black or African American50 1.9% Other race41 2.2% Two or more races17 0.7% White alone, not Hispanic / Latino46 0.8% Hispanic or LatinoMoved from different state 1 0.0% White / Caucasian2 0.1% White alone, not Hispanic / LatinoMoved from abroad 57 3.4% Black or African American
Children Nativity (place of birth) in West Haverstraw
Children under 6 years - Living with two parents Both parents native 124 100.0% NativeBoth parents foreign-born 201 100.0% NativeOne native, one foreign-born parent 106 100.0% NativeChildren under 6 years - Living with one parent Native parent 34 100.0% NativeForeign-born parent 378 100.0% NativeChildren 6 to 17 years - Living with two parents Both parents native 343 100.0% NativeBoth parents foreign-born 244 82.7% Native51 17.3% Foreign-bornOne native, one foreign-born parent 273 100.0% NativeChildren 6 to 17 years - Living with one parent Native parent 561 100.0% NativeForeign-born parent 47 47.2% Native52 52.8% Foreign-born
Grandparents responsible for own grandchildren in West Haverstraw
Grandparents (30 to 59 years) White / Caucasian 80 100.0% Not responsible for grandchildrenOther race 12 100.0% Not responsible for grandchildrenHispanic or Latino 122 100.0% Not responsible for grandchildren
Grandparents (60 years and over) White / Caucasian 125 100.0% Not responsible for grandchildrenOther race 29 100.0% Not responsible for grandchildrenHispanic or Latino 30 100.0% Not responsible for grandchildren