Races in West Warwick, Rhode Island (RI) Detailed Stats
Ancestries, Foreign-born residents, place of birth

Recent posts about races in West Warwick, Rhode Island on our local forum with over 2,400,000 registered users:

7.1% of West Warwick, RI residents are foreign-born (3.7% born in Europe, 1.6% born in Latin America, 1.3% born in Asia), which is 96.1% less than the foreign-born rate of 14.0% across the entire state of Rhode Island.
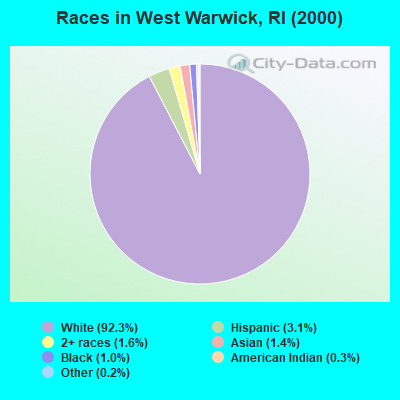
Race distribution in West Warwick

- 27,30692.3%White alone
- 9183.1%Hispanic
- 4851.6%Two or more races
- 4071.4%Asian alone
- 3061.0%Black alone
- 920.3%American Indian alone
- 600.2%Other race alone
- 70.02%Native Hawaiian and Other
Pacific Islander alone
2000
2022
-
- 858,43381.9%White alone
- 90,8208.7%Hispanic
- 41,9224.0%Black alone
- 23,4162.2%Asian alone
- 20,8162.0%Two or more races
- 8,4110.8%Other race alone
- 4,1810.4%American Indian alone
- 3200.03%Native Hawaiian and Other
Pacific Islander alone

-
- 745,82568.2%White alone
- 191,97917.6%Hispanic
- 56,7385.2%Two or more races
- 51,3264.7%Black alone
- 37,2343.4%Asian alone
- 9,5140.9%Other race alone
- 9780.09%American Indian alone
- 1400.01%Native Hawaiian and Other
Pacific Islander alone

Income and house value in West Warwick
- Median household income in 2022
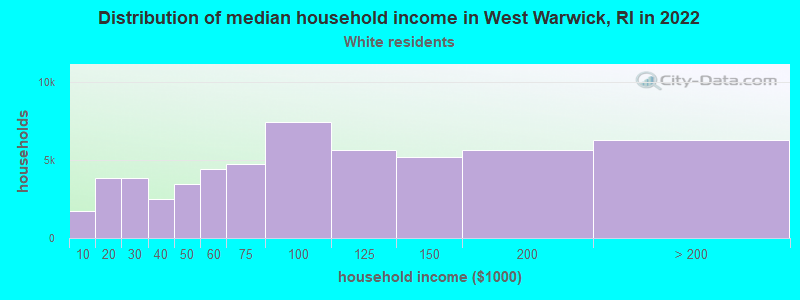
- $67,916White non-Hispanic householders
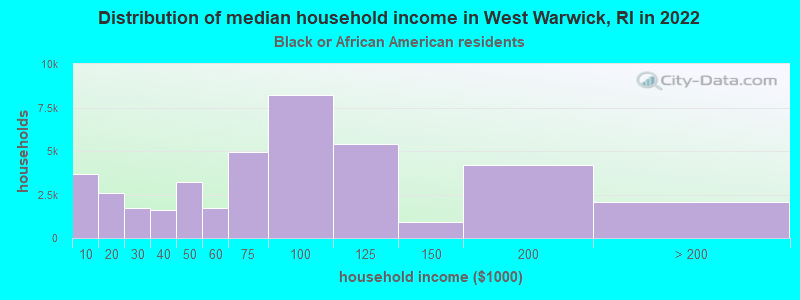
- $112,020Black householders
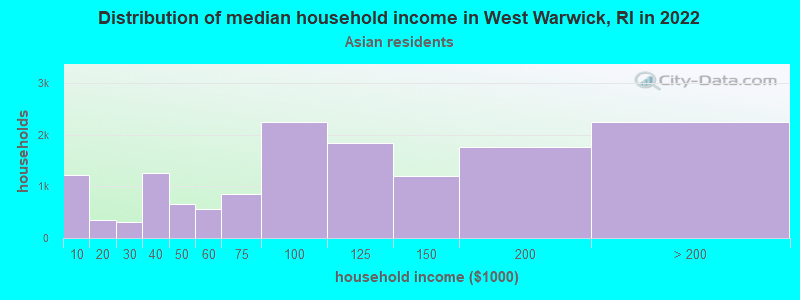
- $73,623Asian householders
- $96,690Some other race householders
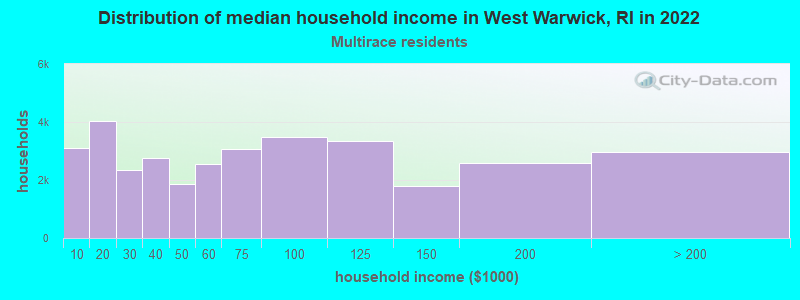
- $32,003Two or more races householders
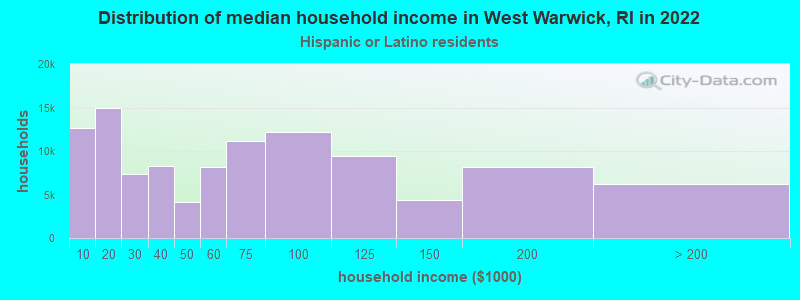
- $89,130Hispanic or Latino race householders
- Median 2022 house value
- $315,884White Non-Hispanic householders
- $326,327Black or African American householders
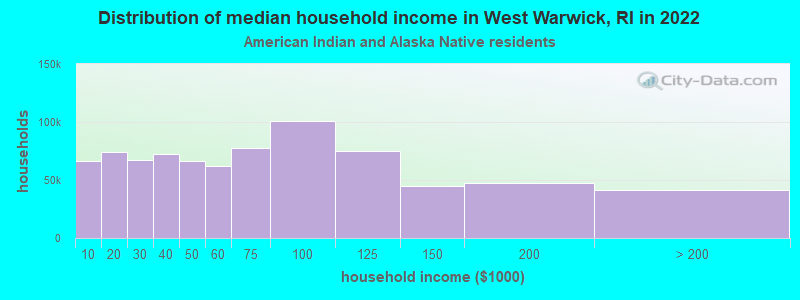
- $217,551American Indian or Alaska Native householders
- $327,487Asian householders
- $344,601Some other race householders
- $326,327Two or more races householders
- $313,273Hispanic or Latino householders
Household income for White non-Hispanic householders
Household income for Black householders
Household income for American Indian and Alaska Native householders
Household income for Asian householders
Household income for Two or more races householders
Household income for Hispanic or Latino race householders
Foreign-born residents in West Warwick
2,112 residents are foreign born (3.7% Europe, 1.6% Latin America, 1.3% Asia).
| This city: | 7.1% |
| Rhode Island: | 11.4% |
Ancestries in West Warwick

- 6,70318.2%Italian
- 5,64615.4%Irish
- 5,47314.9%French
- 3,5159.6%English
- 3,0878.4%Other
- 2,9588.0%Portuguese
- 2,7797.6%French Canadian
- 1,5914.3%Polish
- 1,5614.2%German
- 6661.8%United States
- 6581.8%Swedish
- 4441.2%Scottish
- 3300.9%Scotch-Irish
- 1640.4%Dutch
- 1550.4%Arab
- 1330.4%Subsaharan African
- 1260.3%Russian
- 1170.3%Hungarian
- 1140.3%Norwegian
- 1000.3%Lithuanian
- 890.2%Slovak
- 770.2%Welsh
- 650.2%Danish
- 630.2%Czech
- 550.1%Greek
- 500.1%Ukrainian
- 220.06%Swiss
- 170.05%West Indian

Zip codes: 02893.