Races in Wheatfield, New York (NY) Detailed Stats
Ancestries, Foreign-born residents, place of birth
3.9% of Wheatfield, NY residents are foreign-born (2.1% born in Europe, 1.3% born in North America), which is 462.4% less than the foreign-born rate of 22.0% across the entire state of New York.
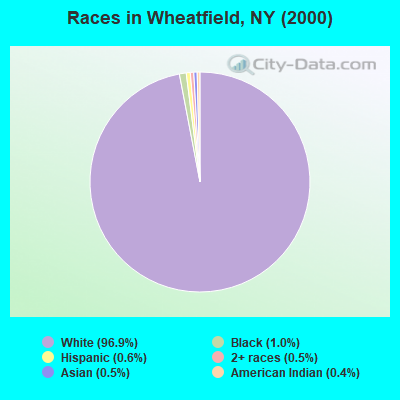
Race distribution in Wheatfield

- 13,65496.9%White alone
- 1391.0%Black alone
- 820.6%Hispanic
- 690.5%Asian alone
- 750.5%Two or more races
- 560.4%American Indian alone
- 60.04%Other race alone
- 50.04%Native Hawaiian and Other
Pacific Islander alone
2000
2022
-
- 11,760,98162.0%White alone
- 2,867,58315.1%Hispanic
- 2,812,62314.8%Black alone
- 1,035,9265.5%Asian alone
- 366,1161.9%Two or more races
- 75,4990.4%Other race alone
- 52,4990.3%American Indian alone
- 5,2300.03%Native Hawaiian and Other
Pacific Islander alone

-
- 10,408,93352.9%White alone
- 3,867,29919.7%Hispanic
- 2,633,84013.4%Black alone
- 1,776,2869.0%Asian alone
- 732,6703.7%Two or more races
- 216,1101.1%Other race alone
- 35,0820.2%American Indian alone
- 6,9310.04%Native Hawaiian and Other
Pacific Islander alone

Income and house value in Wheatfield
- Median household income in 2022
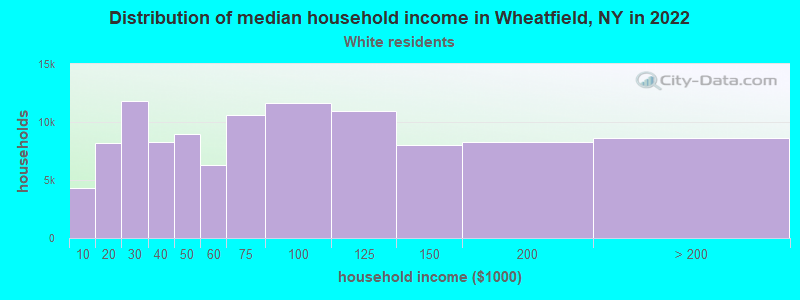
- $85,961White non-Hispanic householders
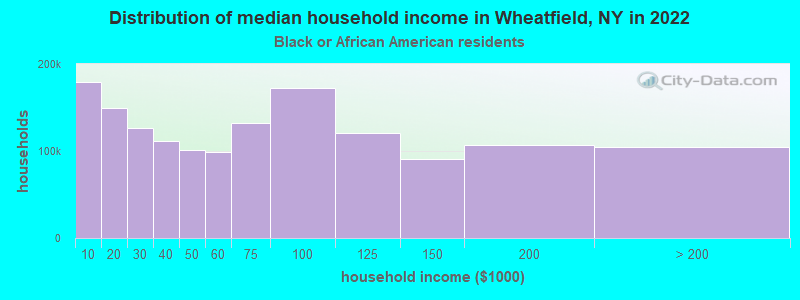
- $102,098Black householders
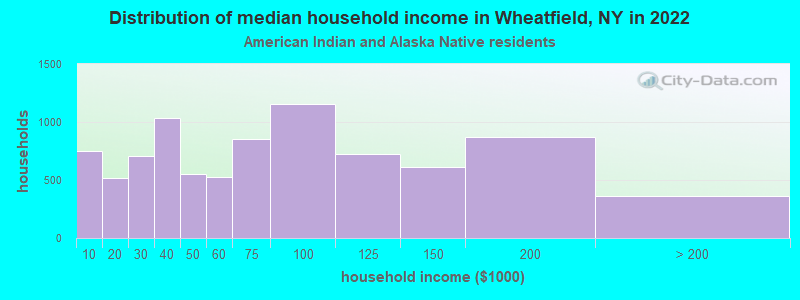
- $49,316American Indian and Alaska Native householders
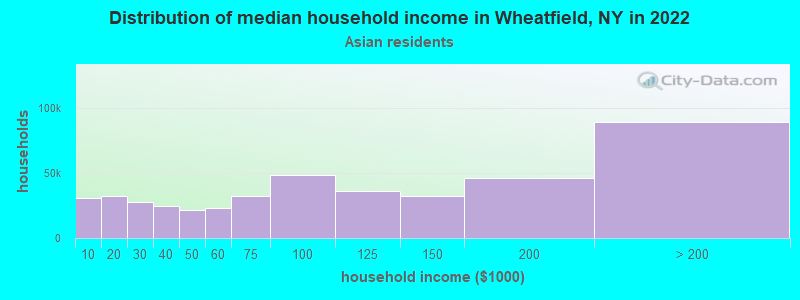
- $89,713Asian householders
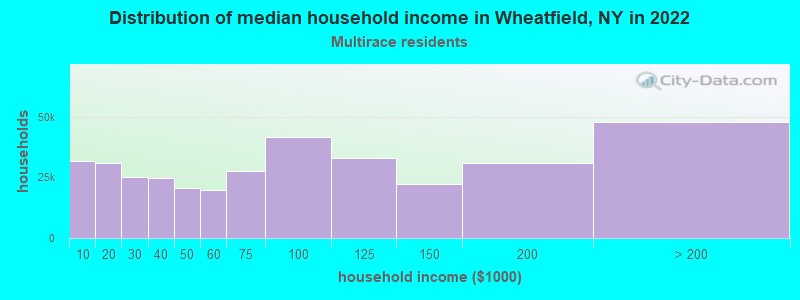
- $70,645Two or more races householders
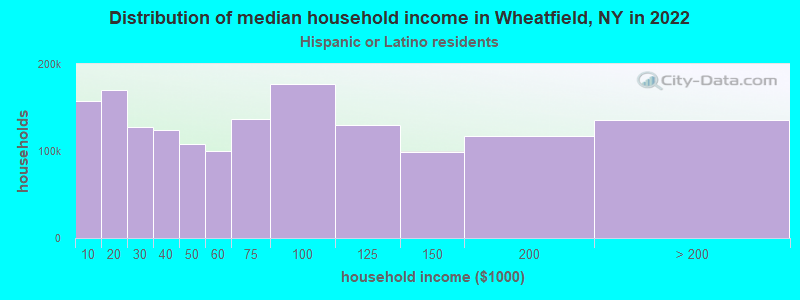
- $144,284Hispanic or Latino race householders
- Median 2022 house value
- $279,321White Non-Hispanic householders
- $299,443Black or African American householders
- $492,525Asian householders
- $332,741Two or more races householders
- $227,577Hispanic or Latino householders
Household income for White non-Hispanic householders
Household income for Black householders
Household income for American Indian and Alaska Native householders
Household income for Asian householders
Household income for Two or more races householders
Household income for Hispanic or Latino race householders
Foreign-born residents in Wheatfield
551 residents are foreign born (2.1% Europe, 1.3% North America).
| This city: | 3.9% |
| New York: | 20.4% |
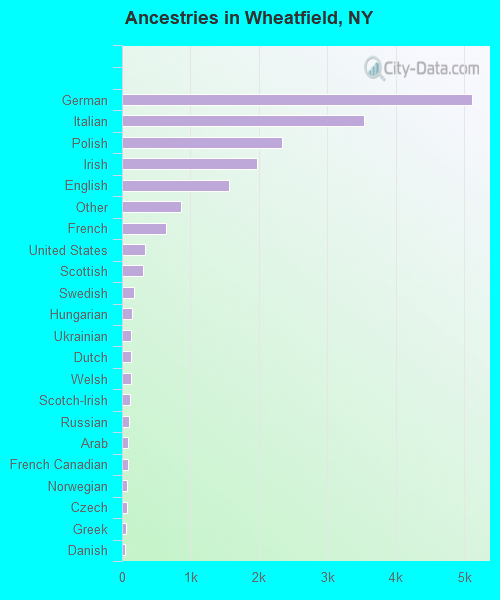
Ancestries in Wheatfield

- 5,10328.2%German
- 3,52619.5%Italian
- 2,33912.9%Polish
- 1,97710.9%Irish
- 1,5568.6%English
- 8644.8%Other
- 6423.5%French
- 3331.8%United States
- 3091.7%Scottish
- 1710.9%Swedish
- 1520.8%Hungarian
- 1340.7%Ukrainian
- 1310.7%Dutch
- 1250.7%Welsh
- 1200.7%Scotch-Irish
- 1010.6%Russian
- 890.5%Arab
- 830.5%French Canadian
- 700.4%Norwegian
- 690.4%Czech
- 540.3%Greek
- 500.3%Danish
- 460.3%Lithuanian
- 400.2%Swiss
- 210.1%Slovak
- 90.05%Portuguese
Zip codes: 14304.