Races in Wheaton, Wisconsin (WI) Detailed Stats
Ancestries, Foreign-born residents, place of birth
1.3% of Wheaton, WI residents are foreign-born , which is 294.3% less than the foreign-born rate of 5.0% across the entire state of Wisconsin.
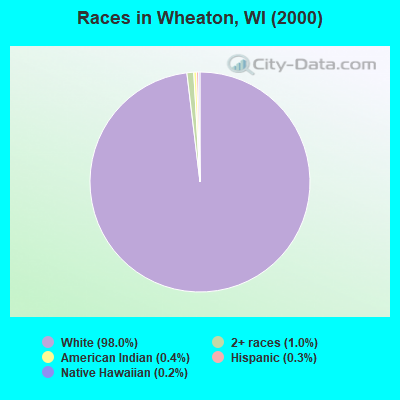
Race distribution in Wheaton

- 2,31998.0%White alone
- 241.0%Two or more races
- 90.4%American Indian alone
- 60.3%Hispanic
- 40.2%Native Hawaiian and Other
Pacific Islander alone - 20.08%Black alone
- 20.08%Asian alone
2000
2022
-
- 4,681,63087.3%White alone
- 300,2455.6%Black alone
- 192,9213.6%Hispanic
- 87,9951.6%Asian alone
- 51,9211.0%Two or more races
- 43,9800.8%American Indian alone
- 3,6370.07%Other race alone
- 1,3460.03%Native Hawaiian and Other
Pacific Islander alone

-
- 4,654,03179.0%White alone
- 447,0227.6%Hispanic
- 345,6785.9%Black alone
- 217,5323.7%Two or more races
- 172,2422.9%Asian alone
- 33,7620.6%American Indian alone
- 19,6800.3%Other race alone
- 2,5920.04%Native Hawaiian and Other
Pacific Islander alone

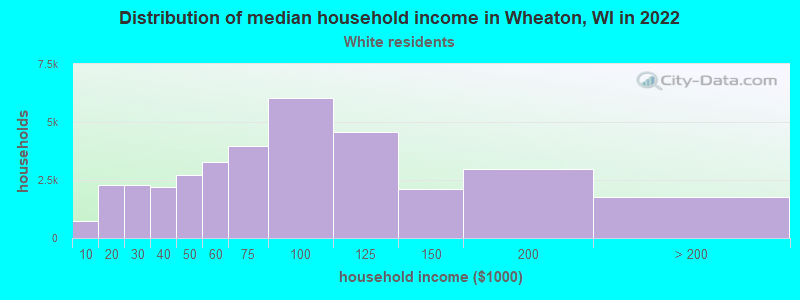
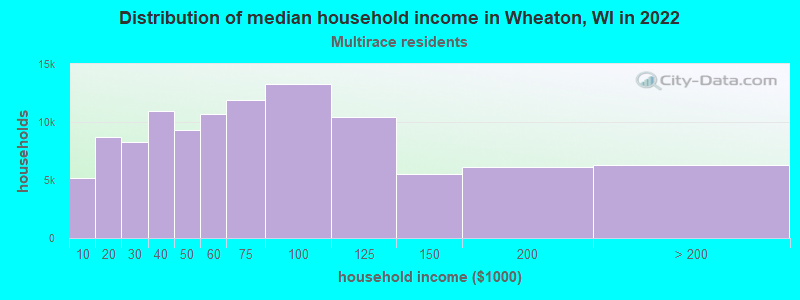
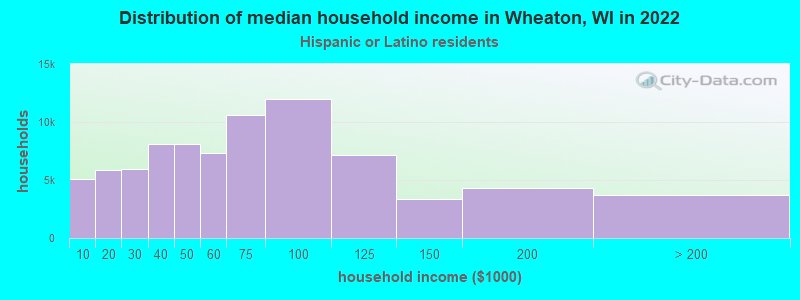
Income and house value in Wheaton
- Median household income in 2022
- $99,415White non-Hispanic householders
- $74,586Two or more races householders
- $124,003Hispanic or Latino race householders
- Median 2022 house value
- $276,471White Non-Hispanic householders
- $364,126Two or more races householders
Household income for White non-Hispanic householders
Household income for Two or more races householders
Household income for Hispanic or Latino race householders
Foreign-born residents in Wheaton
30 residents are foreign born
| This city: | 1.3% |
| Wisconsin: | 3.6% |
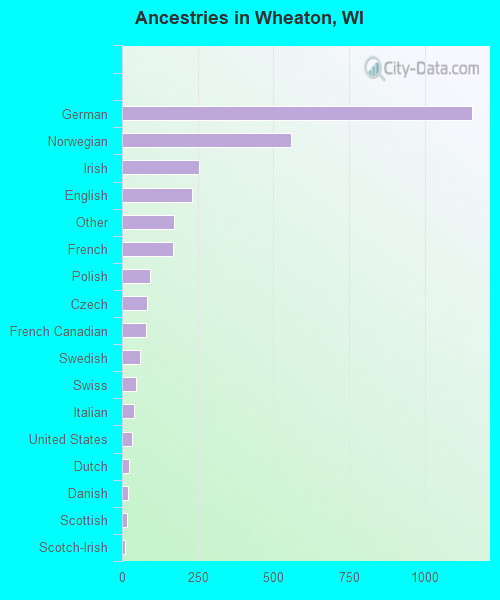
Ancestries in Wheaton

- 1,15537.7%German
- 56018.3%Norwegian
- 2548.3%Irish
- 2327.6%English
- 1715.6%Other
- 1695.5%French
- 943.1%Polish
- 812.6%Czech
- 792.6%French Canadian
- 591.9%Swedish
- 471.5%Swiss
- 391.3%Italian
- 341.1%United States
- 230.8%Dutch
- 190.6%Danish
- 180.6%Scottish
- 110.4%Scotch-Irish
- 40.1%Welsh
- 30.10%Greek
- 30.10%Hungarian
- 30.10%Russian
- 30.10%Ukrainian
Zip codes: 54729.