Races in Willington, Connecticut (CT) Detailed Stats
Ancestries, Foreign-born residents, place of birth
6.4% of Willington, CT residents are foreign-born (3.2% born in Asia, 2.1% born in Europe), which is 133.4% less than the foreign-born rate of 15.0% across the entire state of Connecticut.
Race distribution in Willington

- 5,53192.8%White alone
- 1803.0%Asian alone
- 1081.8%Hispanic
- 641.1%Two or more races
- 540.9%Black alone
- 120.2%Other race alone
- 60.1%American Indian alone
- 40.07%Native Hawaiian and Other
Pacific Islander alone
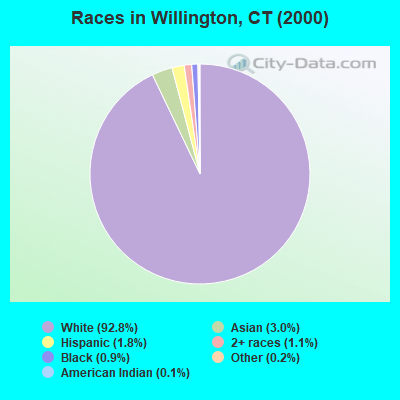
2000
2022
-
- 2,638,84577.5%White alone
- 320,3239.4%Hispanic
- 295,5718.7%Black alone
- 81,5642.4%Asian alone
- 52,8961.6%Two or more races
- 8,1410.2%Other race alone
- 7,2670.2%American Indian alone
- 9580.03%Native Hawaiian and Other
Pacific Islander alone

-
- 2,246,91362.0%White alone
- 658,97818.2%Hispanic
- 353,9739.8%Black alone
- 172,9294.8%Asian alone
- 159,6314.4%Two or more races
- 29,7610.8%Other race alone
- 3,4280.09%American Indian alone
- 5920.02%Native Hawaiian and Other
Pacific Islander alone

Income and house value in Willington
- Median household income in 2022
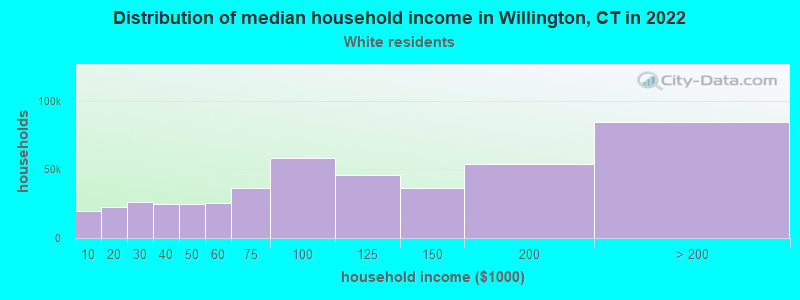
- $88,736White non-Hispanic householders
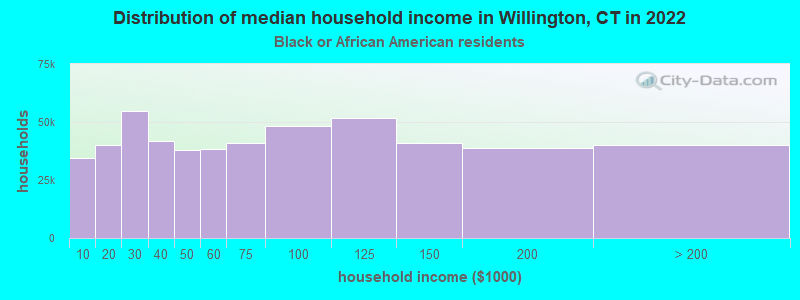
- $198,920Black householders
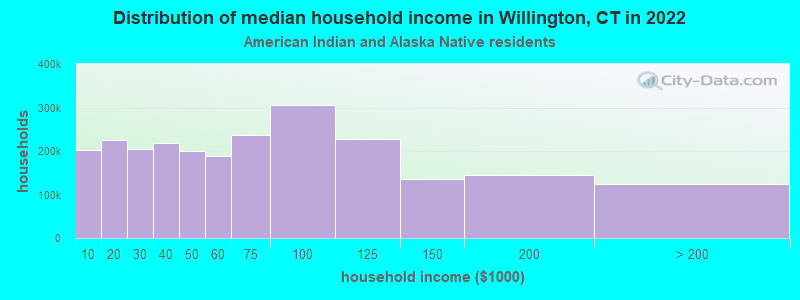
- $80,416American Indian and Alaska Native householders
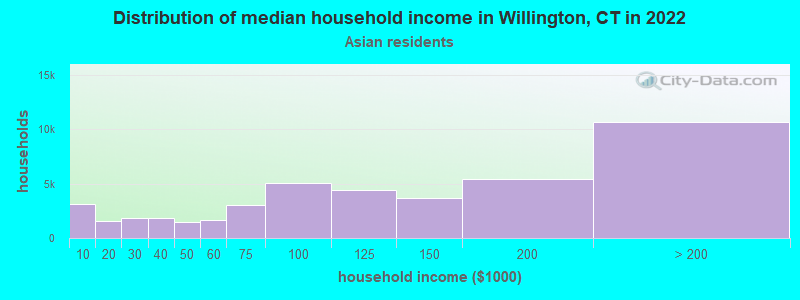
- $99,088Asian householders
- $4,418Some other race householders
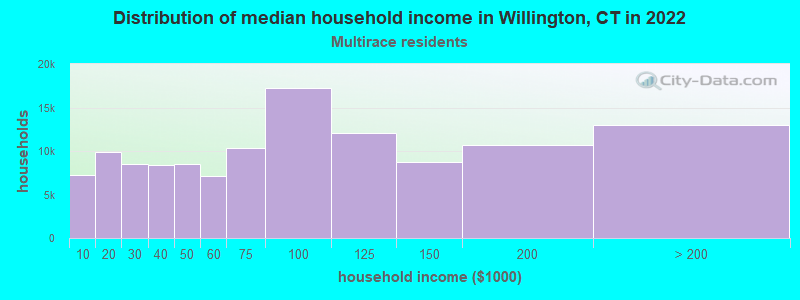
- $78,895Two or more races householders
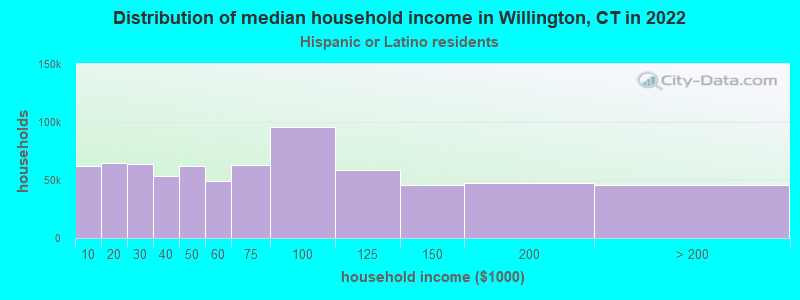
- $174,908Hispanic or Latino race householders
- Median 2022 house value
- $303,745White Non-Hispanic householders
- $486,425Black or African American householders
- $297,260American Indian or Alaska Native householders
- $264,183Asian householders
- $486,425Hispanic or Latino householders
Household income for White non-Hispanic householders
Household income for Black householders
Household income for American Indian and Alaska Native householders
Household income for Asian householders
Household income for Two or more races householders
Household income for Hispanic or Latino race householders
Foreign-born residents in Willington
383 residents are foreign born (3.2% Asia, 2.1% Europe).
| This city: | 6.4% |
| Connecticut: | 10.9% |
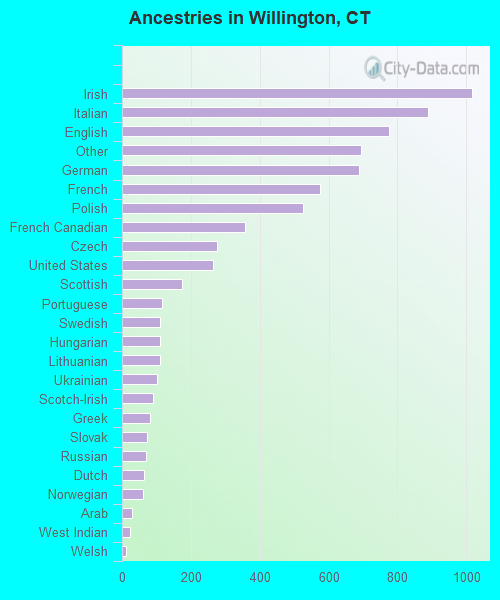
Ancestries in Willington

- 1,01513.9%Irish
- 88912.2%Italian
- 77610.6%English
- 6939.5%Other
- 6879.4%German
- 5747.9%French
- 5257.2%Polish
- 3574.9%French Canadian
- 2753.8%Czech
- 2643.6%United States
- 1742.4%Scottish
- 1151.6%Portuguese
- 1111.5%Swedish
- 1101.5%Hungarian
- 1101.5%Lithuanian
- 1031.4%Ukrainian
- 911.2%Scotch-Irish
- 801.1%Greek
- 741.0%Slovak
- 701.0%Russian
- 630.9%Dutch
- 610.8%Norwegian
- 280.4%Arab
- 230.3%West Indian
- 120.2%Welsh
- 70.10%Swiss
Zip codes: 06279.