Races in Williston, North Dakota (ND) Detailed Stats
Ancestries, Foreign-born residents, place of birth
Settings
X


Recent posts about races in Williston, North Dakota on our local forum with over 2,400,000 registered users:

Latest news about races in Williston, ND collected exclusively by city-data.com from local newspapers, TV, and radio stations
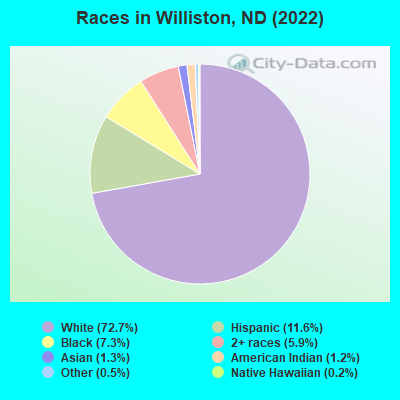
According to 2022 data, the most numerous races in Williston, ND are White alone (20,251 residents), Hispanic (3,244 residents), and American Indian alone (344 residents). 87.7% of Williston residents speak English at home. 11.4% of Williston, ND residents are foreign-born (4.3% born in Latin America, 3.5% born in Africa, 1.9% born in Asia), which is 65.0% greater than the foreign-born rate of 4.0% across the entire state of North Dakota.
Race distribution in Williston
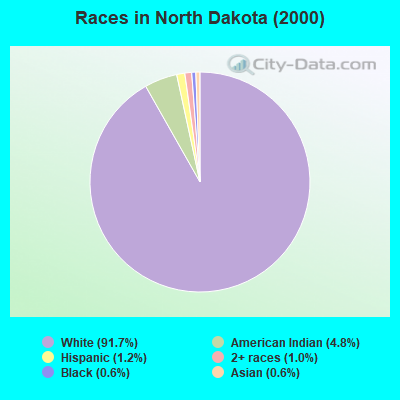
2000
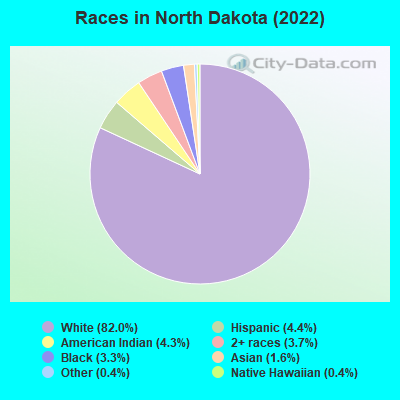
2022

- 11,62292.9%White alone
- 4533.6%American Indian alone
- 2361.9%Two or more races
- 1541.2%Hispanic
- 300.2%Asian alone
- 150.1%Black alone
- 20.02%Native Hawaiian and Other
Pacific Islander alone

-
- 20,25172.7%White alone
- 3,24411.6%Hispanic
- 2,0327.3%Black alone
- 1,6545.9%Two or more races
- 3691.3%Asian alone
- 3441.2%American Indian alone
- 1280.5%Other race alone
- 510.2%Native Hawaiian and Other
Pacific Islander alone
2000
2022
-
- 589,14991.7%White alone
- 30,7724.8%American Indian alone
- 7,7861.2%Hispanic
- 6,6661.0%Two or more races
- 3,7610.6%Black alone
- 3,5660.6%Asian alone
- 2820.04%Other race alone
- 2180.03%Native Hawaiian and Other
Pacific Islander alone
-
- 639,29782.0%White alone
- 34,2334.4%Hispanic
- 33,2524.3%American Indian alone
- 28,8313.7%Two or more races
- 25,4263.3%Black alone
- 12,2711.6%Asian alone
- 3,2060.4%Other race alone
- 2,7450.4%Native Hawaiian and Other
Pacific Islander alone
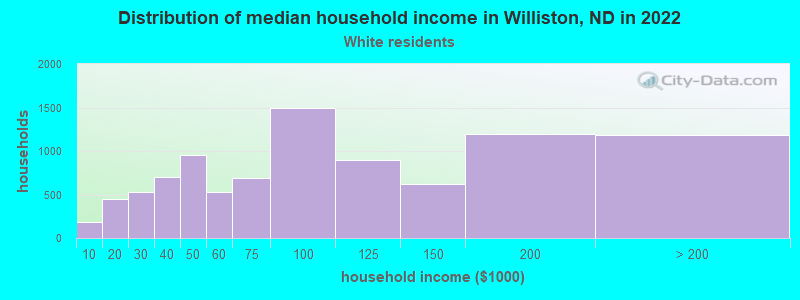
Income and house value in Williston
- Median household income in 2022
- $85,567White non-Hispanic householders
- $49,109Black householders
- $28,839American Indian and Alaska Native householders
- $145,238Asian householders
- $73,172Hispanic or Latino race householders
- Median 2022 house value
- $268,593White Non-Hispanic householders
- $205,528American Indian or Alaska Native householders
- $79,398Asian householders
- $341,640Two or more races householders
- $340,279Hispanic or Latino householders
Household income for White non-Hispanic householders
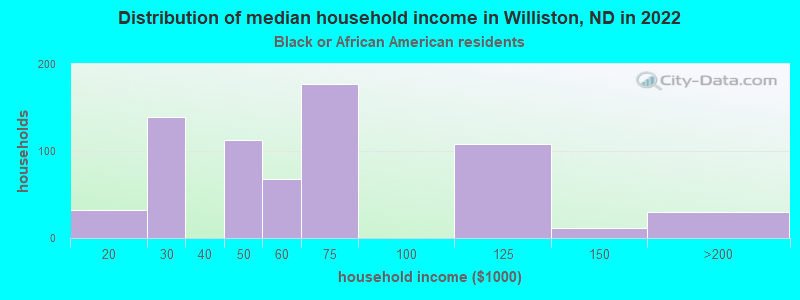
Household income for Black householders
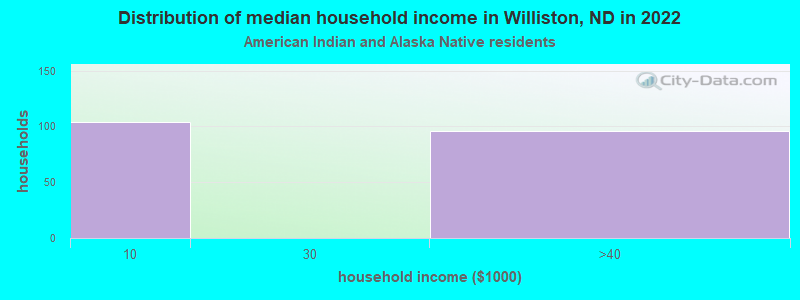
Household income for American Indian and Alaska Native householders
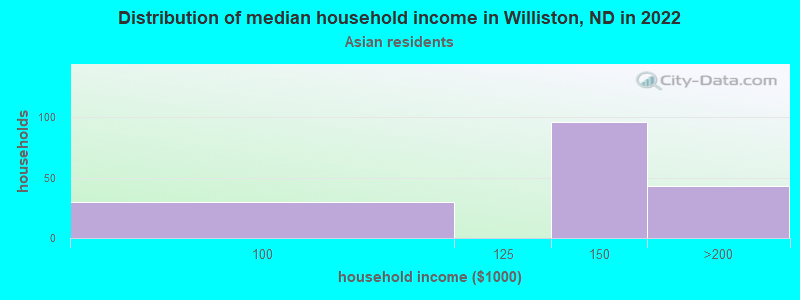
Household income for Asian householders
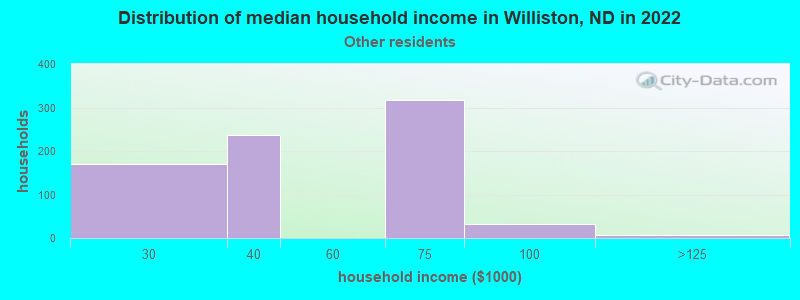
Household income for Some other race householders
Household income for Two or more races householders
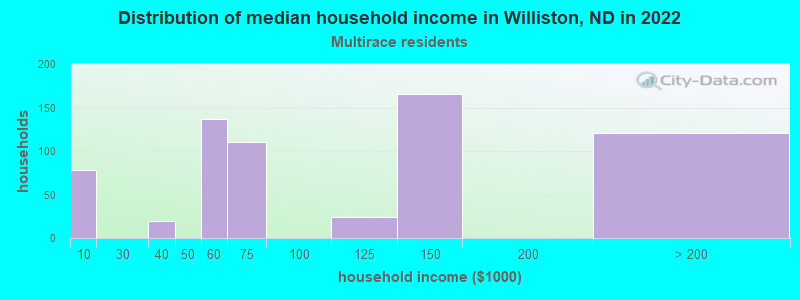
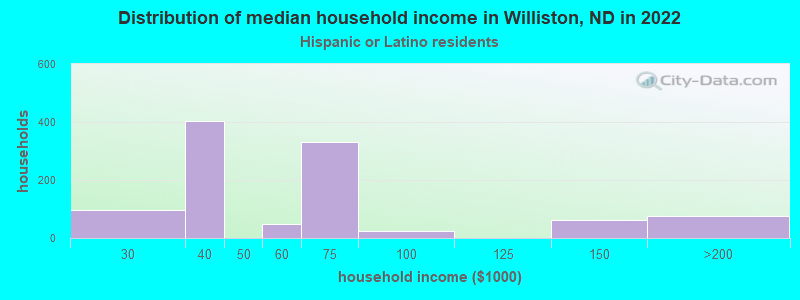
Household income for Hispanic or Latino race householders
Median age by race in Williston
- 32.4Median age for White residents
- 34.0Males
- 30.9Females
- 36.2Median age for Black or African American residents
- 34.0Males
- 30.9Females
- 44.1Median age for American Indian / Alaska Native residents
- 42.3Males
- 53.2Females
- 33.2Median age for Asian residents
- 42.8Males
- 23.7Females
- -730,392,156.1Median age for Native Hawaiian / Pacific Islander residents
- -553,672,315.8Males
- -695,847,361.8Females
- 31.6Median age for Other race residents
- 31.0Males
- 30.9Females
- 26.4Median age for Two or more races residents
- 26.4Males
- 20.2Females
- 32.9Median age for White alone residents
- 34.5Males
- 31.0Females
- 30.9Median age for Hispanic or Latino residents
- 25.3Males
- 32.6Females
Owner/renter occupied households by race in Williston
- House owners and renters - White residents
- 4,75851.6%Owner occupied
- 4,46548.4%Renter occupied
- House owners and renters - Black or African American residents
- 21629.0%Owner occupied
- 52871.0%Renter occupied
- House owners and renters - American Indian / Alaska Native residents
- 21992.4%Owner occupied
- 187.6%Renter occupied
- House owners and renters - Asian residents
- 9356.7%Owner occupied
- 7143.3%Renter occupied
- House owners and renters - Native Hawaiian / Pacific Islander residents
- 16100.0%Renter occupied
- House owners and renters - Other race residents
- 394.9%Owner occupied
- 75795.1%Renter occupied
- House owners and renters - Two or more races residents
- 33250.1%Owner occupied
- 33149.9%Renter occupied
- House owners and renters - White alone residents
- 4,76952.7%Owner occupied
- 4,28347.3%Renter occupied
- House owners and renters - Hispanic or Latino residents
- 987100.0%Renter occupied
Language usage in Williston
- English speakers - Total
- 87.7% of residents of Williston speak English at home.
- 7.6% of residents speak Spanish at home
- 1,18160.7%Speak English very well
- 76439.3%Speak English less than very well
- 5.6% of residents speak other language at home
- 97167.8%Speak English very well
- 46232.2%Speak English less than very well
- English speakers - Born in the United States
- 95.2% of residents of Williston speak English at home.
- 2.6% of residents speak Spanish at home
- 31189.6%Speak English very well
- 3610.4%Speak English less than very well
- 1.6% of residents speak other language at home
- 14971.0%Speak English very well
- 6129.0%Speak English less than very well
- English speakers - Native, born elsewhere
- 83.7% of residents of Williston speak English at home.
- 9.5% of residents speak Spanish at home
- 25100.0%Speak English very well
- English speakers - Foreign-born
- 25.9% of residents of Williston speak English at home.
- 42.0% of residents speak Spanish at home
- 64348.7%Speak English very well
- 67651.3%Speak English less than very well
- 34.7% of residents speak other language at home
- 71966.1%Speak English very well
- 36933.9%Speak English less than very well
White (Caucasian) - Speak only English
| Native: | 97.2% (18,510) |
| Foreign-born: | 56.6% (301) |
White (Caucasian) - Speak another language
| Native: | 2.9% (545) |
| Foreign-born: | 43.9% (233) |
Black or African American - Speak only English
| Native: | 100.0% (826) |
| Foreign-born: | 35.0% (320) |
Asian - Speak another language
| Native: | 100.0% (8) |
| Foreign-born: | 75.5% (251) |
Native Hawaiian / Pacific Islander - Speak only English
| Native: | 99.5% (14) |
| Foreign-born: | 96.3% (14) |
Other race - Speak another language
| Native: | 25.2% (242) |
| Foreign-born: | 99.1% (1,570) |
White alone - Speak only English
| Native: | 98.4% (18,034) |
| Foreign-born: | 72.8% (309) |
White alone - Speak another language
| Native: | 1.5% (273) |
| Foreign-born: | 30.3% (128) |
Hispanic or Latino - Speak another language
| Native: | 34.3% (579) |
| Foreign-born: | 100.0% (1,313) |
Foreign-born residents in Williston
3,187 residents are foreign born (4.3% Latin America, 3.5% Africa, 1.9% Asia).
| This city: | 11.4% |
| North Dakota: | 4.6% |


Marital status for residents in Williston
Marital status - White (Caucasian) population 15 years and over
- Males
- 36.5%Never married
- 42.4%Now married
- 0.3%Separated
- 1.1%Widowed
- 19.7%Divorced
- Females
- 29.4%Never married
- 51.0%Now married
- 1.4%Separated
- 7.3%Widowed
- 10.9%Divorced
Women who gave birth in the past 12 months
| Now married: | 92.0% (127) |
| Unmarried: | 8.0% (11) |
Women who did not give birth in the past 12 months
| Now married: | 51.7% (2,601) |
| Unmarried: | 48.3% (2,433) |
Marital status - Black or African American population 15 years and over
- Males
- 25.6%Never married
- 60.2%Now married
- 12.0%Separated
- 0.0%Widowed
- 2.2%Divorced
- Females
- 48.7%Never married
- 47.0%Now married
- 0.0%Separated
- 0.0%Widowed
- 4.4%Divorced
Women who did not give birth in the past 12 months
| Now married: | 47.0% (265) |
| Unmarried: | 53.0% (299) |
Marital status - American Indian / Alaska Native population 15 years and over
- Males
- 11.2%Never married
- 14.3%Now married
- 0.0%Separated
- 0.0%Widowed
- 74.5%Divorced
- Females
- 4.8%Never married
- 8.5%Now married
- 0.0%Separated
- 0.0%Widowed
- 86.7%Divorced
Women who gave birth in the past 12 months
| Now married: | 0.0% (0) |
| Unmarried: | 100.0% (7) |
Women who did not give birth in the past 12 months
| Now married: | 0.0% (0) |
| Unmarried: | 100.0% (79) |
Marital status - Asian population 15 years and over
- Males
- 0.0%Never married
- 100.0%Now married
- 0.0%Separated
- 0.0%Widowed
- 0.0%Divorced
- Females
- 41.5%Never married
- 58.5%Now married
- 0.0%Separated
- 0.0%Widowed
- 0.0%Divorced
Women who gave birth in the past 12 months
| Now married: | 100.0% (33) |
| Unmarried: | 0.0% (0) |
Women who did not give birth in the past 12 months
| Now married: | 47.2% (89) |
| Unmarried: | 52.8% (100) |
Marital status - Other race population 15 years and over
- Males
- 46.2%Never married
- 51.3%Now married
- 0.0%Separated
- 2.5%Widowed
- 0.0%Divorced
- Females
- 0.0%Never married
- 77.6%Now married
- 0.0%Separated
- 0.0%Widowed
- 22.4%Divorced
Women who did not give birth in the past 12 months
| Now married: | 100.0% (566) |
| Unmarried: | 0.0% (0) |
Marital status - Two or more races population 15 years and over
- Males
- 31.9%Never married
- 67.6%Now married
- 0.0%Separated
- 0.0%Widowed
- 0.4%Divorced
- Females
- 43.0%Never married
- 4.0%Now married
- 0.0%Separated
- 7.0%Widowed
- 46.0%Divorced
Women who did not give birth in the past 12 months
| Now married: | 0.0% (0) |
| Unmarried: | 100.0% (303) |
Marital status - White alone, not Hispanic / Latino population 15 years and over
- Males
- 36.7%Never married
- 42.4%Now married
- 0.3%Separated
- 1.2%Widowed
- 19.5%Divorced
- Females
- 30.2%Never married
- 49.9%Now married
- 1.4%Separated
- 7.3%Widowed
- 11.2%Divorced
Women who gave birth in the past 12 months
| Now married: | 92.0% (128) |
| Unmarried: | 8.0% (11) |
Women who did not give birth in the past 12 months
| Now married: | 49.9% (2,436) |
| Unmarried: | 50.1% (2,448) |
Marital status - Hispanic or Latino population 15 years and over
- Males
- 40.6%Never married
- 50.0%Now married
- 0.0%Separated
- 0.0%Widowed
- 9.4%Divorced
- Females
- 1.1%Never married
- 80.7%Now married
- 0.0%Separated
- 1.4%Widowed
- 16.8%Divorced
Women who did not give birth in the past 12 months
| Now married: | 98.3% (627) |
| Unmarried: | 1.7% (11) |
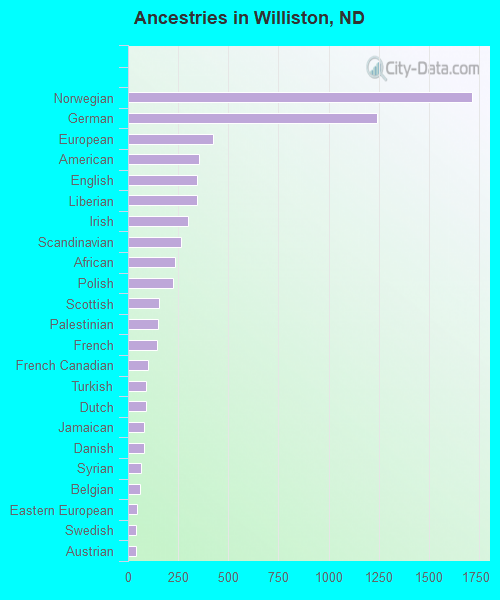
Ancestries in Williston

- 1,71418.4%Norwegian
- 1,24313.3%German
- 4224.5%European
- 3533.8%American
- 3443.7%English
- 3423.7%Liberian
- 3003.2%Irish
- 2652.8%Scandinavian
- 2342.5%African
- 2262.4%Polish
- 1541.6%Scottish
- 1481.6%Palestinian
- 1461.6%French
- 1011.1%French Canadian
- 911.0%Turkish
- 880.9%Dutch
- 800.9%Jamaican
- 780.8%Danish
- 650.7%Syrian
- 600.6%Belgian
- 450.5%Eastern European
- 420.4%Swedish
- 390.4%Austrian
- 120.1%Northern European
- 110.1%Australian
- 100.1%Finnish
- 100.1%Scotch-Irish
- 40.04%Canadian
- 10.01%Somali
Geographical mobility in Williston

- Same house 1 year ago
- 17,00280.4%White (Caucasian)
- 1,87992.4%Black or African American
- 34396.9%American Indian / Alaska Native
- 33390.5%Asian
- 1552.4%Native Hawaiian / Pacific Islander
- 1,72469.8%Other race
- 1,36468.8%Two or more races
- 15,97379.8%White alone, not Hispanic / Latino
- 2,60179.9%Hispanic or Latino

-
- Moved within same county
- 1,5027.1%White / Caucasian
- 100.5%Black or African American
- 61.8%American Indian / Alaska Native
- 328.8%Asian
- 1345.5%Native Hawaiian / Pacific Islander
- 592.4%Other race
- 42721.5%Two or more races
- 1,5187.6%White alone, not Hispanic / Latino
- 1103.4%Hispanic or Latino

-
- Moved within same state
- 1,1785.6%White / Caucasian
- 311.5%Black or African American
- 236.4%American Indian / Alaska Native
- 61024.7%Other race
- 50.3%Two or more races
- 1,0855.4%White alone, not Hispanic / Latino
- 65520.1%Hispanic or Latino

-
- Moved from different state
- 1,4146.7%White / Caucasian
- 954.7%Black or African American
- 804.0%Two or more races
- 1,3806.9%White alone, not Hispanic / Latino
- 441.4%Hispanic or Latino

-
- Moved from abroad
- 320.2%White
- 350.2%White alone, not Hispanic / Latino

Children Nativity (place of birth) in Williston
Place of birth for residents in Williston
![Place of birth for the foreign-born population - Regions]()
- 1,407Americas
- 1,230Latin America
- 981Africa
- 834Central America
- 540Asia
- 472Middle Africa
- 280Western Africa
- 260South Eastern Asia
- 258South America
- 231Europe
- 207Western Europe
- 177Northern America
- 137Caribbean
- 104Eastern Asia
- 86Western Asia
- 52Southern Africa
- 32China
- 26Oceania
- 24Northern Europe
- 12Australia and New Zealand Subregion
- 2Eastern Africa

![Place of birth for the foreign-born population - Countries]()
- 738Mexico
- 459Democratic Republic of Congo (Zaire)
- 260Philippines
- 207France
- 184Peru
- 177Canada
- 162Liberia
- 92Dominican Republic
- 86Turkey
- 86Ghana
- 73Colombia
- 54Korea
- 52South Africa
- 44Jamaica
- 31Nigeria
- 24Scotland
- 17Japan
- 16China
- 16Taiwan
- 14Marshall Islands
- 12Australia
- 10Cameroon
- 2Somalia
- 2Congo

Grandparents responsible for own grandchildren in Williston
Zip codes: 58801.