Races in Wilna, New York (NY) Detailed Stats
Ancestries, Foreign-born residents, place of birth
3.1% of Wilna, NY residents are foreign-born (2.1% born in Europe, 0.6% born in Asia), which is 614.4% less than the foreign-born rate of 22.0% across the entire state of New York.
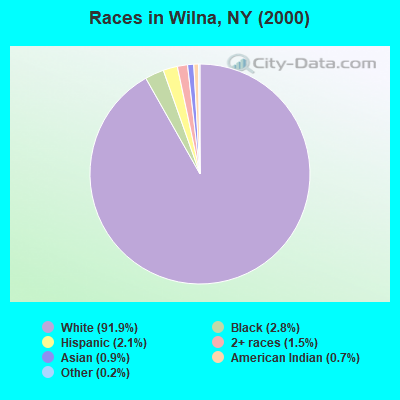
Race distribution in Wilna

- 5,73091.9%White alone
- 1742.8%Black alone
- 1312.1%Hispanic
- 911.5%Two or more races
- 540.9%Asian alone
- 410.7%American Indian alone
- 130.2%Other race alone
- 10.02%Native Hawaiian and Other
Pacific Islander alone
2000
2022
-
- 11,760,98162.0%White alone
- 2,867,58315.1%Hispanic
- 2,812,62314.8%Black alone
- 1,035,9265.5%Asian alone
- 366,1161.9%Two or more races
- 75,4990.4%Other race alone
- 52,4990.3%American Indian alone
- 5,2300.03%Native Hawaiian and Other
Pacific Islander alone

-
- 10,408,93352.9%White alone
- 3,867,29919.7%Hispanic
- 2,633,84013.4%Black alone
- 1,776,2869.0%Asian alone
- 732,6703.7%Two or more races
- 216,1101.1%Other race alone
- 35,0820.2%American Indian alone
- 6,9310.04%Native Hawaiian and Other
Pacific Islander alone

Income and house value in Wilna
- Median household income in 2022
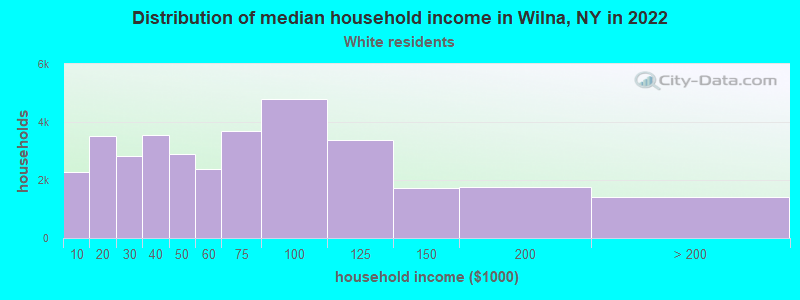
- $49,588White non-Hispanic householders
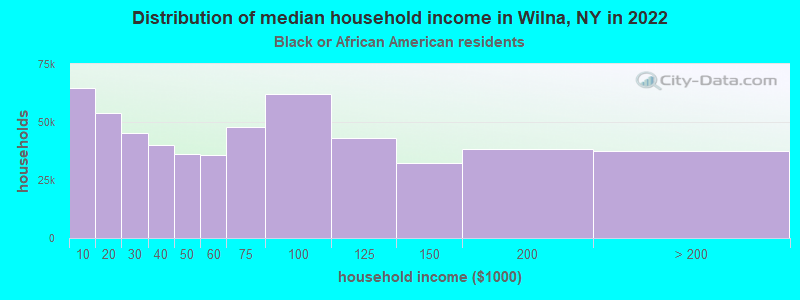
- $60,708Black householders
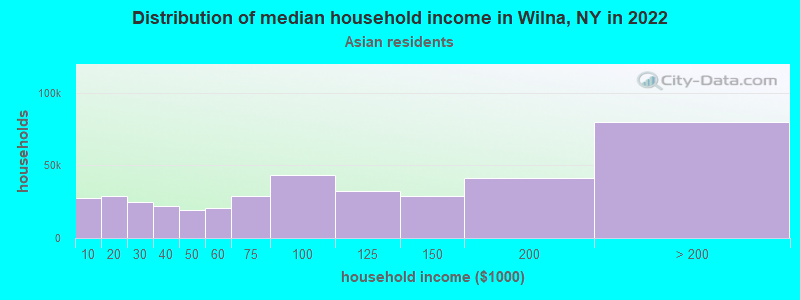
- $109,603Asian householders
- $67,456Some other race householders
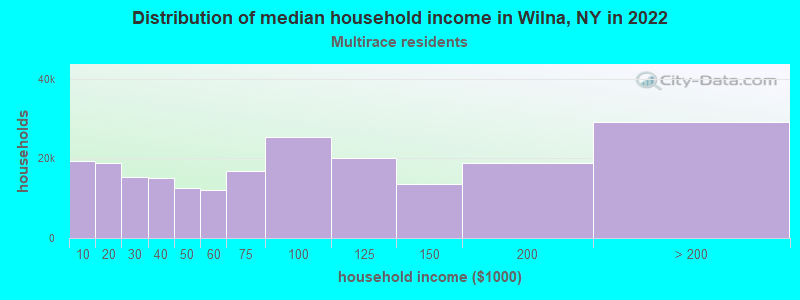
- $76,660Two or more races householders
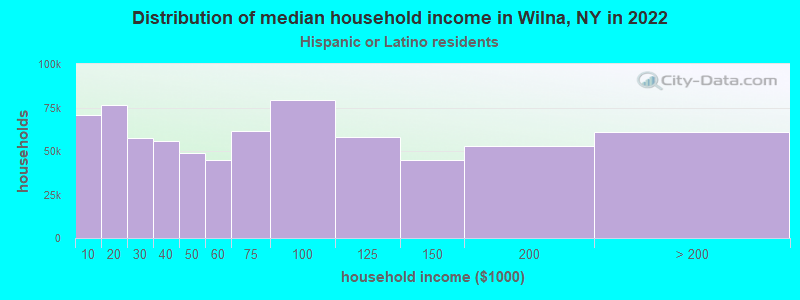
- $56,995Hispanic or Latino race householders
- Median 2022 house value
- $148,665White Non-Hispanic householders
- $228,509Black or African American householders
- $228,509Asian householders
- $154,580Two or more races householders
- $201,626Hispanic or Latino householders
Household income for White non-Hispanic householders
Household income for Black householders
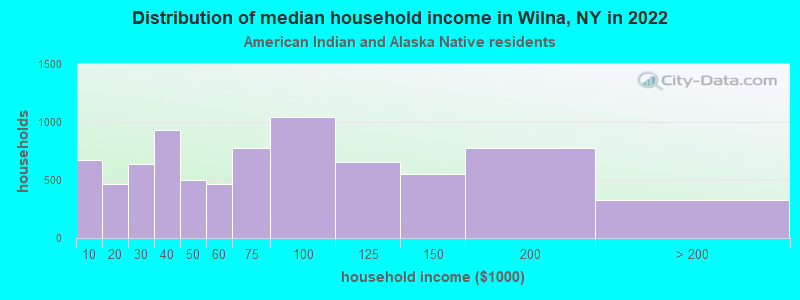
Household income for American Indian and Alaska Native householders
Household income for Asian householders
Household income for Two or more races householders
Household income for Hispanic or Latino race householders
Foreign-born residents in Wilna
192 residents are foreign born (2.1% Europe, 0.6% Asia).
| This city: | 3.1% |
| New York: | 20.4% |
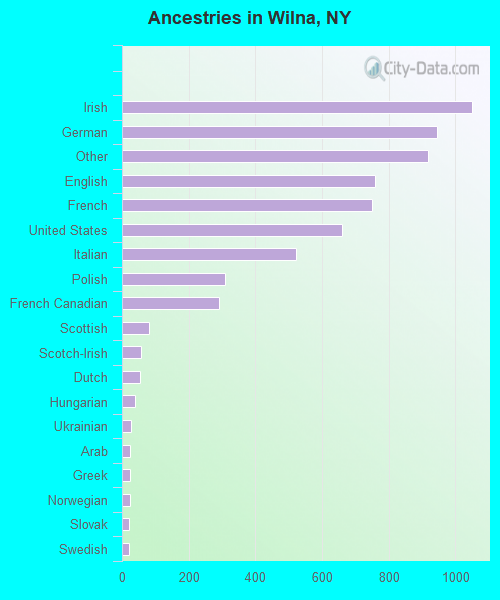
Ancestries in Wilna

- 1,04915.9%Irish
- 94614.3%German
- 91913.9%Other
- 75811.5%English
- 75011.3%French
- 66010.0%United States
- 5217.9%Italian
- 3094.7%Polish
- 2924.4%French Canadian
- 821.2%Scottish
- 580.9%Scotch-Irish
- 550.8%Dutch
- 390.6%Hungarian
- 260.4%Ukrainian
- 250.4%Arab
- 250.4%Greek
- 250.4%Norwegian
- 220.3%Slovak
- 220.3%Swedish
- 80.1%Welsh
- 70.1%Czech
- 60.09%Lithuanian
- 60.09%Russian
- 60.09%Subsaharan African
Zip codes: 13619.